BankNifty levels - Mar 17, 2025Utilizing the support and resistance levels of BankNifty, along with the 5-minute timeframe candlesticks and VWAP, can enhance the precision of trade entries and exits on or near these levels. It is crucial to recognize that these levels are not static, and they undergo alterations as market dynamics evolve.
The dashed lines on the chart indicate the reaction levels, serving as additional points of significance. Furthermore, take note of the response at the levels of the High, Low, and Close values from the day prior.
We trust that this information proves valuable to you.
* If you found the idea appealing, kindly tap the Boost icon located below the chart. We encourage you to share your thoughts and comments regarding it.
Wishing you successful trading endeavors!
Bankniftylevels

BankNifty levels - Mar 13, 2025Utilizing the support and resistance levels of BankNifty, along with the 5-minute timeframe candlesticks and VWAP, can enhance the precision of trade entries and exits on or near these levels. It is crucial to recognize that these levels are not static, and they undergo alterations as market dynamics evolve.
The dashed lines on the chart indicate the reaction levels, serving as additional points of significance. Furthermore, take note of the response at the levels of the High, Low, and Close values from the day prior.
We trust that this information proves valuable to you.
* If you found the idea appealing, kindly tap the Boost icon located below the chart. We encourage you to share your thoughts and comments regarding it.
Wishing you successful trading endeavors!
BankNifty levels -Mar 12, 2025Utilizing the support and resistance levels of BankNifty, along with the 5-minute timeframe candlesticks and VWAP, can enhance the precision of trade entries and exits on or near these levels. It is crucial to recognize that these levels are not static, and they undergo alterations as market dynamics evolve.
The dashed lines on the chart indicate the reaction levels, serving as additional points of significance. Furthermore, take note of the response at the levels of the High, Low, and Close values from the day prior.
We trust that this information proves valuable to you.
* If you found the idea appealing, kindly tap the Boost icon located below the chart. We encourage you to share your thoughts and comments regarding it.
Wishing you successful trading endeavors!
Bank Nifty Spot will it cross 52670Bank Nifty Spot has corrected almost 4500 points from recent ATH of 54460+ levels
From lower level retracements upto 52670 levels...
Now on every rise upto 52670 Levels will see selling pressure unless it closes above 52670 on D closing basis...
Have marked important levels for your perusal
Like... Share....
Happy Trading....

BankNifty levels - Mar 11, 2025Utilizing the support and resistance levels of BankNifty, along with the 5-minute timeframe candlesticks and VWAP, can enhance the precision of trade entries and exits on or near these levels. It is crucial to recognize that these levels are not static, and they undergo alterations as market dynamics evolve.
The dashed lines on the chart indicate the reaction levels, serving as additional points of significance. Furthermore, take note of the response at the levels of the High, Low, and Close values from the day prior.
We trust that this information proves valuable to you.
* If you found the idea appealing, kindly tap the Boost icon located below the chart. We encourage you to share your thoughts and comments regarding it.
Wishing you successful trading endeavors!

BankNifty levels - Mar 10, 2025Utilizing the support and resistance levels of BankNifty, along with the 5-minute timeframe candlesticks and VWAP, can enhance the precision of trade entries and exits on or near these levels. It is crucial to recognize that these levels are not static, and they undergo alterations as market dynamics evolve.
The dashed lines on the chart indicate the reaction levels, serving as additional points of significance. Furthermore, take note of the response at the levels of the High, Low, and Close values from the day prior.
We trust that this information proves valuable to you.
* If you found the idea appealing, kindly tap the Boost icon located below the chart. We encourage you to share your thoughts and comments regarding it.
Wishing you successful trading endeavors!

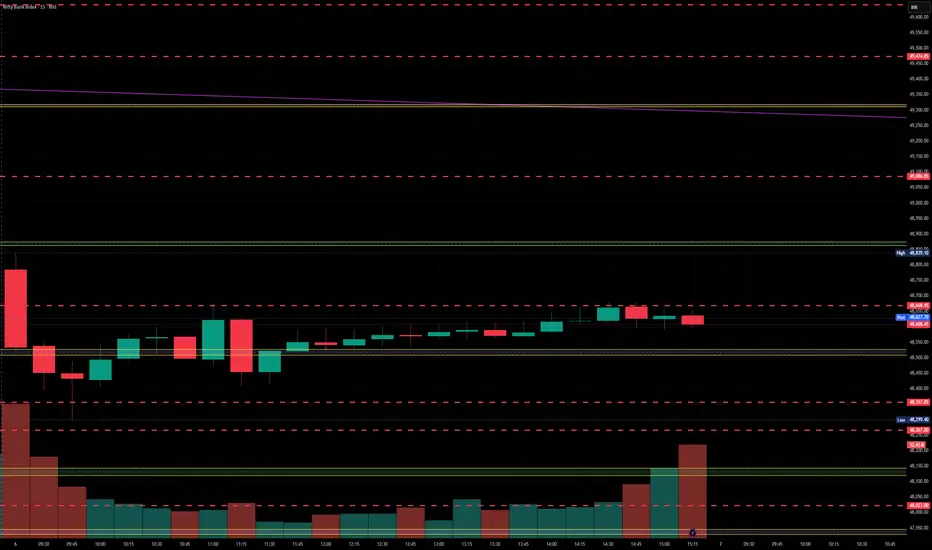
BankNifty levels - Mar 07, 2025Utilizing the support and resistance levels of BankNifty, along with the 5-minute timeframe candlesticks and VWAP, can enhance the precision of trade entries and exits on or near these levels. It is crucial to recognize that these levels are not static, and they undergo alterations as market dynamics evolve.
The dashed lines on the chart indicate the reaction levels, serving as additional points of significance. Furthermore, take note of the response at the levels of the High, Low, and Close values from the day prior.
We trust that this information proves valuable to you.
* If you found the idea appealing, kindly tap the Boost icon located below the chart. We encourage you to share your thoughts and comments regarding it.
Wishing you successful trading endeavors!
BankNifty levels - Mar 06, 2025Utilizing the support and resistance levels of BankNifty, along with the 5-minute timeframe candlesticks and VWAP, can enhance the precision of trade entries and exits on or near these levels. It is crucial to recognize that these levels are not static, and they undergo alterations as market dynamics evolve.
The dashed lines on the chart indicate the reaction levels, serving as additional points of significance. Furthermore, take note of the response at the levels of the High, Low, and Close values from the day prior.
We trust that this information proves valuable to you.
* If you found the idea appealing, kindly tap the Boost icon located below the chart. We encourage you to share your thoughts and comments regarding it.
Wishing you successful trading endeavors!

BankNifty levels - Mar 05, 2025Utilizing the support and resistance levels of BankNifty, along with the 5-minute timeframe candlesticks and VWAP, can enhance the precision of trade entries and exits on or near these levels. It is crucial to recognize that these levels are not static, and they undergo alterations as market dynamics evolve.
The dashed lines on the chart indicate the reaction levels, serving as additional points of significance. Furthermore, take note of the response at the levels of the High, Low, and Close values from the day prior.
We trust that this information proves valuable to you.
* If you found the idea appealing, kindly tap the Boost icon located below the chart. We encourage you to share your thoughts and comments regarding it.
Wishing you successful trading endeavors!

BankNifty levels - Mar 04, 2025Utilizing the support and resistance levels of BankNifty, along with the 5-minute timeframe candlesticks and VWAP, can enhance the precision of trade entries and exits on or near these levels. It is crucial to recognize that these levels are not static, and they undergo alterations as market dynamics evolve.
The dashed lines on the chart indicate the reaction levels, serving as additional points of significance. Furthermore, take note of the response at the levels of the High, Low, and Close values from the day prior.
We trust that this information proves valuable to you.
* If you found the idea appealing, kindly tap the Boost icon located below the chart. We encourage you to share your thoughts and comments regarding it.
Wishing you successful trading endeavors!

BankNifty levels - Mar 03, 2025Utilizing the support and resistance levels of BankNifty, along with the 5-minute timeframe candlesticks and VWAP, can enhance the precision of trade entries and exits on or near these levels. It is crucial to recognize that these levels are not static, and they undergo alterations as market dynamics evolve.
The dashed lines on the chart indicate the reaction levels, serving as additional points of significance. Furthermore, take note of the response at the levels of the High, Low, and Close values from the day prior.
We trust that this information proves valuable to you.
* If you found the idea appealing, kindly tap the Boost icon located below the chart. We encourage you to share your thoughts and comments regarding it.
Wishing you successful trading endeavors!

BANKNIFTY MATHEMATICAL LEVELSThese Levels are based on purely mathematical calculations.
How to use these levels :-
* Mark these levels on your chart.
* Safe players Can use 15 min Time Frame
* Risky Traders Can use 5 min. Time Frame
* When Candle give Breakout / Breakdown to any level we have to enter with High/Low of that breaking candle.
* Targets will be another level marked on chart
* Stop Loss will be Low/High of that Breaking Candle.
* Trail your SL with every candle.
* Avoid Big Candles as SL will be high then.
* This is one of the Best Risk Reward Setup.
For Educational purpose only

BankNifty levels - Feb 28, 2025Utilizing the support and resistance levels of BankNifty, along with the 5-minute timeframe candlesticks and VWAP, can enhance the precision of trade entries and exits on or near these levels. It is crucial to recognize that these levels are not static, and they undergo alterations as market dynamics evolve.
The dashed lines on the chart indicate the reaction levels, serving as additional points of significance. Furthermore, take note of the response at the levels of the High, Low, and Close values from the day prior.
We trust that this information proves valuable to you.
* If you found the idea appealing, kindly tap the Boost icon located below the chart. We encourage you to share your thoughts and comments regarding it.
Wishing you successful trading endeavors!

Bank Nifty View - 27 Feb 2025 - BNF Expiry short covering rally?Today, BNF has been accumulating since morning. We can expect a big move around 3 PM. Since today is the monthly expiry, there can be a short-covering rally.
I will however not be trading in large qty but just 1 lot to observe.

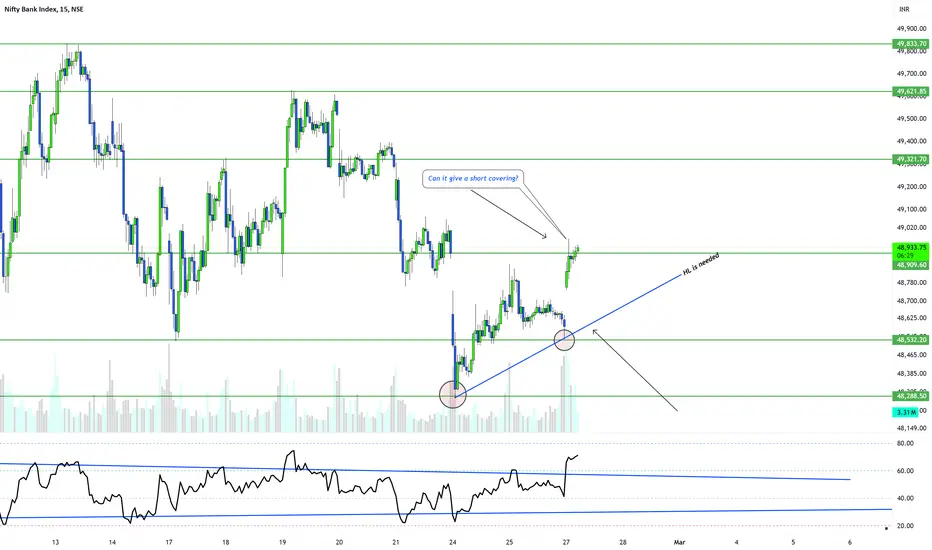
BANKNIFTY! Can it give a big move? Weekly zones!As per the trend BANKNIFTY is trying to sustain above 49000, which is a strong RESISTANCE.
If you want to follow up the trend UPSIDE then one should wait for HLs for a confirmation. Also, the trend changes if any of the big strikes gets eliminated. In this current scenario we are probably waiting for a confirmation.
I have marked the important Support & Resistances to help you in a better way.
INDIA VIX is down right now which is giving a good support to option buyers and Sellers.
As per the study let it close above today's high and give a HL confirmation for a trend change on a 15 mins time frame.
IMPORTANT ZONES TO WATCH : 49000-49100
NOTE: I'm not a SEBI reg. Study before investing.
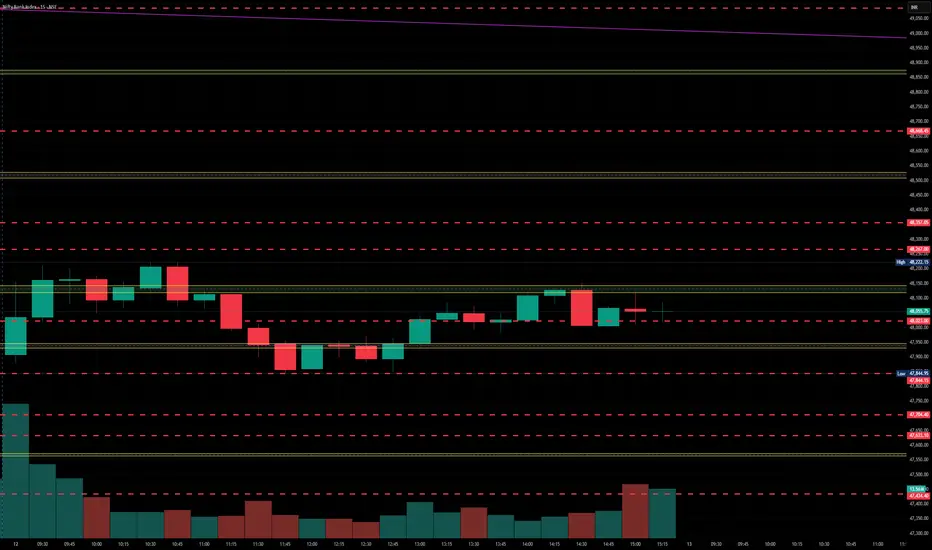
BankNifty levels - Feb 27, 2025Utilizing the support and resistance levels of BankNifty, along with the 5-minute timeframe candlesticks and VWAP, can enhance the precision of trade entries and exits on or near these levels. It is crucial to recognize that these levels are not static, and they undergo alterations as market dynamics evolve.
The dashed lines on the chart indicate the reaction levels, serving as additional points of significance. Furthermore, take note of the response at the levels of the High, Low, and Close values from the day prior.
We trust that this information proves valuable to you.
* If you found the idea appealing, kindly tap the Boost icon located below the chart. We encourage you to share your thoughts and comments regarding it.
Wishing you successful trading endeavors!

BankNifty levels - Feb 25, 2025Utilizing the support and resistance levels of BankNifty, along with the 5-minute timeframe candlesticks and VWAP, can enhance the precision of trade entries and exits on or near these levels. It is crucial to recognize that these levels are not static, and they undergo alterations as market dynamics evolve.
The dashed lines on the chart indicate the reaction levels, serving as additional points of significance. Furthermore, take note of the response at the levels of the High, Low, and Close values from the day prior.
We trust that this information proves valuable to you.
* If you found the idea appealing, kindly tap the Boost icon located below the chart. We encourage you to share your thoughts and comments regarding it.
Wishing you successful trading endeavors!

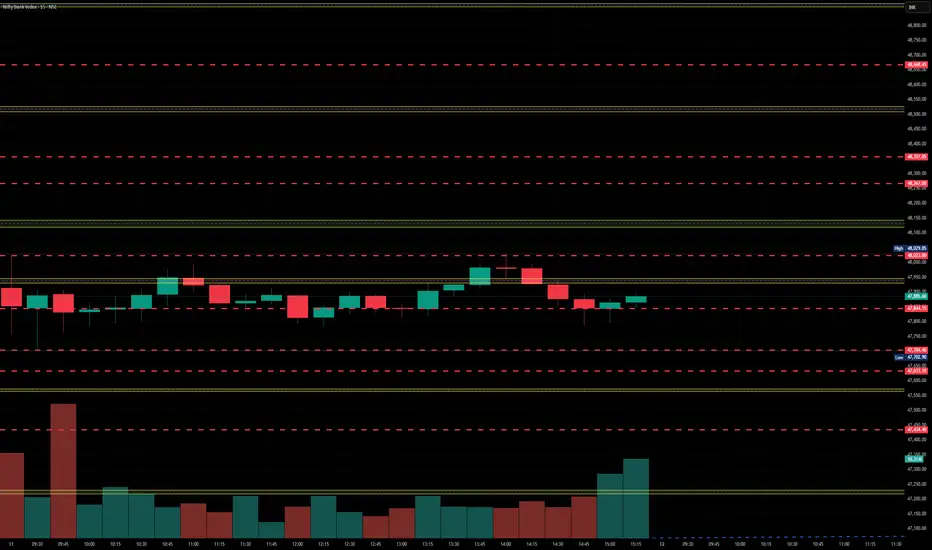
BankNifty levels - Feb 24, 2025Utilizing the support and resistance levels of BankNifty, along with the 5-minute timeframe candlesticks and VWAP, can enhance the precision of trade entries and exits on or near these levels. It is crucial to recognize that these levels are not static, and they undergo alterations as market dynamics evolve.
The dashed lines on the chart indicate the reaction levels, serving as additional points of significance. Furthermore, take note of the response at the levels of the High, Low, and Close values from the day prior.
We trust that this information proves valuable to you.
* If you found the idea appealing, kindly tap the Boost icon located below the chart. We encourage you to share your thoughts and comments regarding it.
Wishing you successful trading endeavors!

BANKNIFTY MATHEMATICAL LEVELSThese Levels are based on purely mathematical calculations.
How to use these levels :-
* Mark these levels on your chart.
* Safe players Can use 15 min Time Frame
* Risky Traders Can use 5 min. Time Frame
* When Candle give Breakout / Breakdown to any level we have to enter with High/Low of that breaking candle.
* Targets will be another level marked on chart
* Stop Loss will be Low/High of that Breaking Candle.
* Trail your SL with every candle.
* Avoid Big Candles as SL will be high then.
* This is one of the Best Risk Reward Setup.
For Educational purpose only

BankNifty levels - Feb 21, 2025Utilizing the support and resistance levels of BankNifty, along with the 5-minute timeframe candlesticks and VWAP, can enhance the precision of trade entries and exits on or near these levels. It is crucial to recognize that these levels are not static, and they undergo alterations as market dynamics evolve.
The dashed lines on the chart indicate the reaction levels, serving as additional points of significance. Furthermore, take note of the response at the levels of the High, Low, and Close values from the day prior.
We trust that this information proves valuable to you.
* If you found the idea appealing, kindly tap the Boost icon located below the chart. We encourage you to share your thoughts and comments regarding it.
Wishing you successful trading endeavors!

BaknNifty levels - Feb 20, 2025Utilizing the support and resistance levels of BankNifty, along with the 5-minute timeframe candlesticks and VWAP, can enhance the precision of trade entries and exits on or near these levels. It is crucial to recognize that these levels are not static, and they undergo alterations as market dynamics evolve.
The dashed lines on the chart indicate the reaction levels, serving as additional points of significance. Furthermore, take note of the response at the levels of the High, Low, and Close values from the day prior.
We trust that this information proves valuable to you.
* If you found the idea appealing, kindly tap the Boost icon located below the chart. We encourage you to share your thoughts and comments regarding it.
Wishing you successful trading endeavors!

what is macd divergence and why it is important ?**MACD Divergence** refers to a situation where the **Moving Average Convergence Divergence (MACD)** indicator shows a different trend direction than the price action of an asset. In other words, the MACD and the price of the asset move in opposite directions, which can signal potential changes in market trends and price reversals. Divergence is one of the most important patterns traders look for when using the MACD to forecast future price movements.
### **Why MACD Divergence is Important:**
1. **Indicates Potential Trend Reversal:**
- Divergence can signal that the current trend is losing strength and that a reversal may be imminent. When the price is making new highs or lows but the MACD is not, it often means that the momentum behind the trend is weakening, which could lead to a reversal.
2. **Helps in Identifying Market Sentiment:**
- Divergence provides insights into changing market sentiment. A **bullish divergence** (price makes lower lows, but the MACD makes higher lows) indicates increasing buying pressure, suggesting that the price may soon start to rise. Conversely, a **bearish divergence** (price makes higher highs, but the MACD makes lower highs) suggests weakening buying pressure, and the price might reverse downward.
3. **Aids in Timing Entries and Exits:**
- Divergence is an early warning signal, giving traders a heads-up before significant price moves. This can help traders time their entry or exit points more effectively.
### **Types of MACD Divergence:**
1. **Bullish Divergence:**
- **What it is:** Bullish divergence occurs when the price makes lower lows (indicating a downtrend), but the MACD forms higher lows (indicating increasing bullish momentum).
- **Why it’s important:** It suggests that while the price is still falling, the underlying momentum is shifting toward bullishness. This is often seen as a signal that the downtrend could be ending, and an upward reversal might be imminent.
**Example:**
- The price hits a lower low, but the MACD histogram shows higher lows or the MACD line itself does not make a lower low.
- This indicates that selling pressure is weakening, and a price reversal might occur soon.
2. **Bearish Divergence:**
- **What it is:** Bearish divergence happens when the price makes higher highs (indicating an uptrend), but the MACD forms lower highs (indicating decreasing bullish momentum).
- **Why it’s important:** It suggests that the upward momentum is fading, and the trend could reverse to the downside. This is a warning that the current uptrend might be running out of steam.
**Example:**
- The price reaches a higher high, but the MACD histogram shows lower highs or the MACD line fails to reach a higher high.
- This suggests that buying pressure is decreasing, and a potential bearish reversal is on the horizon.
### **How to Use MACD Divergence:**
1. **Watch for Divergence on the MACD Histogram or Line:**
- Divergence can be observed both in the MACD line and the MACD histogram.
- Look for a **difference** between the direction of the price action and the MACD (line or histogram).
2. **Confirm with Other Indicators:**
- MACD divergence alone is not a guaranteed signal. It's important to combine it with other technical analysis tools, such as **RSI**, **support and resistance**, or **trendlines**, to confirm the validity of the divergence.
- For instance, if you spot a bullish divergence on the MACD, you might want to check for oversold conditions on the **RSI** to increase the confidence in a potential upward price reversal.
3. **Trend Confirmation:**
- Once you notice a divergence, look for confirmation of the trend reversal. The **MACD crossover** (when the MACD line crosses the signal line) is a strong confirmation signal. A **bullish crossover** after a bullish divergence is a powerful signal that the price might begin an uptrend.
4. **Timing Entries:**
- **Bullish Divergence**: Once you identify a bullish divergence, you might consider entering a long position (buy) when the price starts to rise, especially after the MACD line crosses above the signal line.
- **Bearish Divergence**: After recognizing a bearish divergence, you could consider entering a short position (sell) when the price begins to fall, especially after the MACD line crosses below the signal line.
### **Example of Using MACD Divergence:**
Let’s say the price of an asset is in a downtrend and is making lower lows. However, when you look at the MACD, you see that it's making higher lows. This **bullish divergence** suggests that even though the price is still falling, the momentum is shifting toward an upward reversal. You could use this signal to wait for an actual trend reversal, possibly confirmed by a **MACD crossover** (where the MACD line crosses above the signal line).
### **Limitations of MACD Divergence:**
- **False Signals:** MACD divergence is not always accurate, and false signals can occur, especially in choppy or sideways markets.
- **Delayed Signal:** The MACD indicator is a lagging indicator, meaning it is based on past price data. Divergence signals often appear after the trend has already begun to lose momentum.
In conclusion, **MACD divergence** is a powerful tool that helps traders detect potential trend reversals and understand changing momentum. By carefully analyzing both the MACD and price action, traders can use divergence to time their entries and exits more effectively, though it's best used in combination with other indicators to confirm the signals.

BankNifty levels - Feb 19, 2025Utilizing the support and resistance levels of BankNifty, along with the 5-minute timeframe candlesticks and VWAP, can enhance the precision of trade entries and exits on or near these levels. It is crucial to recognize that these levels are not static, and they undergo alterations as market dynamics evolve.
The dashed lines on the chart indicate the reaction levels, serving as additional points of significance. Furthermore, take note of the response at the levels of the High, Low, and Close values from the day prior.
We trust that this information proves valuable to you.
* If you found the idea appealing, kindly tap the Boost icon located below the chart. We encourage you to share your thoughts and comments regarding it.
Wishing you successful trading endeavors!
