BankNifty levels - Feb 18, 2025Utilizing the support and resistance levels of BankNifty, along with the 5-minute timeframe candlesticks and VWAP, can enhance the precision of trade entries and exits on or near these levels. It is crucial to recognize that these levels are not static, and they undergo alterations as market dynamics evolve.
The dashed lines on the chart indicate the reaction levels, serving as additional points of significance. Furthermore, take note of the response at the levels of the High, Low, and Close values from the day prior.
We trust that this information proves valuable to you.
* If you found the idea appealing, kindly tap the Boost icon located below the chart. We encourage you to share your thoughts and comments regarding it.
Wishing you successful trading endeavors!
Bankniftylevels

What is rsi and how to use it ?RSI stands for **Relative Strength Index**, which is a momentum oscillator used in technical analysis to measure the speed and change of price movements. It is primarily used to identify whether an asset is overbought or oversold, helping traders make decisions about potential buy or sell opportunities.
### Key Points About RSI:
- **Scale**: RSI ranges from 0 to 100.
- **Overbought and Oversold Levels**:
- **Overbought**: When RSI is above 70, the asset is considered overbought, meaning it may be overvalued and could see a price reversal downward.
- **Oversold**: When RSI is below 30, the asset is considered oversold, meaning it might be undervalued and could see a price reversal upward.
### How to Use RSI:
1. **Identifying Overbought/Oversold Conditions**:
- **Overbought (RSI > 70)**: This suggests the asset may have been overbought, and a pullback or price reversal might occur. Traders might consider selling or shorting.
- **Oversold (RSI < 30)**: This suggests the asset may be oversold, and a rebound or price reversal might happen. Traders might consider buying.
2. **RSI Divergence**:
- **Bullish Divergence**: When the price makes new lows, but RSI forms higher lows, this can indicate a potential upward reversal or buying opportunity.
- **Bearish Divergence**: When the price makes new highs, but RSI forms lower highs, this may signal a potential downward reversal or selling opportunity.
3. **RSI and Trend Strength**:
- RSI can also help assess trend strength. For example, during a strong uptrend, the RSI might stay above 40-50 and consistently test the overbought zone. Similarly, in a strong downtrend, the RSI may hover below 60 and frequently test oversold conditions.
4. **RSI and Trend Reversals**:
- When the RSI crosses back above the 30 level (from below), it can signal the start of an uptrend (bullish reversal).
- When the RSI crosses back below the 70 level (from above), it can signal the start of a downtrend (bearish reversal).
### Practical Example of Using RSI:
- **Example 1: Overbought Condition**:
- Let's say a stock has an RSI of 75. This indicates it’s overbought, suggesting that a price pullback or correction might be on the horizon. Traders might consider selling or taking profits at this point.
- **Example 2: Oversold Condition**:
- If the RSI of a stock is 25, it indicates the stock is oversold and could be undervalued. Traders might look for a buying opportunity, anticipating that the price may rise.
### Limitations:
- RSI is more useful in ranging (sideways) markets than in trending markets. In strong trends, RSI may stay overbought or oversold for extended periods without reversing.
- RSI signals should ideally be combined with other indicators or chart patterns for confirmation.

what is Algo-trading and how to do it ?For instance, the algorithm would buy Microsoft (MSFT) shares if the current price is lower than the 20-day moving average and sell if the price exceeds the 20-day moving average. Algorithmic trading strategies can be as simple as this example, or they can be much more complex.
So, is algo trading profitable? Yes, it is possible, but there's a price attached that doesn't involve money! You must have all the knowledge to work with. It includes a fail-proof plan and risk management to protect against dangers.
How do I start trading in Algo?
How to Get Started with Algo Trading: A Step-by-Step Guide ...
Step 1: Understand the Basics. ...
Step 2: Choose Your Asset Class. ...
Step 3: Select a Trading Platform. ...
Step 4: Learn Programming. ...
Step 5: Develop Your Trading Strategy. ...
Step 6: Backtest Your Strategy. ...
Step 7: Go Live. ...
Step 8: Continuous Monitoring and Optimisation.

BankNifty levels - Feb 17, 2025Utilizing the support and resistance levels of BankNifty, along with the 5-minute timeframe candlesticks and VWAP, can enhance the precision of trade entries and exits on or near these levels. It is crucial to recognize that these levels are not static, and they undergo alterations as market dynamics evolve.
The dashed lines on the chart indicate the reaction levels, serving as additional points of significance. Furthermore, take note of the response at the levels of the High, Low, and Close values from the day prior.
We trust that this information proves valuable to you.
* If you found the idea appealing, kindly tap the Boost icon located below the chart. We encourage you to share your thoughts and comments regarding it.
Wishing you successful trading endeavors!

What is database trading and it is been done ?Reset restore all settings to the default values Done. Close Modal Dialog. End of dialog window. 3. Database trading, often referred to as *algorithmic trading* or *quantitative trading*, involves using computer algorithms to make automated trading decisions based on a large amount of data
A database is an electronically stored, systematic collection of data. It can contain any type of data, including words, numbers, images, videos, and files. You can use software called a database management system (DBMS) to store, retrieve, and edit data.
Databases are used to store and manage large amounts of structured and unstructured data, and they can be used to support a wide range of activities, including data storage, data analysis, and data management. They are used in a variety of settings, including business, scientific, and government organizations.

BankNifty levels - Feb 14, 2025Utilizing the support and resistance levels of BankNifty, along with the 5-minute timeframe candlesticks and VWAP, can enhance the precision of trade entries and exits on or near these levels. It is crucial to recognize that these levels are not static, and they undergo alterations as market dynamics evolve.
The dashed lines on the chart indicate the reaction levels, serving as additional points of significance. Furthermore, take note of the response at the levels of the High, Low, and Close values from the day prior.
We trust that this information proves valuable to you.
* If you found the idea appealing, kindly tap the Boost icon located below the chart. We encourage you to share your thoughts and comments regarding it.
Wishing you successful trading endeavors!

BankNifty levels - Feb 13, 2025Utilizing the support and resistance levels of BankNifty, along with the 5-minute timeframe candlesticks and VWAP, can enhance the precision of trade entries and exits on or near these levels. It is crucial to recognize that these levels are not static, and they undergo alterations as market dynamics evolve.
The dashed lines on the chart indicate the reaction levels, serving as additional points of significance. Furthermore, take note of the response at the levels of the High, Low, and Close values from the day prior.
We trust that this information proves valuable to you.
* If you found the idea appealing, kindly tap the Boost icon located below the chart. We encourage you to share your thoughts and comments regarding it.
Wishing you successful trading endeavors!

BankNifty levels - Feb 12, 2025Utilizing the support and resistance levels of BankNifty, along with the 5-minute timeframe candlesticks and VWAP, can enhance the precision of trade entries and exits on or near these levels. It is crucial to recognize that these levels are not static, and they undergo alterations as market dynamics evolve.
The dashed lines on the chart indicate the reaction levels, serving as additional points of significance. Furthermore, take note of the response at the levels of the High, Low, and Close values from the day prior.
We trust that this information proves valuable to you.
* If you found the idea appealing, kindly tap the Boost icon located below the chart. We encourage you to share your thoughts and comments regarding it.
Wishing you successful trading endeavors!

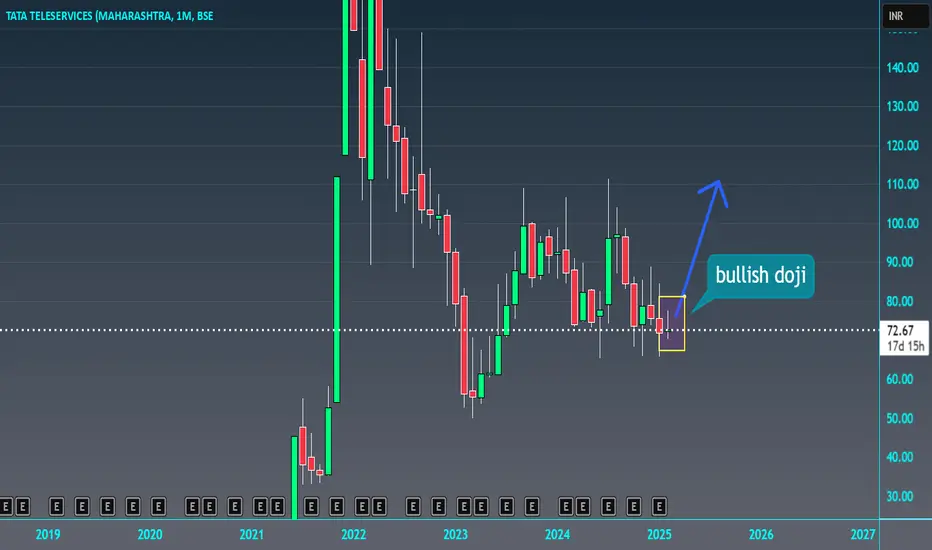
Tata Teleservices (Maharashtra) Ltd#TTML PERFECT REVERSAL CANDIDATE
TARGET - 82
ENTRY - 72
STOP LOSS - 70
TIME FRAME - MONTHLY
TECHNICALS - BULLISH DOJI CANDLE FORMED
THIS IS NOT ANY FINANCIAL ADVISE
As on 7th Feb 2025 TTML SHARE Price closed @ 72.04 and we RECOMMEND Strong Sell for LONG-TERM with Stoploss of 80.87 & Sell for SHORT-TERM with Stoploss of 76.08 we also expect STOCK to react on Following IMPORTANT LEVELS.
BankNifty levels - Feb 11, 2025Utilizing the support and resistance levels of BankNifty, along with the 5-minute timeframe candlesticks and VWAP, can enhance the precision of trade entries and exits on or near these levels. It is crucial to recognize that these levels are not static, and they undergo alterations as market dynamics evolve.
The dashed lines on the chart indicate the reaction levels, serving as additional points of significance. Furthermore, take note of the response at the levels of the High, Low, and Close values from the day prior.
We trust that this information proves valuable to you.
* If you found the idea appealing, kindly tap the Boost icon located below the chart. We encourage you to share your thoughts and comments regarding it.
Wishing you successful trading endeavors!

BankNifty levels - Feb 10, 2025Utilizing the support and resistance levels of BankNifty, along with the 5-minute timeframe candlesticks and VWAP, can enhance the precision of trade entries and exits on or near these levels. It is crucial to recognize that these levels are not static, and they undergo alterations as market dynamics evolve.
The dashed lines on the chart indicate the reaction levels, serving as additional points of significance. Furthermore, take note of the response at the levels of the High, Low, and Close values from the day prior.
We trust that this information proves valuable to you.
* If you found the idea appealing, kindly tap the Boost icon located below the chart. We encourage you to share your thoughts and comments regarding it.
Wishing you successful trading endeavors!

BANKNIFTY MATHEMATICAL LEVELSThese Levels are based on purely mathematical calculations.
How to use these levels :-
* Mark these levels on your chart.
* Safe players Can use 15 min Time Frame
* Risky Traders Can use 5 min. Time Frame
* When Candle give Breakout / Breakdown to any level we have to enter with High/Low of that breaking candle.
* Targets will be another level marked on chart
* Stop Loss will be Low/High of that Breaking Candle.
* Trail your SL with every candle.
* Avoid Big Candles as SL will be high then.
* This is one of the Best Risk Reward Setup.
For Educational purpose only

BankNifty levels - Feb 07, 2025Utilizing the support and resistance levels of BankNifty, along with the 5-minute timeframe candlesticks and VWAP, can enhance the precision of trade entries and exits on or near these levels. It is crucial to recognize that these levels are not static, and they undergo alterations as market dynamics evolve.
The dashed lines on the chart indicate the reaction levels, serving as additional points of significance. Furthermore, take note of the response at the levels of the High, Low, and Close values from the day prior.
We trust that this information proves valuable to you.
* If you found the idea appealing, kindly tap the Boost icon located below the chart. We encourage you to share your thoughts and comments regarding it.
Wishing you successful trading endeavors!

BankNifty levels - Feb 06, 2025Utilizing the support and resistance levels of BankNifty, along with the 5-minute timeframe candlesticks and VWAP, can enhance the precision of trade entries and exits on or near these levels. It is crucial to recognize that these levels are not static, and they undergo alterations as market dynamics evolve.
The dashed lines on the chart indicate the reaction levels, serving as additional points of significance. Furthermore, take note of the response at the levels of the High, Low, and Close values from the day prior.
We trust that this information proves valuable to you.
* If you found the idea appealing, kindly tap the Boost icon located below the chart. We encourage you to share your thoughts and comments regarding it.
Wishing you successful trading endeavors!

BankNifty levels - Feb 05, 2025Utilizing the support and resistance levels of BankNifty, along with the 5-minute timeframe candlesticks and VWAP, can enhance the precision of trade entries and exits on or near these levels. It is crucial to recognize that these levels are not static, and they undergo alterations as market dynamics evolve.
The dashed lines on the chart indicate the reaction levels, serving as additional points of significance. Furthermore, take note of the response at the levels of the High, Low, and Close values from the day prior.
We trust that this information proves valuable to you.
* If you found the idea appealing, kindly tap the Boost icon located below the chart. We encourage you to share your thoughts and comments regarding it.
Wishing you successful trading endeavors!

BankNifty levels - Feb 04, 2025Utilizing the support and resistance levels of BankNifty, along with the 5-minute timeframe candlesticks and VWAP, can enhance the precision of trade entries and exits on or near these levels. It is crucial to recognize that these levels are not static, and they undergo alterations as market dynamics evolve.
The dashed lines on the chart indicate the reaction levels, serving as additional points of significance. Furthermore, take note of the response at the levels of the High, Low, and Close values from the day prior.
We trust that this information proves valuable to you.
* If you found the idea appealing, kindly tap the Boost icon located below the chart. We encourage you to share your thoughts and comments regarding it.
Wishing you successful trading endeavors!

BankNifty levels - Feb 03, 2025Utilizing the support and resistance levels of BankNifty, along with the 5-minute timeframe candlesticks and VWAP, can enhance the precision of trade entries and exits on or near these levels. It is crucial to recognize that these levels are not static, and they undergo alterations as market dynamics evolve.
The dashed lines on the chart indicate the reaction levels, serving as additional points of significance. Furthermore, take note of the response at the levels of the High, Low, and Close values from the day prior.
We trust that this information proves valuable to you.
* If you found the idea appealing, kindly tap the Boost icon located below the chart. We encourage you to share your thoughts and comments regarding it.
Wishing you successful trading endeavors!

BankNifty levels - Feb 01, 2025Utilizing the support and resistance levels of BankNifty, along with the 5-minute timeframe candlesticks and VWAP, can enhance the precision of trade entries and exits on or near these levels. It is crucial to recognize that these levels are not static, and they undergo alterations as market dynamics evolve.
The dashed lines on the chart indicate the reaction levels, serving as additional points of significance. Furthermore, take note of the response at the levels of the High, Low, and Close values from the day prior.
We trust that this information proves valuable to you.
* If you found the idea appealing, kindly tap the Boost icon located below the chart. We encourage you to share your thoughts and comments regarding it.
Wishing you successful trading endeavors!

BANKNIFTY MATHEMATICAL LEVELSThese Levels are based on purely mathematical calculations.
How to use these levels :-
* Mark these levels on your chart.
* Safe players Can use 15 min Time Frame
* Risky Traders Can use 5 min. Time Frame
* When Candle give Breakout / Breakdown to any level we have to enter with High/Low of that breaking candle.
* Targets will be another level marked on chart
* Stop Loss will be Low/High of that Breaking Candle.
* Trail your SL with every candle.
* Avoid Big Candles as SL will be high then.
* This is one of the Best Risk Reward Setup.
For Educational purpose only

BankNifty levels - Jan 31, 2025Utilizing the support and resistance levels of BankNifty, along with the 5-minute timeframe candlesticks and VWAP, can enhance the precision of trade entries and exits on or near these levels. It is crucial to recognize that these levels are not static, and they undergo alterations as market dynamics evolve.
The dashed lines on the chart indicate the reaction levels, serving as additional points of significance. Furthermore, take note of the response at the levels of the High, Low, and Close values from the day prior.
We trust that this information proves valuable to you.
* If you found the idea appealing, kindly tap the Boost icon located below the chart. We encourage you to share your thoughts and comments regarding it.
Wishing you successful trading endeavors!

BankNifty levels - Jan 30, 2025Utilizing the support and resistance levels of BankNifty, along with the 5-minute timeframe candlesticks and VWAP, can enhance the precision of trade entries and exits on or near these levels. It is crucial to recognize that these levels are not static, and they undergo alterations as market dynamics evolve.
The dashed lines on the chart indicate the reaction levels, serving as additional points of significance. Furthermore, take note of the response at the levels of the High, Low, and Close values from the day prior.
We trust that this information proves valuable to you.
* If you found the idea appealing, kindly tap the Boost icon located below the chart. We encourage you to share your thoughts and comments regarding it.
Wishing you successful trading endeavors!

BankNifty levels - Jan 29, 2025Utilizing the support and resistance levels of BankNifty, along with the 5-minute timeframe candlesticks and VWAP, can enhance the precision of trade entries and exits on or near these levels. It is crucial to recognize that these levels are not static, and they undergo alterations as market dynamics evolve.
The dashed lines on the chart indicate the reaction levels, serving as additional points of significance. Furthermore, take note of the response at the levels of the High, Low, and Close values from the day prior.
We trust that this information proves valuable to you.
* If you found the idea appealing, kindly tap the Boost icon located below the chart. We encourage you to share your thoughts and comments regarding it.
Wishing you successful trading endeavors!

BankNifty levels - Jan 28, 2025Utilizing the support and resistance levels of BankNifty, along with the 5-minute timeframe candlesticks and VWAP, can enhance the precision of trade entries and exits on or near these levels. It is crucial to recognize that these levels are not static, and they undergo alterations as market dynamics evolve.
The dashed lines on the chart indicate the reaction levels, serving as additional points of significance. Furthermore, take note of the response at the levels of the High, Low, and Close values from the day prior.
We trust that this information proves valuable to you.
* If you found the idea appealing, kindly tap the Boost icon located below the chart. We encourage you to share your thoughts and comments regarding it.
Wishing you successful trading endeavors!
