Bank Nifty Swing Trading Setup - RRR 1:4Bank Nifty forming ending diagonal wave 3 is running (C- c2) so go long at around 59000 and target is 60200-60500 risk around 300 points ( swing low) reward 1200 points RRR is around 1:4 it's good strategy follow risk management strictly happy trading journey ...
Bankniftylong

Bank Nifty Neowave UpdateNSE:BANKNIFTY
Namaskaram Everyone
Welcome to intelligent investor, we provide market insights by synchronising and combining all the price action waves from different time frames and gives you single trend.
Degree Information

BANKNIFTY : Trading levels and plan for 18-Sep-2025BANK NIFTY TRADING PLAN – 18-Sep-2025
📊 Levels from the chart:
Opening Resistance: 55,599
Last Intraday Resistance: 56,265
Opening Support Zone: 55,164 – 55,038
Last Intraday Support: 54,858
🚀 Gap-Up Opening (200+ points above previous close)
If Bank Nifty opens above 55,680–55,700, it indicates a continuation of bullish momentum. The immediate test would be at Opening Resistance (55,599). A sustained move above this level can fuel a rally towards 56,000–56,265 (Last Intraday Resistance).
📌 Trading Approach:
Intraday buyers can look for long entries above 55,700, targeting 56,100–56,265.
Stop-loss should be placed below 55,500 on a 15-min closing basis.
If Bank Nifty struggles near resistance and shows rejection candles, partial profit booking is wise, as resistance zones often attract profit-taking.
📉 Flat Opening (within ±200 points of 55,480)
A flat opening around the previous close would keep the index near the mid-zone of support and resistance. In such scenarios, market participants should avoid aggressive trades in the first 30 minutes and allow price action to settle.
📌 Trading Approach:
If the index sustains above 55,599, bullish momentum may continue towards 55,900–56,265.
If the index rejects resistance and falls below 55,300, expect a dip towards the Opening Support Zone (55,164–55,038).
Best strategy here: Wait for a breakout or breakdown from the consolidation range, then ride the trend with small risk defined by nearest support/resistance.
🔻 Gap-Down Opening (200+ points below previous close)
A gap-down below 55,280–55,250 would indicate short-term weakness. The index would then test the Opening Support Zone (55,164–55,038) . If this support holds, a sharp pullback rally is possible. However, if it breaks, prices may drift lower towards the Last Intraday Support at 54,858 .
📌 Trading Approach:
If Bank Nifty holds 55,038 and forms a reversal candle, intraday traders can play for a bounce back to 55,300–55,500.
If it breaks 55,038, fresh shorts can be considered with targets towards 54,858.
Stop-loss for shorts should be placed just above the broken support zone to manage risk effectively.
🛡️ Risk Management Tips for Options Traders
Never chase premiums after a gap opening; wait for retracement before entering.
Use spreads (Bull Call or Bear Put) to limit risk in volatile sessions.
Always define your maximum risk capital per trade (ideally not more than 2% of your account).
Avoid holding naked options near resistance/support without a hedge.
Scale out of profitable positions gradually instead of waiting for exact targets.
📌 Summary & Conclusion
Above 55,599, momentum may extend towards 56,265.
Flat opening requires patience; wait for breakout above 55,599 or breakdown below 55,300.
Below 55,038, weakness may deepen towards 54,858.
Discipline, patience, and respecting stop-loss levels will be the key for navigating tomorrow’s session.
⚠️ Disclaimer
I am not a SEBI registered analyst . This trading plan is purely for educational purposes. Traders should do their own research or consult a financial advisor before taking positions.

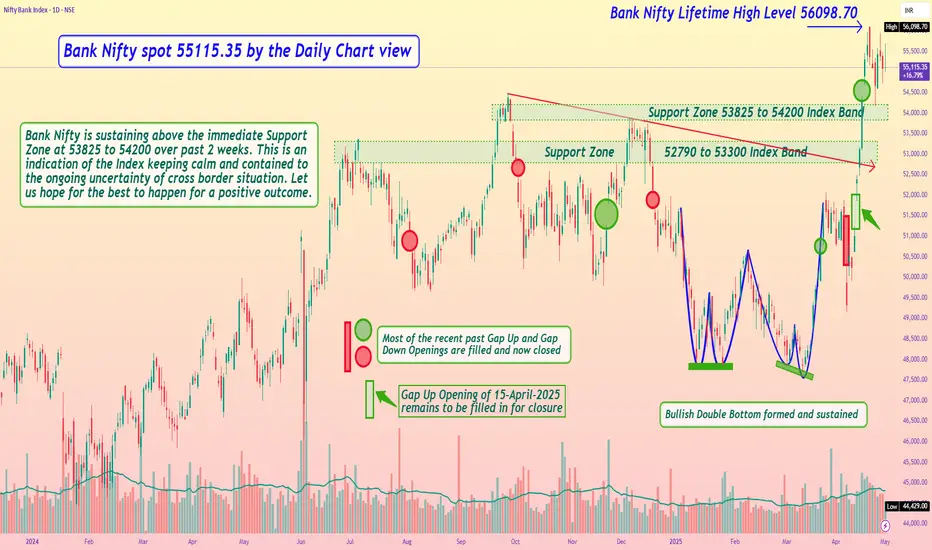
Bank Nifty spot 55115.35 by the Daily Chart view - Weekly UpdateBank Nifty spot 55115.35 by the Daily Chart view - Weekly Update
- Support Zone 53825 to 54200 Index Band
- Next Support Zone 52790 to 53300 Index Band
- Resistance seen only at Bank Nifty Lifetime High Level 56098.70
- Bank Nifty is sustaining above the immediate Support Zone at 53825 to 54200 over past 2 weeks.
- This is an indication of the Index keeping calm and contained to the ongoing uncertainty of cross border situation
- Let us hope for the best to happen for a positive outcome over the coming days/weeks and foresee New ATH creation
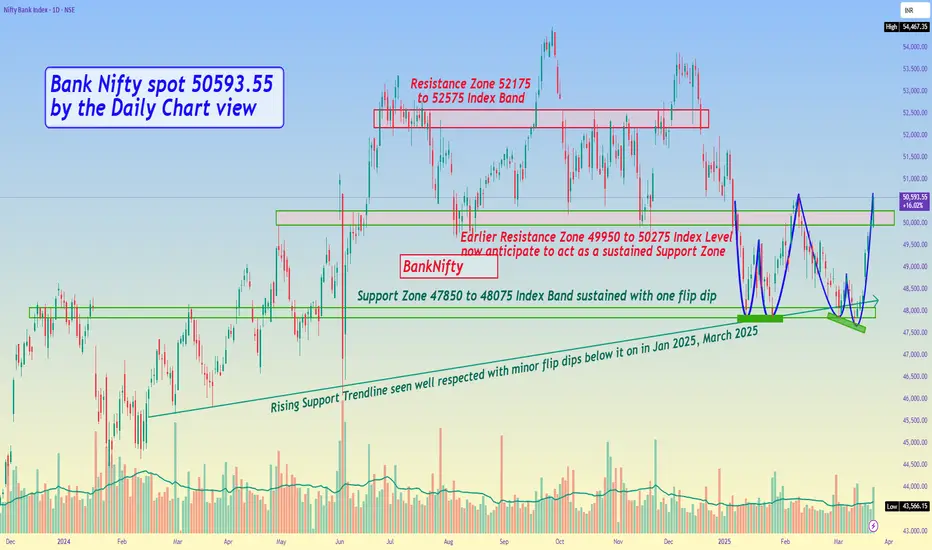
Bank Nifty spot 50593.55 by the Daily Chart view - Weekly updateBank Nifty spot 50593.55 by the Daily Chart view - Weekly update
- 1st Bullish "W" Double Bottom completed at the Lower Support Zone Index Band is maintained
- 2nd Bullish "W" Double Bottom too has been completed with minor flip dip below Lower Support Zone
- Earlier Resistance Zone 49950 to 50275 Index level is now anticipated to act as a sustained Support Zone
- Lower level Support Zone 47850 to 48075 Index Band has been sustained with minor one flip dips below it
- Rising Support Trendline is seen to be well respected with minor flip dips below it in Jan 2025 and March 2025
Option and Database TradingOption chain analysis is the process of evaluating the information provided in the option chain to identify potential trading opportunities. Traders use option chain analysis to evaluate the market's expectations of an asset's future price movements and make informed decisions about their investments.
The Option Chain is a table that contains the most critical information needed to purchase and sell options. We have previously discussed calls and puts, underlying prices, strike prices, expiration, and moneyness. The option chain is where all of this comes together (just like that map of the metro network).

Bank nifty Long term viewI analyzed this few months ago and its valid...so let's see If it crosses ATH and sustains then get ready for new ATH. Just look at the chart you'll understand if you're a trader or an investor in Indian stock market. But it must make 55k as good consolidation area or level for another bull run. Only my personal view does not consider this as advice.

#BANKNIFTY - 11 NOVEMBER !!NSE:BANKNIFTY
#NIFTYBANK ⚡
Observe, understand, then implement 👍🏻
Strategy name : Higher Highs and Higher Lows
This strategy is commonly used in trending markets to identify potential buy opportunities during an uptrend.
Key Components of the Strategy:
1. Higher Highs and Higher Lows: In an uptrend, price action creates successive peaks (higher highs) and troughs (higher lows). These are signals of bullish momentum, where buyers are consistently pushing prices higher.
2. Trend Channel: The image shows a channel formed by connecting the higher lows with a trendline (lower boundary) and higher highs with another trendline (upper boundary). This channel helps traders identify the price range within which the trend is moving.
3. Entry Points:
- The strategy suggests buying near the trendline at each higher low, which represents a potential support area within the trend. In the image, these points are marked as "BUY" or "ENTRY."
- Buying near these higher lows increases the chance of entering trades at favorable prices during pullbacks in the uptrend.
4. Profit Targets:
- Profit targets are set near the upper trendline or at subsequent higher highs. In the image, these points are marked as "PROFITS" with checkmarks.
- This method helps traders secure profits as the price reaches the higher end of the channel.
Managing the Trade:
- After the first entry and a successful profit, traders can re-enter the market on the next pullback to a higher low.
- Stop losses are typically placed below the previous higher low to manage risk in case the trend reverses.
Summary:
This strategy aims to capture gains in a trending market by entering trades at higher lows and exiting near higher highs within a channel. It works well in a stable, consistent uptrend but requires careful monitoring of trend changes to avoid potential losses if the trend breaks down.
Ps note : I'm not SEBI Registere 🙏🏻
Any queries @thetradeforecast 🇮🇳

Is the Trend About to Shift ?Nifty and Bank Nifty have consolidated in the past week,
Nifty has resistance at - 24500 -24700
Support : 24100 will act as laxman rekha for any further upside.
Bank Nifty
Resistance : 51700-52300-52600
Support : 51150-50350
Bank Nifty is creating a W pattern breakout above 52600 for a target of 55000

Will Nifty and Bank Nifty create new Lows or Bounce is around?Nifty and Banknifty are taking supports of trend lines and support zone!
Next week is going to be crucial for the markets.
Nifty
Support zone : 23900
Resistance : 24400-24600
Bank Nifty
Support Zone : 50100
Resistane : 51400-51700

Bank Nifty - Sideways to BullishBank nifty may try to take support near 51000-51100 areas
if so happens will try to remain a little sideways then go positive
First upside hurdle it faces at 52350 till then no brakes
Market too volatile & choppy, Trade cautiously

Banknifty Levels 03 Sep 24Banknifty sustains above 51411 then 51550 is possible. If banknifty breaks 51268 then 51126 is possible.

Bank Nifty Reversal Trade-Setup with Great RRBank Nifty is trading at big demand zone and and we see significant potential for an upside move for several reasons:
Reasons for Going Long in Bank Nifty:
1. Ichimoku Daily Cloud Bottom
2. Ichimoku Weekly KS Support
3. Bullish MACD Divergence on the 1-hour time frame
4. Completing Triple Correction—WXYXZ (considering a truncated scenario; otherwise, BN might aim for the 127% and 161.8% levels mentioned in the earlier post)
CMP: 49,718
Expected Targets: 51,300, 51,700
Stop Loss: 49,590
Disclaimer : We are not SEBI registered. The content presented here is based on personal opinions. Conduct your own research and consult with a qualified financial advisor before making any investment decisions.

BANKNIFTY IMPORTANT LEVELS FOR TOMORROW, 1TH AUGUST NSE:BANKNIFTY ANALYSIS FOR TOMORROW 🔺
❇️ IMPORTANT LEVELS 🚀
❇️ Support: 51390-50930-50490.
❇️ Resistance : 51650-52070-52355-52790.
👉🏻 Purple line is a key level, above buying, Below selling.
👉🏻No rate cut till September announced in federal general meeting.
👉🏻 Follow the levels and trade 👍🏻
@thetradeforecast 🇮🇳

#BANKON RECOVERY 29/07/2024NIFTY BANKNIFTY has its recovery rally now its probability of achieving the target means trying to touch its all-time high and it should be showing 500 600 + points on the move and creating a new all-time high but if it crosses level 52500 then it will happen so not be bothered to trade and go ahead to clear the losses and stand on profit
L E V E L S:-
SUPPORT-51000
RESISTANCE-51150, 51500

BANKNIFTY - INTERESTING CLOSING EXACTLY AT PREVIOUS SUPPORTHi All,
This idea is about Banknifty
BankNifty give a interesting closing exactly at the support made on 11 July at 51750
On the upside, targets of 52000, 52400 & on the downside support at 51350, 51150
Thanks,
Stock-n-Shine

# BANK NIFTY • Bank Nifty Support level 52200
• Resistance level 52600
• Bank Nifty by chance gap up ka to gap down 52200 & 52600 Range open after continuous one direction move possible
• Education purpose level seen that 5 days

A Breakout in HDFC can take Bank Nifty to one more High? July 243rd July, 2024: Bank Nifty Elliott Wave Analysis
The impulse that started on June 4th after the election day crash is still ongoing and progressing through waves 1, 2, 3, 4, and 5.
Bank Nifty has completed waves 1, 2, and 3, and currently, we are in wave 4 (at present, we're not considering further extension scenarios of wave 3).
HDFC Bank & Bank Nifty:
HDFC Bank has a 28.38% weightage in the Bank Nifty index, and currently, HDFC is standing at a multi-year breakout level.
We shared the HDFC Bank analysis a few weeks ago; please check the link below.
[ Link to HDFC Bank Analysis ]
Buy Entry Points:
Wait for a good dip near the 51600-51800 range and check if the price forms a W pattern and gives a breakout above the TS, KS & Cloud in Ichimoku.
Exit Points:
We have to wait for the wave 4 low point to determine the wave 5 target. We will update the status here and in our Telegram group: t.me
Stop Loss:
100-150 points below the wave 4 low point. We will update once we get confirmation.
The risk-to-reward ratio will be great because wave 5 is expected to cross 53K.
Note: This trade is not active yet. Confirmation is always good for entry and exit.
Disclaimer: We are not SEBI registered. The content presented here is based on personal opinions. Conduct your own research and consult with a qualified financial advisor before making any investment decisions.

Bank Nifty Reversal Trade From Demand Zone, Small SL 52030Please refer the chart, we have explained everything(wave counting, price action, channel etc).
We were short yesterday and booked profit near our target.
Currently Bank nifty is holding this channel and price is bottoming out so we are selling PE with OTM Pe edge.
Our SL is small and it will hit if price goes down again in extension mode.
Stop loss is 52030
Targets; 52511 and 52650
Disclaimer: We are not SEBI registered. The content presented here is based on personal opinions. Conduct your own research and consult with a qualified financial advisor before making any investment decisions.
Please follow us on Telegram for real time updates, it's FREE - t.me

Cup and Handle Bullish Breakout levels in Weekly ChartBank nifty Bullish view in weekly chart, aggressive and conservative traders levels
CONSERVATIVE TRADER ENTRY ZONE 44180 - 44250
AGGRESSIVE TRADER ENTRY ZONE 41700 - 41800
STOP-LOSS >>DAY'S CANDLE CLOSE BELOW 37350
T2 >> PROFIT BOOKING ZONE 50300 -50400
T1 >> PROFIT BOOKING ZONE 45900 - 46000

Banknifty prediction for Today 24 MayAs we discussed, Banknifty gave a very nice momentum with huge bullishness.
If we look at the chart now:
The market has broken the wedge pattern to the upside, and it is also continuously making HH and HL. The price is trading above EMAs, which shows strength in the price. Also, RSI > 60 shows huge bullishness in the market.
If we look at the OI data:
PCR = 1.20, which has risen from 0.73, shows huge PE writing on the Lower side, indicating a bullish structure in the market. The market does not have much CE writing on the higher side. That makes bulls more powerful.
Lower levels have good support levels, as shown in the OI chart.
I am expecting a sideways market to go bullish. It might take some sideways consolidation, but I am overall bullish on the market.
Reason:
RSI > 60 shows the market is having very good strength.
Price > EMA(13,200), which indicates powerful bull market.
The market has broken the pattern to the upside while making HH and HL.
PCR = 1.20 shows a heavily bullish nature in the market.
price > VWAP shows weak market structure.
Verdict: Sideways or Bullish
Plan of action:
Sell 48600 PE and 49100 CE (Hedge it with 15/- premium)
Note: Exit the opposite either side it breaks

BANKNIFTY prediction for tomorrow 16 May 2024Banknifty has been Bearish for the last two weeks. Now, Bank Nifty is in the support zone.
If we look at the chart now:
Banknifty has successfully broken the bearish trend to the upside. It gave a nice V-shape recovery. But big players have not accumulated the quantity, and that's why there was huge volatility yesterday. The market has taken support at Fib 0.38 of the current minor trend. It is in range bound 47578-47935. if it breaks 47935 to the upside, the market can form a higher high till 48432.
If we look at the OI data:
PCR = 0.86, which shows that next week's market is bullish. That's why big players are accumulating the quantity at lower levels.
There is only a significant level of resistance at 48000—other than that, all levels have very normal CE and PE writing.
I am expecting the market to go bullish for next week's expiry and sideways for tomorrow's session :
Reasons:
RSI is 40-60 shows the market is going to be sideways.
Price ~= EMA (13) but less than 200 EMA, which shows the market still has to break 200 EMA to go bullish.
PCR = 0.86 shows a bullish sign for tomorrow. But as it is the 1st day of the expiry session, it will not make much difference.
The market taking support from the Lower channel of Vwap means bulls are getting strength.
The market has already given a breakout after little accumulation; soon, it will shoot to the upside.
Market has been providing good volume at buying candles shows upcoming bullish market structure.
Verdict:
Sideways or Bullish
Plan of action:
Sell 48000 CE and Sell 47600 PE (Hedge with 20/- Premium)

BANKNIFTY - GOOD TIME TO CREATE LONGS ?Symbol - BANKNIFTY
BANKNIFTY gave a breakout of ATH & touched 49000 level & then exhibited some profit booking due to global news flow. It is currently trading at 47335 which is a good support area.
I think BN will take support at these levels & will show a reversal from here.
Hence I am creating long positions in BN futures at CMP 47335.
I will add more position between 47080 - 47200, if comes.
My SL would be below 47000 & Targets I'm looking for are 47900 - 48470 - ATH.
