BANKNIFTY : Trading levels and Plan for 08-Dec-2025📊 BANKNIFTY TRADING PLAN — 08 DEC 2025
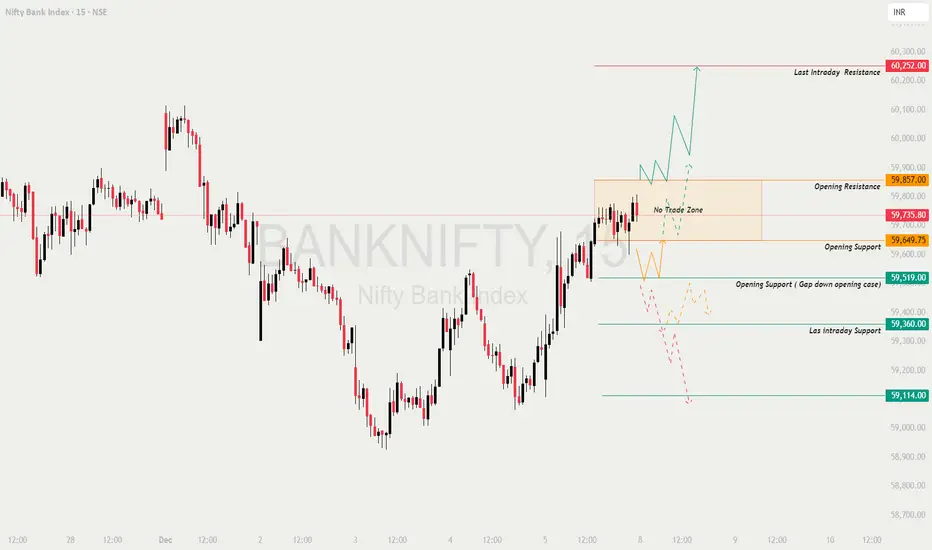
BankNifty closed around 59,735, positioned inside a No Trade Zone (59,649–59,857) where price tends to whipsaw.
A decisive move outside this range will determine the trend for the session.
Key Levels from the chart:
• Opening Resistance: 59,857
• Opening Support: 59,649
• Gap-down Support: 59,519
• Last Intraday Support: 59,360
• Deep Support: 59,114
• Last Intraday Resistance: 60,252
Tomorrow’s open will shape directional conviction.
🚀 1. GAP-UP OPENING (200+ points)
A gap-up above 59,950–60,000 indicates strong bullish sentiment and immediate exit from the No-Trade Zone.
1. If price opens above 59,857 and retests the zone
• Avoid chasing the opening candle.
• Wait for a retest of 59,857 (Opening Resistance).
• If retest holds with bullish CHoCH or wick rejection → Long setups activate.
• Targets: 60,000 → 60,252 (major resistance).
• Partial booking near 60,252 advisable.
2. If price opens directly near 60,252 (Last Intraday Resistance)
• High chance of profit booking.
• Avoid fresh longs inside this zone.
• Look for bearish wick rejection → Possible short opportunity back toward 59,950 → 59,857.
3. If 60,252 breaks convincingly
• This becomes a trending session.
• Upside continuation potential beyond 60,300–60,350.
• Trail SL aggressively as volatility increases.
📌 Educational Note:
Gap-ups must be traded using retests, not emotion. Institutions test whether the breakout is genuine before pushing further.
⚖ 2. FLAT OPENING (around 59,700 ± 60 pts)
A flat open inside or near the No-Trade Zone requires patience and clarity.
1. If price stays inside 59,649–59,857 (No Trade Zone)
• Avoid trading the centre of the zone.
• Wait for breakout with retest for clean, high-probability setups.
2. Break above 59,857
• Bullish momentum begins above this level.
• After breakout + retest → Long toward 60,000 → 60,252.
3. Break below 59,649
• Indicates early seller control.
• Short setups valid after retest of 59,649 from below.
• Downside targets: 59,519 → 59,360.
📌 Educational Note:
Flat opens allow the market to reveal intentions through structure. Trading only after breakout + retest avoids chop.
📉 3. GAP-DOWN OPENING (200+ points)
A gap-down near 59,500–59,550 brings price directly into strong liquidity zones.
1. If price opens near 59,519 (Gap-Down Support)
• Do NOT short blindly — buyers often react strongly here.
• Look for bullish reversal signs (hammer, engulfing, CHoCH).
• If reversal confirmed → Long toward 59,649 → 59,735.
2. If price opens near or falls into 59,360 (Last Intraday Support)
• This is a high-probability reversal zone.
• If price forms higher-low → Long back toward 59,519 → 59,649.
• If level breaks → Sellers gain control → Next target 59,114.
3. If price opens at or below 59,114 (Deep Support)
• Avoid catching falling knives.
• Wait for a strong V-shape recovery or retest before entering long.
• If price fails retest → Short continuation possible toward 58,950–58,900.
📌 Educational Note:
Gap-downs often sweep liquidity before reversing sharply. Identify reaction, not direction, before taking trades.
🛡 RISK MANAGEMENT TIPS FOR OPTIONS TRADERS
1. Avoid trading the first 5 minutes after a gap opening.
Premium volatility can trap you instantly.
2. Don’t buy far OTM options after big gaps.
Theta + IV crush = fast loss.
3. Always use price-action-based stop losses.
Premium-based SL triggers unpredictably.
4. Risk only 1–2% of your capital per trade.
5. In high IV → Prefer option selling strategies.
In low IV → Option buying becomes efficient.
6. Book profits near structural levels:
59,649 / 59,857 / 60,252.
7. Avoid averaging losers or revenge trading.
Protect capital first.
📌 SUMMARY & CONCLUSION
• Bullish bias above 59,857, with targets toward 60,000 → 60,252.
• No-Trade Zone: 59,649–59,857 → Avoid trading inside.
• Reversal zones on downside:
– 59,519
– 59,360
– 59,114
• Always wait for breakout + retest confirmation before entering.
• Respect risk management, avoid emotional decisions, and trade level-to-level.
⚠ DISCLAIMER
I am not a SEBI-registered analyst.
This analysis is purely for educational purposes and must not be considered investment advice.
Markets may behave unpredictably — use proper judgment and risk protection.
Bankniftyprediction
BANKNIFTY : Trading levels and Plan for 04-Dec-2025📊 BANKNIFTY TRADING PLAN — 04 DEC 2025
Price closed around 59,333, sitting just below the Opening Support/Resistance Zone (59,378–59,517).
Market sentiment is still recovering from the recent selloff, but upside resistance remains heavy near 59,745–59,857.
Tomorrow’s opening will heavily determine whether BankNifty expands upward toward the resistance box or rotates back to the Last Intraday Support (58,792–58,862).
🚀 1. GAP-UP OPENING (200+ points)
Opening likely near/above 59,517 or even inside the resistance zone.
1. If Gap-Up opens above 59,517 → Wait for a Retest
• Avoid chasing the early spike.
• Look for price to retest 59,378–59,517 zone.
• If the retest holds with bullish structure (higher-low, bullish engulfing, CHoCH) → Long entry toward 59,745 → 59,857.
• This is the safest long trade of the day.
2. If Gap-Up opens directly inside the Resistance Zone (59,745–59,857)
• Expect heavy profit booking and intraday selling.
• Avoid long trades in this zone.
• Look for rejection candles, wicks, or bearish CHoCH.
• A short trade is valid only if price falls back below 59,517, confirming rejection.
3. Breakout Above 59,857
• Only trade if a strong candle closes above this level.
• This signals bullish continuation with targets 60,000+ (psychological level).
• Partial booking is advised in such breakouts.
📌 Educational Note:
Gap-ups often trap retail buyers. Market makers usually push price back to retest liquidity zones. Retest entries reduce risk and increase probability.
⚖ 2. FLAT OPENING (Near 59,300 ± 60 points)
This is the cleanest scenario for technical traders.
1. If price breaks above 59,378 and sustains
• Buyers show early strength.
• Long opportunity toward 59,517 → 59,745.
• This is a standard momentum continuation setup.
2. If price rejects 59,517
• Look for bearish candles or deviation.
• First downside target: 59,203 (Opening Support).
• Below 59,203 → Price may trend toward 58,862.
3. If price remains stuck between 59,203–59,517
• Expect a range-bound day.
• Trade only zone extremes:
– Buy near 59,203 (only with confirmation)
– Sell near 59,517 (only with confirmation)
📌 Educational Note:
Flat openings produce normal volatility and allow the market to reveal directional intentions more naturally.
📉 3. GAP-DOWN OPENING (200+ points)
Price likely opens near 59,100 or inside the Last Intraday Support (58,792–58,862).
1. If Gap-Down opens inside 58,792–58,862 (Support Block)
• Never short this zone blindly.
• This area previously held strong buyer interest.
• Look for reversal signs (hammer, bullish engulfing, CHoCH).
• If reversal seen → Long toward 59,203 → 59,378.
2. If Support Breaks Below 58,792
• Do NOT chase.
• Wait for price to retest the broken zone → If rejection appears → Short entry.
• Downside targets: 58,700 → 58,600.
3. Sharp Reversal From Gap-Down (V-Shape)
• If price recovers instantly above 58,862, buyers are absorbing aggressively.
• Above 59,203 → Further upside toward 59,378–59,517.
📌 Educational Note:
Gap-downs sweep liquidity; many times they reverse sharply as smart money collects orders. Always wait for confirmation.
🛡 RISK MANAGEMENT TIPS FOR OPTIONS TRADERS
1. Avoid trading the first 5 minutes on a big gap day.
Volatility crush and fake moves are common.
2. Never buy OTM options after a big gap.
Premiums deflate sharply once IV settles.
3. Always use price-based stop losses, not premium-based SL.
4. Position size rule:
Risk max 1–2% per trade.
5. If IV is high → Prefer selling strategies (Credit spreads, Straddles protection).
If IV is low → Option buying becomes more efficient.
6. Take partial profits at logical zones (like 59,378, 59,517, 59,745).
7. Avoid revenge trading or counter-trend trades without structure confirmation.
📌 SUMMARY & CONCLUSION
• Bullish bias above 59,517, with targets toward 59,745–59,857.
• Range expected if price stays between 59,203–59,517.
• High-probability reversals expected from 58,792–58,862 on gap-down.
• Focus on retests, confirmations, and clean structure before entering.
• Avoid emotional or chase-based trades—stick to the levels only.
⚠ DISCLAIMER
I am not a SEBI-registered analyst.
This plan is purely for educational purposes and should not be considered investment advice.
Market conditions can change rapidly—always trade with proper risk management and your own judgment.

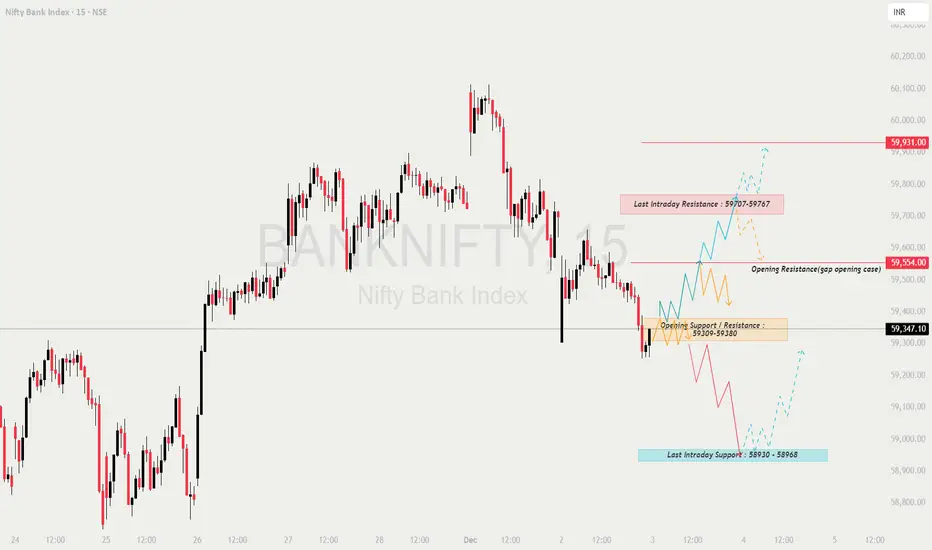
BANKNIFTY : Trading levels and Plan for 03-Dec-3035📊 BANKNIFTY TRADING PLAN — 03 DEC 2025
BankNifty closed near 59,347, sitting inside the Opening Support / Resistance Flip Zone (59,309–59,380).
The index is currently attempting to stabilise after a sharp down-move, with both 59,554 and 58,930 acting as the most important decision zones for 03-Dec.
Market direction will depend on how price reacts around these zones at the open.
🔍 KEY LEVELS TO WATCH
🟥 Opening Resistance (Gap-Up Case): 59,554
🟥 Last Intraday Resistance: 59,707 – 59,767
🟥 Major Upside Target: 59,931
🟩 Opening Support / Resistance Flip Zone: 59,309 – 59,380
🟩 Last Intraday Support: 58,930 – 58,968
🟩 Major Breakdown Target: 58,780 – 58,720
🟢 SCENARIO 1 — GAP-UP OPENING (200+ POINTS)
If BankNifty opens around 59,500–59,600, it directly enters the Opening Resistance zone.
If price sustains above 59,554, buyers will push toward:
➡️ 59,707 → 59,767 → 59,931
Best long entry:
✔️ Breakout above 59,554
✔️ Retest candle with long lower wick
✔️ Entry on strength → Targets above
If price rejects 59,554–59,707 on the first 5–10 min (upper wicks, exhaustion):
Expect pullback to:
➡️ 59,420 → 59,309 zone
Only aggressive traders should attempt fade-shorts near 59,707–59,767.
High risk due to strength in the zone.
📘 Educational Note:
Gap-ups into resistance require confirmation of strength.
Don’t assume continuation — let structure break first.
🟧 SCENARIO 2 — FLAT OPENING (59,250–59,350)
Flat opening puts price directly inside the flip zone (59,309–59,380) — high indecision.
Range-bound movement expected in first 10–15 minutes.
Upside trigger:
✔️ Break above 59,380
Targets → 59,480 → 59,554 → 59,707
Downside trigger:
✔️ Break below 59,309
Targets → 59,200 → 59,120 → 58,968
Avoid trades inside 59,309–59,380 until a clean directional breakout occurs.
Safer setups:
— Retest of 59,380 for long
— Retest of 59,309 break for short
💡 Educational Tip:
Flat opens give the most reliable patterns after the first 3 candles.
Let noise settle, trade clean structure.
🔻 SCENARIO 3 — GAP-DOWN OPENING (200+ POINTS)
A gap-down near 59,000–59,100 brings price close to the Last Intraday Support (58,930–58,968).
If 58,930–58,968 holds, expect a strong reversal toward:
➡️ 59,120 → 59,309 → 59,380
If price breaks 58,930 with momentum, downside opens to:
➡️ 58,820 → 58,780 → 58,720
Only take reversal longs if:
✔️ Support holds for 2–3 candles
✔️ Higher lows form
✔️ Strong bullish rejection wick appears
Breakdown traders should wait for retest of 58,930 after breakdown.
This gives low-risk continuation entries.
📘 Educational Note:
Gap-downs into major support can create high-quality reversal trades, but only after confirmation.
Never pre-empt reversals.
💼 RISK MANAGEMENT TIPS FOR OPTION TRADERS 🔐📘
Avoid trading the first 5 minutes — high trap probability.
Use ITM options for directional trades for better decay protection.
Keep SL based on chart levels, not option premium noise.
Avoid averaging losing positions — re-entry is cheaper than recovery.
Book partial profits at first target and trail stop loss.
During volatile zones, prefer spreads instead of naked options.
Stop trading after 2 consecutive losses — protect capital.
⚠️ Golden Rule:
Strong levels give clean trades.
Avoid trading in the noise zones.
📌 SUMMARY
Bullish Above:
✔️ 59,380 → 59,480 → 59,554 → 59,707 → 59,931
Bearish Below:
✔️ 59,309 → 59,200 → 59,120 → 58,968 → 58,780
Key Zones:
🟩 Strong Support: 58,930–58,968
🟧 Flip Zone (No-Trade until breakout): 59,309–59,380
🟥 Strong Resistance: 59,554–59,707
Major Trend Decider:
🔑 Sustaining above 59,554 → Trend bullish
🔑 Breaking below 58,930 → Trend bearish
🧾 CONCLUSION
BankNifty is positioned at a critical flip zone.
The day’s trend will depend on whether:
✔️ Buyers reclaim 59,380–59,554, or
✔️ Sellers break 59,309 → 58,930
Follow structure, avoid prediction, and trade only after confirmation.
⚠️ DISCLAIMER
I am not a SEBI-registered analyst.
This analysis is for educational purposes only.
Please consult a certified financial advisor before taking trades.
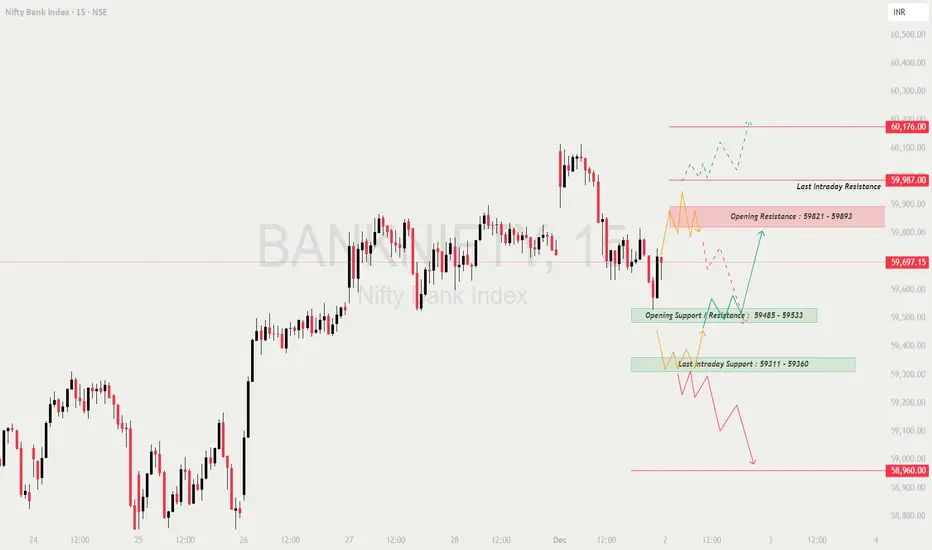
BANKNIFTY : Trading levels and Plan for 02-Dec-2025📊 BANKNIFTY TRADING PLAN — 02 DEC 2025
BankNifty closed around 59,697, sitting right between the Opening Resistance Zone (59,821–59,893) and the Opening Support / Resistance zone (59,485).
This creates a very sensitive region where the market may first trap traders before showing real direction.
The chart shows clear supply above and strong demand zones below, so the opening behavior will dictate whether the day becomes trend-continuation or a reversal session.
🔍 Key Intraday Zones
🟥 Opening Resistance Zone: 59,821 – 59,893
🟥 Last Intraday Resistance: 59,987
🟥 Major Resistance: 60,176
🟩 Opening Support / Resistance Zone: 59,485
🟩 Last Intraday Support Zone: 59,311 – 59,360
🟩 Major Breakdown Level: 58,960
🟢 SCENARIO 1 — GAP-UP OPENING (200+ Points)
If BankNifty opens around 59,900–60,050, price directly enters or opens above the resistance cluster.
If price sustains above 59,893 for 10–15 minutes with strong volume →
⭐ Upside targets → 59,987 → 60,100 → 60,176
This is a classical continuation breakout structure.
If price rejects 59,893–59,987, expect a pullback toward:
➡️ 59,700 → 59,485
Best Long Setup →
Breakout above 59,987 + Retest + Bullish candle.
Avoid aggressive shorts immediately at open during a gap-up —
early supply tests often cause fake breakdowns.
📘 Educational Note:
Gap-ups into resistance are tricky.
Always wait for sustained acceptance above resistance rather than jumping in on the first candle.
🟧 SCENARIO 2 — FLAT OPENING (Near 59,650–59,720)
A flat open places the market between support and resistance → expect indecision.
If price breaks above 59,821, upside targets →
59,893 → 59,987
If price breaks below 59,485, downside opens up toward:
➡️ 59,360 → 59,311
Avoid trading inside 59,650–59,750 until structure becomes clear.
This is a noise zone.
Two high-probability setups:
✔️ Breakout–retest above 59,821
✔️ Breakdown–retest below 59,485
💡 Educational Tip:
Flat openings are where the first 3–4 candles reveal the full day’s trend.
Let the market show its intention before taking the first trade.
🔻 SCENARIO 3 — GAP-DOWN OPENING (200+ Points)
A gap-down near 59,350–59,420 pulls price into the Last Intraday Support Zone (59,311–59,360).
If price holds 59,311–59,360 with long lower wicks →
Upside bounce targets →
59,485 → 59,650 → 59,821
If support breaks →
Next downside → 59,150 → 59,020 → 58,960
A sharp bounce from 58,960 is possible —
this is a major liquidity zone where buyers historically step in.
Aggressive selling only below 58,960 with confirmation.
Targets → 58,820 → 58,700
📘 Educational Note:
Gap-downs into strong demand often give the best reversal trades of the day —
but only after a higher low forms. Avoid revenge trades.
💼 RISK MANAGEMENT TIPS FOR OPTION TRADERS 💡
Avoid trading the first 5 minutes after market opens.
For directional moves, choose ATM or ITM options.
Stop-loss must always be tied to chart structure — not premium price.
Do NOT average losing positions. Cut fast.
Trail your SL once first target hits — protect your gains.
Low VIX → Option buying becomes favorable.
High VIX → Prefer hedged spreads for safety.
⚠️ Golden Rule:
Capital protection is the real edge.
Consistency beats jackpot trades.
📌 SUMMARY
Bullish Above:
59,821 → 59,893 → 59,987 → 60,176
Bearish Below:
59,485 → 59,360 → 59,311 → 58,960
Strong Reversal Zones:
🟩 59,311–59,360
🟩 58,960 (Major Demand Zone)
🟥 59,893–59,987 (Heavy Supply Zone)
No-Trade Zones:
⚠️ Inside 59,650–59,750
⚠️ Direct middle-of-structure price at open
🧾 CONCLUSION
The market will primarily react to the 59,821 resistance and the 59,485 support.
These two levels will decide whether the trend continues upward or transitions to a corrective phase.
✔️ Breakout above 59,821 = Long opportunity
✔️ Breakdown below 59,485 = Short continuation
✔️ Reversal trades possible only at 59,311 or 58,960
Trade only after confirmation — avoid impulsive entries.
⚠️ DISCLAIMER
I am not a SEBI-registered analyst.
This analysis is for educational purposes only.
Consult your financial advisor before making any trading decisions.
BANKNIFTY : Trading levels and Plan for 01-Dec-2025📊 BANKNIFTY TRADING PLAN — 01 DEC 2025
BankNifty closed near 59,722, sitting just below a key Opening Resistance (59,945) and above a crucial Opening & Last Intraday Support area (59,582–59,610).
Price is compressing between a strong seller zone above and a strong buyer zone below — making the opening structure very important.
🔍 Key Intraday Levels
🟥 Opening Resistance: 59,945
🟥 Last Intraday Resistance: 60,176
🟩 Opening & Last Intraday Support Zone: 59,582 – 59,610
🟩 Last Intraday Support Zone: 59,452 – 59,500
🟢 SCENARIO 1 — GAP-UP OPENING (200+ Points)
If the market opens around 59,900–60,050, it moves directly into resistance zones.
A sustained breakout above 59,945 for 10–15 mins →
⭐ Targets → 60,060 → 60,120 → 60,176
If price rejects from 59,945, expect pullback toward 59,800 → 59,720.
Avoid aggressive buying near 60,000 — sellers usually defend this psychological mark.
Best long trade →
Breakout above 59,945 → Retest → Strong green candle → Entry.
📘 Educational Note:
Gap-ups near resistance often trap breakout buyers. Wait for confirmation through retest or strong candle formations.
🟧 SCENARIO 2 — FLAT OPENING (Near 59,690–59,750)
A flat open places price between resistance and support — expect early indecision.
Breakout above 59,800–59,820 →
Upside levels → 59,945 → 60,060 → 60,176
If price fails to cross 59,800 and reverses →
Expect a slide towards 59,610 (support).
Breakdown below 59,610 →
Targets → 59,500 → 59,452
Avoid trading in the chop zone between 59,690–59,780 unless market shows clear structure.
💡 Educational Tip:
Flat openings offer the best trend identification. First 15-min candle tells the true direction — don’t pre-commit to a bias.
🔻 SCENARIO 3 — GAP-DOWN OPENING (200+ Points)
A gap-down around 59,480–59,550 drops price directly into support.
If 59,452–59,500 holds with strong wick rejection →
Upside bounce targets → 59,582 → 59,720 → 59,820
If support breaks decisively →
Next downside → 59,360 → 59,280
A strong bounce from 59,452 is ideal for low-risk long setups — only with confirmation.
Avoid immediate option buying if volatility spikes after gap-down — wait for price stability.
📘 Educational Note:
Gap-down into support zones gives some of the strongest reversal trades — but only once a clear higher low is formed.
💼 RISK MANAGEMENT TIPS FOR OPTION TRADERS 💡
Avoid trading first 5 minutes — especially on gap-ups/gap-downs.
Use ATM or ITM options for directional trades; avoid deep OTM decay.
Always define SL based on chart levels, not on premium.
Don’t average losing trades — structure invalidation = exit.
Partial profit booking helps secure gains in fast markets.
When VIX is low → Prefer buying.
When VIX is high → Prefer hedged selling strategies.
⚠️ Golden Rule:
Protect your capital first — the best setups come only 2–3 times a day.
📌 SUMMARY
Bullish above → 59,945
Targets → 60,060 → 60,120 → 60,176
Bearish below → 59,610
Targets → 59,500 → 59,452 → 59,360
Strong Reversal Zones:
🟩 59,452–59,500 — Deep buyer zone
🟥 59,945–60,176 — Seller zone
Avoid trading inside:
⚠️ 59,690–59,780 (Flat opening chop zone)
🧾 CONCLUSION
BankNifty’s trend for 01-Dec will depend on whether price:
✔️ Breaks out above 59,945
✔️ Rejects from 60,000
✔️ Holds support at 59,582–59,610
✔️ Breaks below 59,452 for deeper downside
Wait for structure confirmation and avoid trades inside choppy regions. Follow price, not predictions.
⚠️ DISCLAIMER
I am not a SEBI-registered analyst.
This analysis is strictly for educational purposes.
Please consult a certified financial advisor before taking any trading decisions.

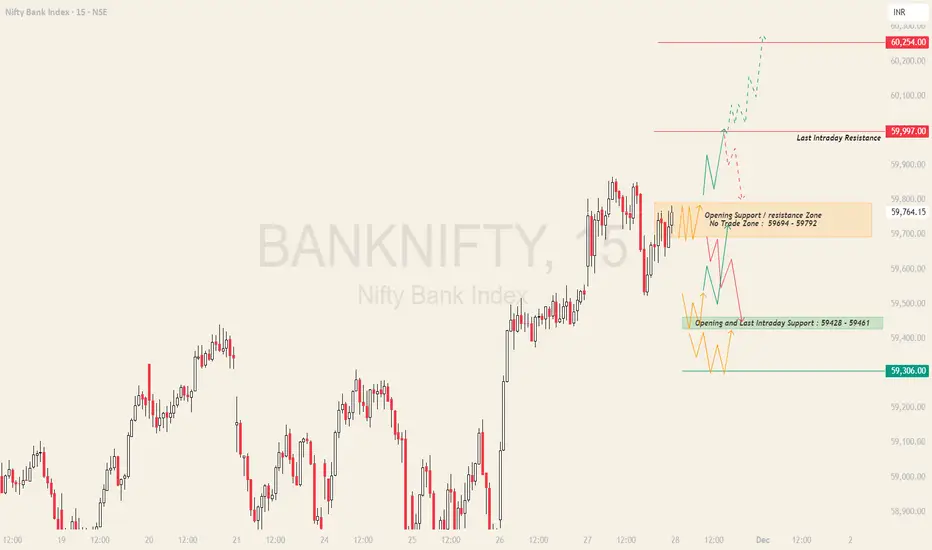
BANKNIFTY : Trading levels and Plan for 28-Nov-2025📊 BANKNIFTY TRADING PLAN — 28 NOV 2025
BankNifty closed near 59,764, sitting just below a very important Opening Support / Resistance Zone (59,694 – 59,792), which is also marked as a No-Trade Zone due to expected volatility.
Price is currently between a major overhead resistance (59,997) and a strong downside support zone (59,428 – 59,461).
This makes the opening candle extremely important.
🔍 Key Intraday Levels
🟧 Opening Support / Resistance Zone (No Trade Zone): 59,694 – 59,792
🟥 Last Intraday Resistance: 59,997
🟥 Profit Booking Zone: 60,254
🟩 Opening & Last Intraday Support: 59,428 – 59,461
🟩 Major Downside Support: 59,306
🟢 SCENARIO 1 — GAP-UP OPENING (200+ Points)
If BankNifty opens around 59,900–60,000, price enters directly into strong resistance.
A sustained breakout above 59,997 for 10–15 minutes →
⭐ Upside continuation targets → 60,120 → 60,180 → 60,254
(Profit booking zone — avoid fresh longs here)
If price rejects from 59,997 with long upper wicks →
Expect a pullback towards → 59,792 → 59,694
Avoid immediate buying — gap-up at resistance often causes sharp reversals.
Best long trade setup →
Breakout above 59,997 → Retest → Strong bullish candle → Long.
📘 Educational Note:
Gap-ups into resistance must be treated with caution. Volume confirmation is essential before taking continuation trades.
🟧 SCENARIO 2 — FLAT OPENING (Near 59,700–59,780)
A flat open places price inside the No-Trade Zone (59,694–59,792) — a choppy area.
Avoid taking positions inside this zone — unreliable signals and fake breakouts are common.
Breakout above 59,792 →
Upside targets → 59,900 → 59,997
Breakdown below 59,694 →
Downside targets → 59,550 → 59,461
Best trades occur OUTSIDE the zone:
✔️ Breakout above 59,792
✔️ Breakdown below 59,694
✔️ Support bounce from 59,428–59,461 (strong reversal zone)
💡 Educational Tip:
Flat openings are perfect for identifying trend. Let the first 15-min candle decide the direction — patience pays.
🔻 SCENARIO 3 — GAP-DOWN OPENING (200+ Points)
A gap-down opening around 59,450–59,500 brings price directly into the Opening Support Zone (59,428–59,461).
If support at 59,428–59,461 holds with bullish wick rejection →
Reversal targets → 59,550 → 59,694 → 59,792
If price breaks below 59,428, expect fast downside:
➡️ 59,360 → 59,306
A sharp bounce from 59,306 can offer a low-risk long opportunity.
If all supports fail with momentum →
Extends toward → 59,200 → 59,140
📘 Educational Note:
Gap-down openings into strong support zones often give powerful reversal trades — but only after confirmation of higher lows or bullish structure.
💼 RISK MANAGEMENT TIPS FOR OPTION TRADERS 💡
Avoid trading in the first 5 minutes — especially on gap openings.
Prefer ATM or ITM options for directional trades.
Never average a losing trade — theta decay punishes weak decisions.
Use structure-based SLs, not random premium SLs.
Book partial profits near key zones like 59,997 & 60,254.
When VIX is low → Option buying works better.
When VIX is high → Use hedged selling strategies.
⚠️ Golden Rule:
Your first job is to protect capital. The second job is to catch trends. No capital = no trading.
📌 SUMMARY
Bullish Above → 59,792
Targets → 59,900 → 59,997 → 60,120 → 60,254
Bearish Below → 59,694
Targets → 59,550 → 59,461 → 59,428 → 59,306
Strong Reversal Zones:
🟩 59,428–59,461 (Buyers’ defense zone)
🟥 59,997–60,254 (Profit booking & seller zone)
Highest-Risk Zone:
🟧 59,694–59,792 (No-Trade Zone) — avoid entries here.
🧾 CONCLUSION
BankNifty is positioned between important support and resistance clusters.
The market direction for 28-Nov will strongly depend on whether price:
✔️ Breaks out above 59,792
✔️ Rejects from 59,997
✔️ Reverses from 59,428
✔️ Breaks below 59,428 for deeper downside
Trade clean levels, avoid the No-Trade Zone, and let the structure guide your entries — not emotions.
⚠️ DISCLAIMER
I am not a SEBI-registered analyst.
This analysis is for educational purposes only.
Please consult a certified financial advisor before trading or investing.
BANKNIFTY : Trading levels and Plan for 27-Nov-2025📊 BANKNIFTY TRADING PLAN — 27 NOV 2025
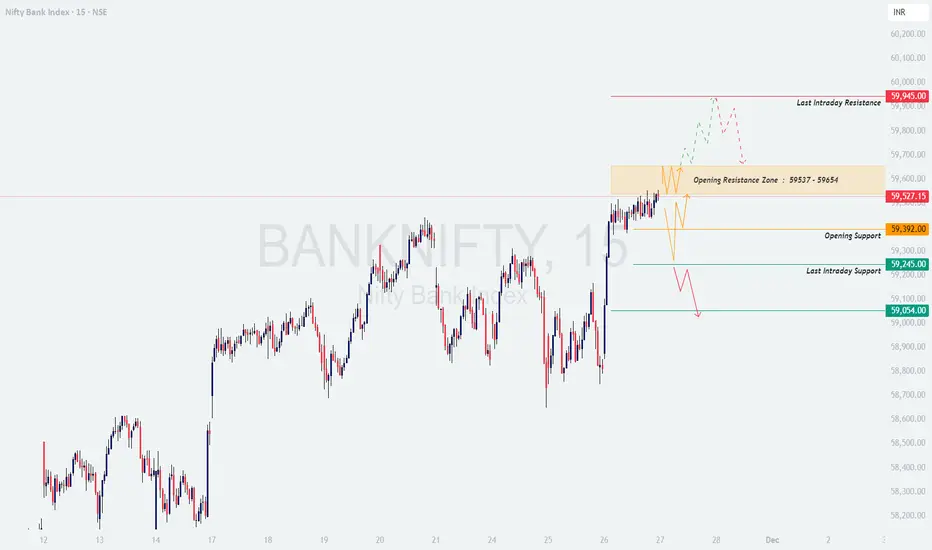
BankNifty closed around 59,527, sitting right under the Opening Resistance Zone (59,537–59,654) and above immediate supports 59,392 and 59,245.
The structure is bullish, but price is entering a supply region, which makes the opening reaction extremely important.
Important Levels to Track:
🟧 Opening Resistance Zone: 59,537 – 59,654
🟥 Last Intraday Resistance: 59,945
🟩 Opening Support: 59,392
🟩 Last Intraday Support: 59,245
🟩 Major Downside Level: 59,054
🟢 SCENARIO 1 — GAP-UP OPENING (200+ Points)
If BankNifty opens around 59,700–59,800, it opens directly into the resistance zone.
If price sustains ABOVE 59,654 for 10–15 minutes →
⭐ Upside targets → 59,780 → 59,860 → 59,945
If price fails to hold above 59,654 and shows rejection wicks →
Expect a correction → 59,600 → 59,537 → 59,392
Avoid chasing long immediately on gap-up — this resistance zone is used frequently for profit booking.
Best long entry = Breakout → Retest → Re-entry above 59,654.
📘 Educational Note:
Gap-ups near previous supply zones often trap retail buyers. Look for follow-through candles and rising volume before initiating long trades.
🟧 SCENARIO 2 — FLAT OPENING (Near 59,450–59,550)
A flat open keeps BankNifty inside the Opening Resistance Zone (59,537–59,654) — a tricky zone.
If BankNifty breaks above 59,654 with strength →
Upside → 59,720 → 59,780 → 59,945
If price stays inside 59,450–59,550 →
This becomes a no-trade zone; wait for breakout or breakdown.
Breakdown below 59,392 →
Targets → 59,300 → 59,245 (Major support)
Support retest at 59,392 with bullish wick can give a safe intraday long.
💡 Educational Tip:
Flat openings are the most reliable for identifying trend.
Let the first 15-min candle close — this candle usually sets direction.
🔻 SCENARIO 3 — GAP-DOWN OPENING (200+ Points)
A gap-down below 59,200 pushes price into Last Intraday Support (59,245).
If 59,245 holds strongly with long lower wicks →
Upside targets → 59,350 → 59,392 → 59,537
If price breaks 59,245 with momentum →
Next support → 59,120 → 59,054
A high-quality reversal trade may form near 59,054, but ONLY after confirmation.
If BankNifty stays BELOW 59,245, expect a trending bearish session.
📘 Educational Note:
Gap-downs into strong supports can create large reversal moves — but only after absorption candles + higher lows.
💼 RISK MANAGEMENT TIPS FOR OPTION TRADERS 💡
Avoid entering trades in the first 5–10 minutes, especially on gap openings.
Prefer ITM or ATM options for directional trades to reduce premium decay.
Use structure-based stop loss; DO NOT widen SL emotionally.
Avoid averaging losers — protect capital at all costs.
When VIX is low → option buying works better.
When VIX is high → prefer spreads or hedged selling.
Always book partial profits at major levels.
⚠️ Golden Rule:
Your survival matters more than catching every move. Capital protection = long-term profitability.
📌 SUMMARY
Bullish above → 59,654
Targets → 59,720 → 59,780 → 59,945
Bearish below → 59,392
Targets → 59,300 → 59,245 → 59,120 → 59,054
Avoid Trading Zones:
— 59,450–59,550 (Flat choppy zone)
— 59,537–59,654 (Supply zone until breakout)
🧾 CONCLUSION
BankNifty sits just under a crucial resistance band.
The cleanest and safest trades will come from:
✔️ Breakout + Retest above 59,654
✔️ Reversal setups near 59,245
✔️ Continuation short below 59,392
Avoid trading inside noisy zones — wait for strong structure.
⚠️ DISCLAIMER
I am NOT a SEBI-registered analyst.
This write-up is for educational purposes only.
Please consult a certified financial advisor before trading.
BANKNIFTY : Trading levels and Plan for 26-Nov-2025📊 BANKNIFTY TRADING PLAN — 26 NOV 2025
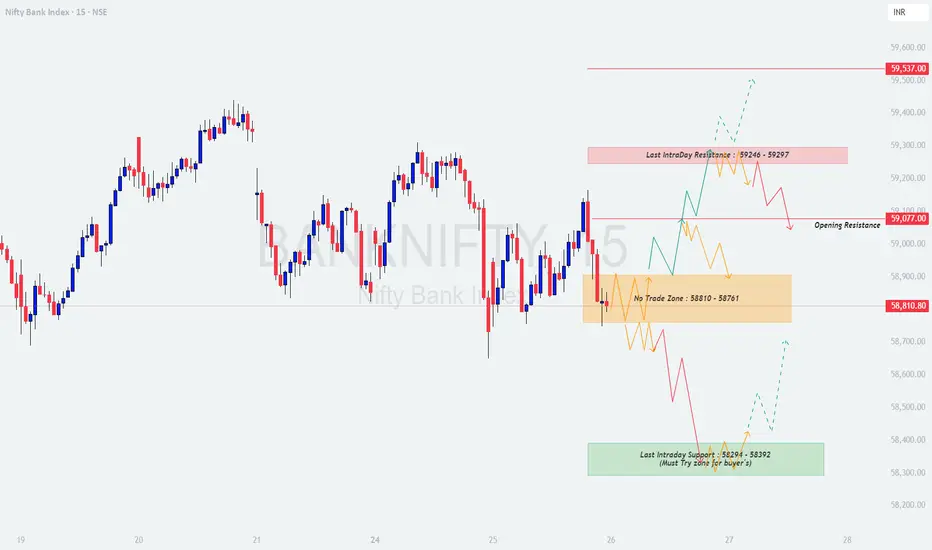
Current price around 58,810, sitting inside the No-Trade Zone (58,810–58,761) — a tricky zone where price typically whipsaws. Market direction will heavily depend on how price reacts to the Opening Resistance at 59,077 and the Buyer’s Must-Defend Zone at 58,294–58,392.
Key actionable levels:
🟥 Last Intraday Resistance: 59,246–59,297
🟥 Major Resistance: 59,537
🟧 Opening Resistance: 59,077
🟨 No-Trade Zone: 58,810–58,761
🟩 Last Intraday Support (Buyer’s Must-Try Zone): 58,294–58,392
🟢 SCENARIO 1 — GAP-UP OPENING (200+ Points)
Gap-up expected above 59,000–59,150, placing price near or inside the resistance cluster.
If price sustains above 59,246 with volume for 10–15 mins →
⭐ Targets: 59,297 → 59,390 → 59,537
If price rejects 59,246–59,297, expect pullback toward:
➡️ 59,150 → 59,077 (Opening Resistance)
A retest + bullish candle at 59,077 can give a safe continuation long.
Avoid aggressive buying at open — gap-ups near resistance often produce fake breakouts.
📘 Educational Note:
Gap-ups work best only when the first retracement forms a higher low, confirming buyer strength. A tall red candle at resistance = early exhaustion.
🟧 SCENARIO 2 — FLAT OPENING (Around 58,760–58,820)
Flat opening happens exactly at the No-Trade Zone (58,761–58,810) — avoid trading initially.
If price breaks above 58,810 and sustains →
Targets → 58,950 → 59,077 → 59,246
If price breaks below 58,761, downside opens to:
➡️ 58,482 → 58,294 (Major support)
The safest trades will be:
— Breakout → Retest → Move
— Deep support bounce from 58,294–58,392
(“Buyer’s must-try zone”)
Avoid trading inside the yellow zone — volatility + no direction = traps.
💡 Educational Tip:
Flat opens reveal structure within the first 15-min candle. A strong body candle usually sets the day’s tone.
🔻 SCENARIO 3 — GAP-DOWN OPENING (200+ Points)
A gap-down below 58,600–58,500 pushes price into the supportive demand area.
If price holds 58,482–58,392, expect reversal targets toward:
🔼 58,650 → 58,761 → 58,900
If price breaks below 58,390 with strong momentum →
Next supports →
➡️ 58,150 → 58,000 → 57,850
A bullish rejection wick at 58,392 is the strongest long setup of the day.
Avoid shorting after a steep gap-down unless breakdown is confirmed — morning panic often reverses sharply.
📘 Educational Note:
Gap-downs into demand zones often create V-shaped reversals — but only if buyers defend the level with strong wicks.
💼 RISK MANAGEMENT TIPS FOR OPTION TRADERS 💡
Avoid trading in the first 5–10 minutes — volatility is highest.
Use ITM or ATM options for directional trades to avoid premium decay.
Keep SL strict — never widen it emotionally.
Do NOT average losing trades.
Trail SL once in profits.
If VIX is low → prefer option buying.
If VIX is high → hedge positions or use spreads.
Book partial profits at key levels — don’t wait for the full target.
⚠️ Golden Rule:
Protect capital first. Opportunities come daily — capital doesn’t.
📌 SUMMARY
Bullish Above → 59,077
Targets: 59,150 → 59,246 → 59,297 → 59,537
Bearish Below → 58,761
Targets: 58,482 → 58,392 → 58,150 → 58,000
Strong Support Zone for Reversal:** 58,294–58,392**
No-Trade Zone:** 58,761–58,810**
🧾 CONCLUSION
BankNifty sits at a key indecision zone. The day’s trend will be determined by the battle between:
🔥 Sellers defending 59,246–59,297
vs
🛡️ Buyers defending 58,294–58,392
The safest and cleanest trades will be:
✔️ Breakout + retest above 59,077
✔️ Reversal from 58,294–58,392
✔️ Breakdown & retest below 58,761
Trade only when direction is clear — avoid the traps inside the no-trade zone.
⚠️ DISCLAIMER
I am not a SEBI-registered analyst. This analysis is for educational purposes only. Please consult your financial advisor before making trading decisions.
BANKNIFTY : Trading levels and Plan for 25-Nov-2025📊 BANKNIFTY TRADING PLAN — 25 NOV 2025
(Reference: 15-min structure & intraday zones)
BankNifty closed around 58,731, sitting right inside the No-Trade Zone (58,661–58,838) where volatility, fake breakouts, and whipsaws are highly likely.
As per the chart structure:
🟥 Opening Resistance (Gap-up case): 59,043
🟥 Last Intraday Resistance: 59,266
🟥 Major Resistance: 59,607
🟩 Opening Support (Gap-down case): 58,482
🟩 Last Intraday Support: 58,294
🟩 Major Support: 57,647
Below is the complete actionable plan for all opening scenarios 👇
🟢 SCENARIO 1 — GAP-UP OPENING (200+ points)
If BankNifty opens around 58,950–59,150, it directly tests the Opening Resistance (59,043) and approaches the Last Intraday Resistance (59,266).
If price sustains above 59,266 for 10–20 mins with strong bullish candles →
🎯 Upside targets → 59,350 → 59,470 → 59,607
If price rejects 59,043–59,266, expect a pullback toward:
➡️ 58,900 → 58,838
A bullish retest at 58,838 (top of No-Trade Zone) can give a safe long entry.
Avoid chasing a gap-up candle — gap-ups at resistance zones often trigger early reversals.
📘 Educational Insight:
Gap-ups near previous-day resistance usually generate liquidity hunts. Wait for structure to form — breakout + retest is far safer than impulse entries.
🟧 SCENARIO 2 — FLAT OPENING (Near 58,660–58,820)
A flat open places price inside the No-Trade Zone (58,661–58,838) — a region made for fake moves.
If price gives a clean breakout above 58,838, then retests →
Targets → 58,950 → 59,043 → 59,266
If price breaks 58,661 convincingly →
Bearish targets → 58,482 → 58,294
Best trades will be only outside the No-Trade Zone:
— Buy above 58,838
— Sell below 58,661
Avoid trading inside 58,661–58,838. Momentum is usually weak and full of noise.
💡 Educational Tip:
Flat openings are where patience pays. Let the first 15-min candle define trend bias before committing capital.
🔻 SCENARIO 3 — GAP-DOWN OPENING (200+ points)
If BankNifty opens around 58,250–58,450, price enters Opening Support (58,482) and may slide towards the Last Intraday Support (58,294).
If 58,482 holds with long wicks + volume →
Reversal targets → 58,661 → 58,838 → 58,950
If price breaks 58,294 decisively →
Next supports → 58,050 → 57,900 → 57,647
A strong bounce at 57,647 is a very high-quality long setup.
Avoid bottom-fishing immediately after gap-down — wait for confirmation candles.
📘 Educational Note:
Gap-downs into strong support generate the cleanest reversals — but only after rejection + higher low formation.
💼 RISK MANAGEMENT TIPS FOR OPTION TRADERS 💡
Avoid trading the first 5–10 minutes after the open — let volatility settle.
Use ITM or ATM options for directional trades; avoid far OTM traps.
Place SL based on structure, not on rupee value.
Never average a losing position — protect capital first.
When VIX is high → prefer hedged selling strategies (Spreads / Iron Condor).
When VIX is low → momentum buying works better.
Trail profits if market trends strongly — large moves often come on trending days.
⚠️ Golden Rule:
Trade levels, not emotions. Your job is to execute with discipline, not predict every tick.
📌 SUMMARY
Bullish above → 58,838**
Upside Targets → 58,950 → 59,043 → 59,266 → 59,470 → 59,607
Bearish below → 58,661**
Downside Targets → 58,482 → 58,294 → 58,050 → 57,900 → 57,647
No-Trade Zone:** 58,661–58,838
(wait for breakout + retest)
🧾 CONCLUSION
BankNifty is positioned at a sensitive zone where directional clarity will emerge only after a breakout from the No-Trade Zone.
The most reliable trades will come from:
✔️ Breakout & retest above 58,838
✔️ Rejection-based selling below 58,661
✔️ A reversal bounce from 57,647 in case of sharp gap-down
Trade with patience, wait for confirmation, and protect your capital.
⚠️ DISCLAIMER
I am not a SEBI-registered analyst.
This analysis is purely for educational purposes.
Please consult a registered financial advisor before trading or investing.

BANKNIFTY : Trading levels and Plan for 21-Nov-2025📊 BANKNIFTY TRADING PLAN — 21 NOV 2025
(Reference: 15-min chart structure & mapped intraday zones)
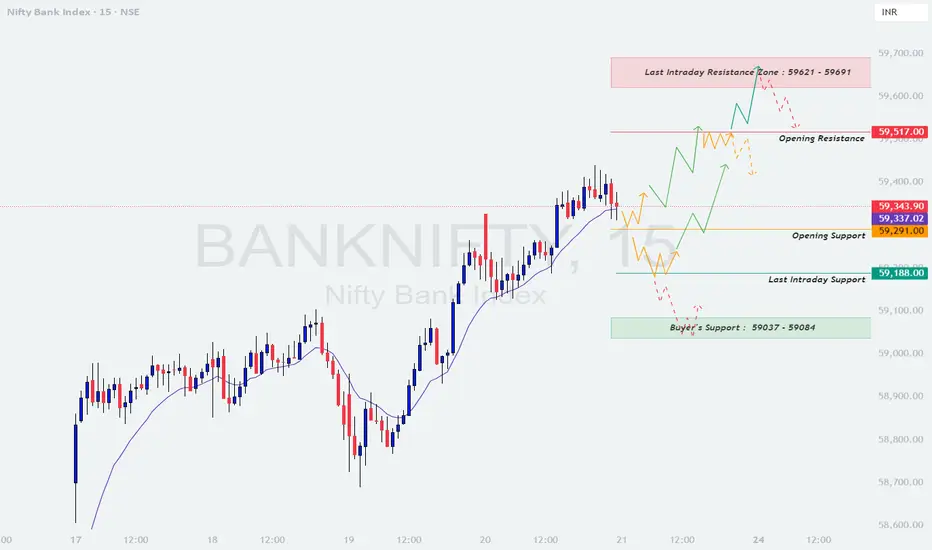
BankNifty closed around 59,343, trading just above Opening Support (59,291) and below the critical Opening Resistance (59,517).
Trend is bullish, but price is consolidating near a supply zone, making open behaviour extremely important.
Here are the major actionable levels for 21 Nov:
🟧 Opening Resistance: 59,517
🟥 Last Intraday Resistance Zone: 59,621 – 59,691
🟩 Opening Support: 59,291
🟦 Last Intraday Support: 59,188
🟩 Buyer’s Support Zone: 59,037 – 59,084 (Trend Reversal Zone)
🟢 SCENARIO 1 — GAP-UP OPENING (200+ points)
If BankNifty opens around 59,500–59,650, price opens directly at or inside resistance areas.
If price sustains above 59,517 for 10–15 minutes with strong bullish candles →
🎯 Upside targets → 59,621 → 59,691 → 59,750
If price enters the Last Intraday Resistance Zone (59,621–59,691), expect:
🔻 Profit booking / intraday reversal
💡 Book long profits here and avoid fresh buys.
Rejection from 59,620–59,690 can retrace toward:
➡️ 59,517 → 59,420 → 59,291
A bullish retest at 59,517 is a safe re-entry for continuation.
📘 Educational Note:
Gap-ups near resistance zones often fail if the first 5–15 min candle is weak. Always wait for higher-low confirmation before entering longs.
🟧 SCENARIO 2 — FLAT OPENING (Near 59,250–59,350)
A flat open places price between Opening Support (59,291) and Opening Resistance (59,517) — a decision zone.
Breakout above 59,517 →
🎯 Targets → 59,580 → 59,621 → 59,691
Breakdown below 59,291 →
🎯 Targets → 59,240 → 59,188
Avoid trading inside the 59,291–59,517 zone until a clear direction forms.
Best strategy:
✔️ Breakout → Retest → Long
✔️ Breakdown → Retest → Short
💡 Educational Tip:
Flat openings are ideal for trend discovery. The first 15-min structure gives the strongest clue—don’t anticipate, let levels break.
🔻 SCENARIO 3 — GAP-DOWN OPENING (200+ points)
If BankNifty opens below 59,150, price enters a crucial demand area.
A gap-down near 59,188 (Last Intraday Support):
If price gives bullish wick rejection →
🎯 Targets → 59,240 → 59,291 → 59,337
If 59,188 breaks decisively →
Next major demand zone → 59,037 – 59,084 (Buyer’s Support Zone)
Expect a strong reversal attempt from 59,037–59,084.
A bullish reversal candle here is a high-probability long setup.
If 59,037 breaks →
Downside expansion → 58,950 → 58,880
📘 Educational Note:
Gap-downs into strong demand zones give powerful reversals, but only after confirmation. Never buy falling candles blindly.
💼 RISK MANAGEMENT TIPS FOR OPTION TRADERS 💡
Avoid trading during the first 5–10 minutes — high volatility = high risk.
For directional trades → Use ATM or ITM options for better decay control.
Maintain a fixed SL based on structure, not on emotions.
Avoid averaging losers — trend can continue longer than expected.
Book partial profits if momentum slows near resistance or support.
In low VIX → option buying works well.
In high VIX → prefer spreads or hedged selling.
Trail SL once BankNifty breaks out with momentum.
⚠️ Golden Rule:
Survive first, profit second. Capital protection creates consistency.
📌 SUMMARY
Bullish above → 59,517
🎯 Targets → 59,580 → 59,621 → 59,691
Bearish below → 59,291
🎯 Targets → 59,240 → 59,188 → 59,084
Strong Reversal Zone (for bounce trades):
✔️ 59,037 – 59,084
Key No-Trade Zone:
— 59,291 – 59,517 (Flat opening chop area)
🧾 CONCLUSION
BankNifty is at a critical decision point between 59,291–59,517, and the breakout or breakdown from this zone will drive the intraday trend.
The cleanest trades will come from:
✔️ Breakout + Retest above 59,517
✔️ Reversal from 59,037–59,084
✔️ Breakdown + Retest below 59,291
Avoid chop zones, wait for confirmation, and execute with discipline.
⚠️ DISCLAIMER
I am not a SEBI-registered analyst.
This analysis is for educational purposes only.
Please consult a certified financial advisor before making any trading decisions.
BANKNIFTY : Trading levels and Plan for 20-Nov-2025📊 BANKNIFTY TRADING PLAN — 20 NOV 2025
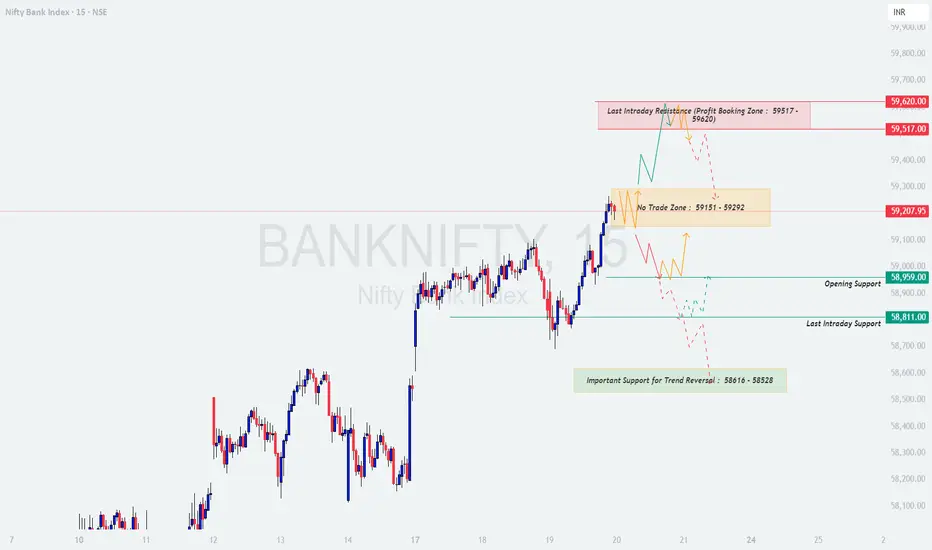
(Chart Basis: 15-min | Latest Close: 59,207.95)
Key Levels from Chart:
🔶 No Trade Zone: 59,151 – 59,292
🟥 Last Intraday Resistance / Profit Booking Zone: 59,517 – 59,620
🟩 Opening Support: 58,959
🟩 Last Intraday Support: 58,811
🟩 Important Swing Support for Trend Reversal: 58,616 – 58,528
These zones will govern direction and risk for the day.
🟢 SCENARIO 1 — GAP UP OPENING (200+ points)
Expected Opening Range: 59,400 – 59,500
A gap-up opening close to the Profit Booking Zone (59,517 – 59,620) is sensitive and prone to reversals.
Here’s the plan:
If BankNifty sustains above 59,620 →
🚀 Strong bullish continuation
🎯 Targets → 59,750 → 59,880 → 60,020
(Only valid if breakout candle closes above zone with volume.)
If price rejects from 59,517–59,620 →
Possible selling pressure →
📉 Targets → 59,380 → 59,292
Break below 59,292 after a gap-up is a weakness signal →
📉 Short Targets →
59,151 → 58,959
Avoid buying at open — wait for confirmation (retest or structure formation).
📘 Educational Tip:
Gap-up directly into resistance is a classic trap area where institutions distribute their positions.
Wait for the market to prove strength.
🟧 SCENARIO 2 — FLAT OPENING (Between 59,150 – 59,250)
A flat open places price inside the No Trade Zone (59,151 – 59,292).
This zone generally creates sideways, confusing price action.
Avoid trading inside the No-Trade Zone.
Reason: weak momentum, high noise, easy SL hunts.
Bullish Only if price sustains above 59,292 →
🎯 Targets → 59,380 → 59,517 → 59,620
Bearish Only if price sustains below 59,151 →
📉 Targets → 58,959 → 58,811
Best entries occur ONLY after zone break + retest.
📘 Why No-Trade Zone?
This zone is a price balancing area.
Market enters “indecision mode” — avoid low-quality setups.
🔻 SCENARIO 3 — GAP DOWN OPENING (200+ points)
Expected Opening Range: 58,800 – 58,950
Gap-down brings market closer to multiple strong support zones.
If price takes support at 58,959 →
Possible bounce setup →
🎯 Targets →
59,151 → 59,292
If price breaks 58,959 and sustains below it →
Next support = 58,811
Break below 58,811 gives →
📉 Targets →
58,700 → 58,616
If price enters the major support zone (58,616 – 58,528) →
Expect a high-probability reversal setup
(Strong buyers usually defend this region)
If reversal forms →
🎯 Upside Targets →
58,811 → 58,959 → 59,151
If 58,528 breaks →
Market turns weak
📉 Downside Targets →
58,420 → 58,300
📘 Educational Note:
Major supports often produce the strongest reversal trades —
But only after confirmation such as wicks, higher low, or bullish engulfing.
💼 OPTIONS TRADING RISK MANAGEMENT — MUST FOLLOW 💡
Avoid trading the first 3–5 minutes after open.
Use 20–30% SL for option buying.
Buy options ONLY near key zones to get better RR.
Avoid far OTM options — they decay faster near expiry.
Never average a losing position.
Book partial profits at +30–40%.
If 2 SLs hit → Stop trading for the day.
⚠️ Pro Tip:
Trading is not about catching every move —
It’s about protecting capital and taking only the “best” setups.
📌 SUMMARY
Bullish Above → 59,292
Targets → 59,380 → 59,517 → 59,620
Bearish Below → 59,151
Targets → 58,959 → 58,811
Major Trend Reversal Zone (Strong Demand):** 58,616 – 58,528**
Major Supply / Profit Booking Zone:** 59,517 – 59,620**
No Trade Zone:** 59,151 – 59,292**
🧾 CONCLUSION
The market sits right below a critical supply zone and just above strong supports.
Directional clarity will come only after breaking the No Trade Zone.
Your best trades come from:
✔️ Breakouts above 59,292
✔️ Rejections from 59,517–59,620
✔️ Reversal setups near 58,616–58,528
Stay disciplined, wait for confirmation, and follow your zones.
⚠️ DISCLAIMER
I am not a SEBI-registered analyst.
This analysis is purely for educational purposes and not investment advice.
Please consult your financial advisor before trading.
BANKNIFTY : Trading levels and Plan for 19-Nov-2025📊 BANK NIFTY TRADING PLAN — 19 NOV 2025
(Timeframe Reference: 15-Min Chart)
Chart Summary:
Bank Nifty closed at 58,835 after facing resistance near 59,016 , forming a short-term pullback. The structure suggests consolidation between 59,263 (Last Intraday Resistance) and 58,672 (Opening Support Zone) .
The broader trend remains positive as long as Bank Nifty holds above 58,355 (Last Intraday Support) , but traders must watch how price reacts at the Opening Resistance (59,016) and Opening Support (58672–58777) .
Currently, the market is at a decision zone — either it regains 59,000+ for bullish continuation or fails to hold support, triggering short-term profit booking.
Key Zones to Watch:
🟩 Supports: 58,672 / 58,355
🟥 Resistances: 59,016 / 59,263 / 59,480
⚖️ Bias: Bullish above 59,016 | Neutral between 58,835–58,672 | Bearish below 58,672
---
🟢 Scenario 1: GAP-UP Opening (200+ Points)
If Bank Nifty opens around or above 59,100 – 59,200 , it will open near the Last Intraday Resistance (59,263) . This level is critical as it marks the previous rejection point. A gap-up near resistance often leads to volatility and indecision initially.
If the index sustains above 59,263 for 15–20 minutes with volume confirmation, expect a bullish extension toward 59,480 – 59,600 .
If rejection occurs near 59,263 , a pullback toward 59,000 – 58,900 is likely; watch for reversal candles.
Avoid buying impulsively at open — instead, wait for a retest of 59,016 – 59,100 and then go long with confirmation.
Intraday longs can trail stop-loss to cost once price sustains 80–100 points above breakout.
💡 Educational Insight:
Gap-ups near resistance zones are psychological traps for impulsive traders. Professional traders wait for price confirmation — if the market holds above breakout zones with consistent volume, it signals genuine strength; otherwise, it’s a false rally.
---
🟧 Scenario 2: FLAT Opening (Around 58,800 – 58,900 Zone)
A flat open near the previous close will keep Bank Nifty right between the Opening Resistance (59,016) and Opening Support (58,672–58777) . This range acts as a “setup zone” for the day.
If the price sustains above 59,016 , expect bullish momentum toward 59,263 – 59,480 .
If it breaks below 58,672 , a short-term correction toward 58,500 – 58,355 may unfold.
Avoid taking trades within the range (58,750–58,950) during the first 15 minutes — let direction emerge.
Watch for price action confirmation: a strong 15-min candle close outside this range increases trade conviction.
🧠 Educational Tip:
Flat openings demand patience. The first 30 minutes often decide intraday bias. Avoid “anticipation trades.” Let the market choose direction and then align your position with volume-supported movement.
---
🔴 Scenario 3: GAP-DOWN Opening (200+ Points)
If Bank Nifty opens around 58,600 – 58,500 , it will directly test the Opening Support Zone (58,672–58,777) and possibly the Last Intraday Support (58,355) .
If the price forms bullish reversal candles (hammer, bullish engulfing) near 58,500–58,355 , expect a recovery toward 58,900 – 59,000 .
If Bank Nifty breaks below 58,355 decisively, weakness may extend to 58,150 – 58,000 .
Avoid aggressive shorting at the open — allow price to stabilize and show follow-through confirmation.
Reversal traders can wait for a recovery candle to form above 58,500 before entering long positions.
📘 Educational Note:
Gap-downs test trader discipline. Panic selling rarely rewards — always observe how the market reacts at key supports. A controlled response (low volume on down moves) indicates that institutional players are waiting to accumulate, not sell.
---
💼 RISK MANAGEMENT TIPS FOR OPTIONS TRADERS:
Avoid trading in the first 10–15 minutes — volatility is at its highest and can trigger premature stop-losses.
Risk only 1–2% of total capital per trade . Never overleverage.
Use ATM or slightly ITM options for directional bias. Avoid deep OTM unless there’s strong trend momentum.
Always place a stop-loss — emotional exits cost more than mechanical ones.
Trail profits when trade moves 40–50 points in your favor.
In choppy markets, prefer selling premium (straddle/strangle) only with hedges.
Avoid averaging losing trades — instead, focus on next setup.
⚠️ Golden Rule:
Survive first, thrive later! The trader who manages risk best, wins longest. Protect your capital — the next opportunity is always around the corner.
---
📈 SUMMARY:
🟩 Supports: 58,672 / 58,355
🟥 Resistances: 59,016 / 59,263 / 59,480
⚖️ Bias: Bullish above 59,016 | Bearish below 58,672
🎯 Intraday Levels to Watch:
- Above 59,016 → Target 59,263 → 59,480
- Below 58,672 → Target 58,500 → 58,355
---
📚 CONCLUSION:
Bank Nifty is entering 19th November near a pivotal zone — a breakout above 59,016 can reignite bullish momentum toward 59,480 , while a breakdown below 58,672 can trigger short-term pressure toward 58,355 .
The structure favors patient traders who wait for confirmation rather than anticipation. React to market behavior instead of predicting — precision trading is built on timing, not guesswork.
📊 Remember: Trade setups are probabilities, not guarantees — your edge lies in discipline, not prediction.
---
⚠️ DISCLAIMER:
I am not a SEBI-registered analyst . This analysis is purely for educational and informational purposes . Please conduct your own research or consult a certified financial advisor before making any trading or investment decisions.

BANKNIFTY : Trading levels and Plan for 18-Nov-2025📊 BANK NIFTY TRADING PLAN — 18 NOV 2025
(Timeframe Reference: 15-Min Chart)
Chart Summary:
Bank Nifty closed around 58,976 , showing strength after reclaiming key resistance levels but now entering a critical decision zone. The index is currently positioned just below the Opening Resistance / Support Zone (59,015 – 59,112) .
A decisive move above this zone could extend the bullish momentum toward 59,467 (Last Intraday Resistance) , while failure to hold above 58,871 (Opening Support) might invite intraday weakness back toward 58,711 (Last Intraday Support) .
Currently, sentiment remains cautiously bullish with upward bias as long as price sustains above 58,871 . Traders should focus on price action confirmation near breakout zones rather than pre-empting moves.
Key Levels to Watch:
🟩 Support Levels: 58,871 / 58,711 / 58,613
🟥 Resistance Levels: 59,112 / 59,467
⚖️ Bias: Bullish above 59,112 | Neutral between 58,871 – 59,015 | Bearish below 58,871
🟢 Scenario 1: GAP-UP Opening (200+ Points)
If Bank Nifty opens around or above 59,200 – 59,300 , it will open near the Last Intraday Resistance (59,467) . Gap-up openings around resistance zones often lead to early volatility and profit booking before directional clarity develops.
If price sustains above 59,467 with strong bullish candles (preferably 15-min close), expect a sharp rally toward 59,620 – 59,750 .
If rejection candles (upper wicks or bearish engulfing) form near 59,467 , expect a retracement back toward 59,112 – 59,000 .
Avoid buying immediately at open on a large gap-up; wait for a retest of 59,112 – 59,150 to confirm strength.
Aggressive traders can scalp long above 59,200 only if volume confirms continuation beyond resistance.
💡 Educational Insight:
Gap-up openings near major resistance zones often test patience. Market makers tend to trigger stop-losses both ways before establishing direction. Always let the market retest key levels — confirmation saves you from false breakouts.
🟧 Scenario 2: FLAT Opening (Around 58,950 – 59,000 Zone)
A flat opening near the current close places Bank Nifty right inside the Opening Resistance / Support Zone (59,015 – 59,112) . This zone will decide whether bulls retain control or bears attempt a reversal.
If the index breaks above 59,112 and sustains, expect bullish continuation toward 59,350 – 59,467 .
If the index fails to hold above 59,015 , weakness may extend toward 58,871 – 58,711 .
Avoid trading inside this narrow range (58,950–59,100) in the first 15–20 minutes — let structure form.
Focus on volume-backed breakout or breakdown candles before entering trades.
🧠 Educational Tip:
Flat openings are decision points. Most false moves happen within 15–30 minutes as traders chase early candles. The key is to wait for confirmation of structure — once trend direction is clear, risk-to-reward improves significantly.
🔴 Scenario 3: GAP-DOWN Opening (200+ Points)
If Bank Nifty opens near 58,700 – 58,750 , it will directly test the Last Intraday Support Zone (58,711 – 58,613) . This zone will determine whether bulls defend or a deeper correction unfolds.
If price forms reversal patterns (hammer, bullish engulfing) near 58,711 – 58,613 , expect a bounce toward 58,871 – 59,015 .
If price fails to sustain above 58,711 , further downside toward 58,500 – 58,380 becomes possible.
Avoid shorting aggressively on the gap-down; instead, wait for a weak pullback toward 58,850 for better risk entry.
Monitor volume closely — decreasing selling volume near supports signals exhaustion and potential reversal.
📘 Educational Note:
Gap-downs often create panic-driven selling, but smart traders look for structure rather than emotion. Reversal setups from support zones typically provide high-probability intraday opportunities when confirmed by bullish volume.
💼 RISK MANAGEMENT TIPS FOR OPTIONS TRADERS:
Avoid trading during the first 15 minutes of market open — volatility can cause misleading signals.
Keep your trade risk limited to 1–2% of total trading capital .
Use ATM or slightly ITM options for directional trades; avoid deep OTM options with poor delta.
Always use stop-loss orders ; don’t widen SL hoping for a reversal.
Trail stop-loss after 40–50 points in your favor to lock in profits.
If market turns sideways, book partial profits at key intraday levels and reduce position size.
Do not trade out of boredom — capital preservation > forced trades.
⚠️ Golden Rule:
Protect capital before chasing profits. A disciplined trader focuses on surviving volatility, not predicting every move.
📈 SUMMARY:
🟩 Key Supports: 58,871 / 58,711 / 58,613
🟥 Key Resistances: 59,112 / 59,467
⚖️ Bias: Bullish above 59,112 | Bearish below 58,871
🎯 Levels to Watch:
- Above 59,112 → Targets 59,350 / 59,467
- Below 58,871 → Targets 58,711 / 58,613
📚 CONCLUSION:
Bank Nifty continues to trade near key breakout levels, showing resilience above 58,900. The session on 18th November will revolve around whether it can sustain above 59,112 and move toward 59,467 , or if rejection triggers profit booking toward 58,711 .
Intraday traders should remain flexible — trade the reaction, not the prediction. Follow volume and price confirmation for entries and exits. In such consolidating phases, patience and discipline define success more than aggressive trading.
📊 Remember: The best traders are not the fastest but the most consistent and disciplined in execution.
⚠️ DISCLAIMER:
I am not a SEBI-registered analyst . The above analysis is purely for educational and informational purposes . Please conduct your own research or consult a certified financial advisor before making any trading or investment decisions.

BANKNIFTY : Trading levels and Plan for 17-Nov-2025📊 BANK NIFTY TRADING PLAN — 17 NOV 2025
(Timeframe Reference: 15-Min Chart)
Chart Summary:
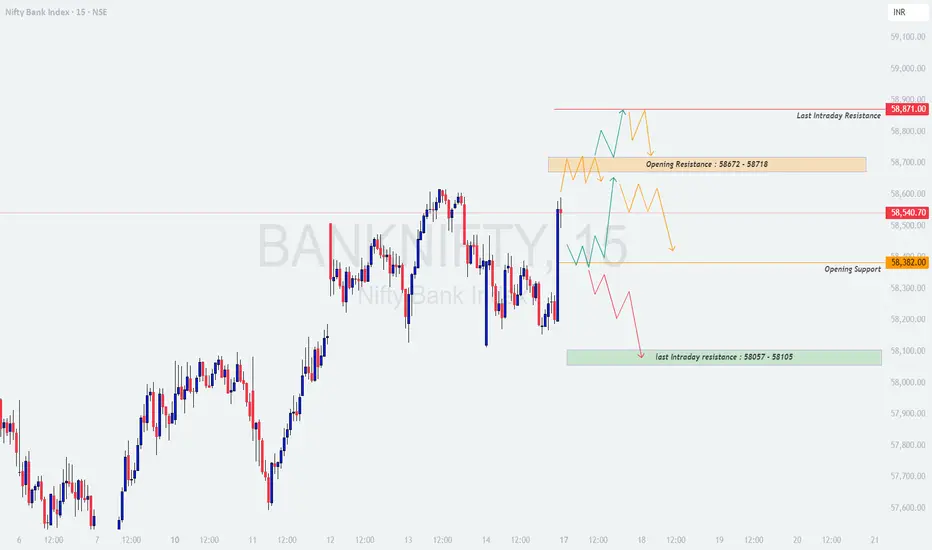
Bank Nifty closed around 58,540 , maintaining a balanced yet volatile structure. The index is currently trading near its Opening Resistance Zone (58,672 – 58,718) , while immediate support lies near 58,382 . Below this, the next key zone is Last Intraday Resistance turned Support (58,057 – 58,105) .
The price structure suggests a neutral-to-slightly bullish tone as long as the index sustains above 58,382 . A breakout above 58,718 may open the path toward 58,871 , while a breakdown below 58,382 can trigger a slide toward 58,100 .
Key Zones to Watch:
🟩 Supports: 58,382 / 58,100
🟥 Resistances: 58,718 / 58,871
⚖️ Bias Zone: 58,382 – 58,672 (Consolidation / No Trade Zone until clear breakout)
---
🟢 Scenario 1: GAP-UP Opening (200+ Points)
If Bank Nifty opens around or above 58,740 – 58,800 , it will directly enter or open above the Opening Resistance Zone (58,672 – 58,718) . Such a start could attract aggressive buying, but traders must be cautious of early profit booking near the Last Intraday Resistance (58,871) .
If price sustains above 58,718 for 15–20 minutes with strong bullish candles and volume, expect continuation toward 58,871 .
If momentum sustains beyond 58,871 , the next possible target zone is 58,950 – 59,000 .
If the index fails to sustain above 58,718 and forms rejection candles, a pullback toward 58,540 – 58,382 could occur.
Avoid chasing the gap-up; instead, wait for a retest of 58,718 — a breakout confirmation followed by retest offers the best low-risk entry.
💡 Educational Note:
Gap-ups near resistance often attract emotional buying from retail traders. Smart traders wait for confirmation of strength. Sustained price action above resistance with high volume signals institutional participation, while failure to hold levels hints at profit booking.
---
🟧 Scenario 2: FLAT Opening (Around 58,400 – 58,500 Zone)
A flat opening near the Opening Support (58,382) would keep Bank Nifty within a narrow consolidation range. This zone often becomes a “no trade” area until a clear breakout or breakdown confirms direction.
Avoid trading within 58,382 – 58,672 early in the session — this is a neutral consolidation zone.
If price breaks above 58,672 with strength, expect bullish momentum toward 58,871 .
If price breaks below 58,382 , weakness could extend toward 58,100 .
Watch for volume confirmation — breakout without volume can lead to false signals.
🧠 Educational Tip:
Flat openings test a trader’s patience. Most false trades occur when traders act before confirmation. Wait for volume-backed direction to emerge. Consolidation breakouts tend to be powerful once the direction is clear — discipline pays better than early entry.
---
🔴 Scenario 3: GAP-DOWN Opening (200+ Points)
If Bank Nifty opens around 58,200 – 58,250 , it will open below the Opening Support (58,382) . Such a move will test buyer strength and may invite early selling pressure.
If the index holds near 58,200 – 58,100 and forms bullish reversal candles (like hammer, morning star, or bullish engulfing), a recovery toward 58,382 – 58,540 could follow.
If price fails to hold above 58,100 , expect further downside toward 57,950 – 57,880 .
Avoid panic shorting after a big gap-down — instead, wait for a pullback toward 58,300 – 58,350 to initiate trades with defined risk.
Falling volume on red candles indicates selling exhaustion — this can be the first hint of reversal setups.
📘 Educational Insight:
Gap-down openings often trigger emotional selling. Experienced traders analyze whether the move is driven by real weakness or short-term panic. Watch candle structures and volume shifts at support zones — they reveal market intent better than speculation.
---
💼 RISK MANAGEMENT TIPS FOR OPTIONS TRADERS:
Avoid taking trades during the first 15–20 minutes of the session — IV (Implied Volatility) spikes can distort option premiums.
Never risk more than 1–2% of your total trading capital in a single trade.
Prefer ATM or slightly ITM options for directional trades — avoid deep OTM unless it’s a confirmed momentum breakout.
Trail your stop-loss once your trade moves 30–40 points in your favor — this protects profits.
Book partial profits at key zones like support/resistance levels and let the rest ride with a trailing SL.
Avoid averaging losing positions — focus on capital preservation first.
---
📈 SUMMARY:
🟧 Neutral Zone: 58,382 – 58,672
🟥 Resistance Zones: 58,718 / 58,871
🟩 Support Zones: 58,382 / 58,100
⚖️ Bias: Bullish above 58,672 | Bearish below 58,382
---
📚 CONCLUSION:
Bank Nifty is poised for a breakout move after recent consolidation. The price action around 58,382 – 58,672 will define the day’s direction. A sustained breakout above 58,718 can lead to strong upside momentum toward 58,871 – 59,000 , while a breakdown below 58,382 can pull prices toward 58,100 .
Patience, confirmation, and discipline remain the core edge for intraday traders. Avoid early trades during uncertain openings — wait for direction to align with volume and momentum.
📊 Remember: Trading is a game of probability, not certainty. Consistency in execution and risk control builds long-term success.
---
⚠️ DISCLAIMER:
I am not a SEBI-registered analyst . The analysis above is shared purely for educational and informational purposes . Please conduct your own research or consult a certified financial advisor before making any trading or investment decisions.
BANKNIFTY : Trading level and plan for 14-Nov-2025📊 BANK NIFTY TRADING PLAN — 14 NOV 2025
(Timeframe Reference: 15-Min Chart)
Chart Summary:
Bank Nifty closed near 58,387 , showing consolidation after a volatile previous session. The index currently trades close to its Opening Support / Resistance Zone (58,382) , marking a crucial level where directional bias could shift.
Immediate resistance lies at 58,544 (Opening Resistance) and 58,629 (Last Intraday Resistance) , while support is seen at 58,223 (Opening Support – Gap Down Case) and 57,982 (Last Intraday Support) .
The structure reflects a neutral-to-bullish bias as long as price sustains above 58,223, while a breakdown below this level could invite fresh short-term weakness.
Key Zones to Watch:
🟩 Support Levels: 58,223 / 57,982
🟥 Resistance Levels: 58,544 / 58,629 / 58,826
⚖️ Neutral Zone: 58,382 – 58,544
🟢 Scenario 1: GAP-UP Opening (200+ Points)
If Bank Nifty opens around or above 58,600 – 58,650 , it will open directly near the Last Intraday Resistance (58,629) . This gap-up will test whether buyers can sustain higher levels or if early profit-booking sets in.
If price sustains above 58,629 with a strong bullish candle (preferably a close above 58,650 on 15-min chart), the next upside target could be 58,826 .
However, if price fails to sustain above 58,629 and starts forming rejection candles, a pullback toward 58,544 – 58,382 could unfold.
For confirmation-based entries, wait for a successful retest of 58,629 — strong buying momentum with rising volume post-retest indicates a genuine breakout.
Avoid aggressive call buying at the open; instead, focus on breakout retest setups to maintain a favorable risk-reward ratio.
💡 Educational Note:
Gap-ups near resistance zones often create emotional entries for traders fearing “missing out.” Smart traders observe the first 15–30 minutes to confirm whether the breakout is sustained by volume or fading momentum. Strong trend days begin only when resistance flips into support.
🟧 Scenario 2: FLAT Opening (Around 58,380 – 58,420 Zone)
A flat open near the previous close indicates indecision and potential consolidation before the next move. This range could turn into a short-term battleground between buyers and sellers.
Avoid trading within 58,382 – 58,420 during the initial phase — this zone represents a neutral area with mixed signals.
If price breaks and sustains above 58,544 , upside targets open toward 58,629 – 58,826 .
If price breaks below 58,382 , weakness may drag it toward 58,223 , where fresh buyers could emerge.
Flat openings provide excellent breakout opportunities — traders should focus on volume confirmation and follow-through price action for directional cues.
🧠 Educational Tip:
Flat openings are where discipline matters most. Avoid preemptive trades — instead, “react” once the market picks direction. Waiting for a decisive breakout above resistance or below support allows higher confidence trades with reduced noise.
🔴 Scenario 3: GAP-DOWN Opening (200+ Points)
If Bank Nifty opens around 58,150 – 58,200 , it will directly test the Opening Support Zone (58,223) . This zone is crucial for bulls to defend the ongoing structure.
If reversal candles (like hammer or bullish engulfing) form around 58,223 – 58,150 , expect a potential short-covering bounce toward 58,382 – 58,544 .
If price fails to hold above 58,150 , further downside toward 57,982 is likely, which acts as the Last Intraday Support .
Avoid aggressive shorting immediately after the gap-down — instead, wait for a minor pullback toward 58,250 – 58,300 to enter with defined risk.
If volume drops during the decline, it may hint at selling exhaustion, signaling possible intraday reversal setups.
📘 Educational Insight:
Gap-downs often attract emotional panic-selling. Experienced traders look for reversal signals near major supports rather than joining the fall. Observe candle formations and volume shifts — they reveal whether institutional players are accumulating or distributing.
💼 RISK MANAGEMENT TIPS FOR OPTIONS TRADERS:
Avoid buying options in the first 15 minutes — IV (Implied Volatility) spikes can cause inflated premiums. Wait for the volatility to stabilize.
Limit exposure to 1–2% of trading capital per position. Preserve capital to stay in the game.
Prefer ATM or ITM options for better delta control and less theta decay. Avoid far OTM options unless trading confirmed momentum breakouts.
Use trailing stop-losses — for example, tighten SL after 40–50 points move in your favor to protect profits.
Book partial profits near key zones (support/resistance) and let the rest ride with a trailing SL.
Don’t average losing positions — capital protection > emotional recovery.
📈 SUMMARY:
🟧 Neutral Zone: 58,382 – 58,544
🟥 Resistance Zones: 58,629 / 58,826
🟩 Support Zones: 58,223 / 57,982
⚖️ Bias: Bullish above 58,544 | Weakness below 58,223
📚 CONCLUSION:
Bank Nifty’s price action around the 58,382 – 58,544 range will define the day’s tone. A sustained move above 58,544 can open the path toward 58,826 , whereas a break below 58,223 may trigger selling pressure toward 57,982 .
Patience and discipline remain your biggest edge. Avoid overtrading in volatile or range-bound setups — let the price confirm before acting. Focus on directional clarity backed by volume strength for high-probability trades.
📊 In trading, precision and patience outperform prediction — always wait for clarity before conviction.
⚠️ DISCLAIMER:
I am not a SEBI-registered analyst . The analysis above is shared purely for educational and informational purposes . Please conduct your own research or consult a certified financial advisor before making trading or investment decisions.

BANKNIFTY - Trading levels and Plan for 13-Nov-2025📊 BANK NIFTY TRADING PLAN — 13 NOV 2025
(Timeframe Reference: 15-Min Chart)
Chart Summary:
Bank Nifty closed near 58,211 , maintaining a balanced posture after strong intraday volatility. The index is hovering around the Opening Support / Resistance Zone (58,136 – 58,250) , indicating consolidation before the next directional move. Above this range lies Opening Resistance at 58,381 and Last Intraday Resistance at 58,611 , which will be key upside checkpoints for bullish continuation.
On the downside, 57,927 serves as the Last Intraday Support , and a breach below this could invite fresh short-term weakness. Traders should monitor how the market reacts around 58,136–58,250 in the initial phase to plan directional entries.
Key Levels to Watch:
🟩 Supports: 58,136 / 57,927
🟥 Resistances: 58,381 / 58,611 / 58,718
⚖️ Neutral Zone: 58,136 – 58,250 (No clear bias zone)
🟢 Scenario 1: GAP-UP Opening (200+ Points)
If Bank Nifty opens above 58,400 – 58,450 , it will enter the Opening Resistance zone right from the start. Bulls will need strong volume confirmation to sustain this breakout.
If price sustains above 58,381 for 15–20 minutes with strong bullish candles, expect a move toward 58,611 – 58,718 .
However, if price rejects near 58,611 , profit booking may push it back toward 58,381 – 58,250 .
For aggressive traders — wait for a retest of 58,381 post-breakout before entering long positions for better confirmation.
For positional bias, a daily close above 58,611 would strengthen bullish continuation for the next sessions.
💡 Educational Note:
A gap-up near resistance often traps impulsive buyers. Always wait for confirmation — a retest and hold above resistance signals genuine breakout strength, while a quick rejection hints at a bull trap. The key is patience, not prediction.
🟧 Scenario 2: FLAT Opening (Within 58,136 – 58,250 Zone)
If Bank Nifty opens flat within this tight range, the initial candles may show sideways movement or low volatility before a breakout defines direction.
Avoid trading inside this zone initially — the first 15 minutes are crucial to identify market intent.
If the index breaks and sustains above 58,250 , bulls can target 58,381 – 58,611 .
If it breaks below 58,136 , weakness may extend toward 57,927 .
Always track volume — low-volume breakouts are unreliable and prone to reversals.
🧠 Educational Tip:
Flat openings are tests of patience. Traders who rush into early trades often get caught in false breakouts. The key to success in range-bound zones is to wait for confirmation with volume and momentum alignment. Remember — no trade is better than a bad trade.
🔴 Scenario 3: GAP-DOWN Opening (200+ Points)
If Bank Nifty opens around 57,950 – 57,900 , it will test the Last Intraday Support (57,927) . Bulls will need to defend this zone to prevent a deeper correction.
If price forms bullish reversal candles (hammer, bullish engulfing) near 57,927 , a short-covering rally toward 58,136 – 58,250 can occur.
If the index fails to hold 57,927 , expect further downside toward 57,700 – 57,550 .
Avoid panic shorting after a big gap-down — instead, wait for pullbacks to 58,000 – 58,136 for higher probability entries.
Falling volume on red candles at support suggests exhaustion, hinting at a potential reversal setup.
📘 Educational Insight:
Gap-downs tend to trigger emotional decisions. Smart traders use the panic phase to identify exhaustion points. Watch for long wicks or failed breakdowns near major supports — these are often signs of institutional buying or short-covering.
💼 RISK MANAGEMENT TIPS FOR OPTIONS TRADERS:
Avoid trading options during the first 15 minutes — initial IV spikes can distort premium values.
Never risk more than 1–2% of total capital per trade.
Use ATM or ITM options for cleaner movement and lower theta decay. Avoid deep OTM options unless a breakout is confirmed.
Trail stop-losses aggressively once your trade moves 30–40 points in your favor.
Always book partial profits near key support/resistance zones.
Avoid averaging into losing positions — cut losses quickly and preserve capital for the next opportunity.
📈 SUMMARY:
🟧 Neutral Zone: 58,136 – 58,250
🟥 Resistance Zones: 58,381 / 58,611 / 58,718
🟩 Support Zones: 58,136 / 57,927
⚖️ Bias: Bullish above 58,250 | Bearish below 58,136
📚 CONCLUSION:
Bank Nifty’s movement for 13 Nov will depend on how it reacts around the 58,136 – 58,250 consolidation zone. A breakout above 58,250 can trigger bullish continuation toward 58,611 – 58,718 , while a breakdown below 58,136 could drag it back to 57,927 .
Traders should focus on confirmation over anticipation. Avoid overtrading during indecisive price action, and let volume and momentum guide entries.
📊 Remember: Trading is not about catching every move — it’s about catching the right move with controlled risk.
⚠️ DISCLAIMER:
I am not a SEBI-registered analyst . The above analysis is purely for educational and informational purposes . Please do your own research or consult a certified financial advisor before taking any trading or investment decisions.

BANKNIFTY : Trading levels and plan for 12-Nov-2025📊 BANK NIFTY TRADING PLAN — 12 NOV 2025
(Timeframe Reference: 15-Min Chart)
Chart Summary:
Bank Nifty closed near 58,148 , showing strong recovery momentum after multiple sessions of consolidation. The index is now trading near the Opening Resistance / Support Zone (58,158 – 58,258) and just below a crucial supply zone between 58,520 – 58,614 , which is marked as the Opening / Last Intraday Resistance Zone .
The market structure indicates that a breakout above 58,258 could invite strong buying momentum, while rejection from higher levels may trigger intraday profit booking. Bulls will aim to sustain above 58,258 to maintain upward strength, while bears may defend the 58,520–58,614 zone aggressively.
Key Zones to Watch:
🟩 Supports: 58,011 / 57,888
🟥 Resistances: 58,258 / 58,520 – 58,614
⚖️ Neutral Zone: 58,158 – 58,258
🟢 Scenario 1: GAP-UP Opening (200+ Points)
If Bank Nifty opens near or above 58,350 – 58,400 , it will immediately test the upper resistance area. Sustaining above 58,520 will be the key to continuing the bullish trend.
If the index sustains above 58,520 with strong bullish candles and high volume, it can target the next resistance near 58,614 , followed by 58,750 .
However, if rejection occurs near 58,520 – 58,614 , expect a pullback toward 58,258 – 58,158 .
Traders should wait for a retest of 58,520 post-breakout before entering long positions for confirmation and better risk control.
If prices show exhaustion or wicks near 58,614 , book profits partially — the zone has historically triggered intraday reversals.
💡 Educational Note:
Gap-up openings around key resistance levels often create excitement but also carry the highest risk of false breakouts. Wait for confirmation — a solid candle close above resistance on good volume indicates institutional buying. Without this, early entries can lead to quick reversals.
🟧 Scenario 2: FLAT Opening (Within 58,158 – 58,258 Zone)
If Bank Nifty opens flat within this range, early consolidation is likely. The first 15–30 minutes may witness sideways price action before a breakout establishes direction.
Avoid taking fresh trades inside this zone initially — this is the indecision band.
If price breaks above 58,258 and sustains, expect upward momentum toward 58,520 – 58,614 .
If price breaks below 58,158 , weakness may emerge, pulling the index back toward 58,011 – 57,888 .
Watch volume confirmation before entering — low-volume moves inside this zone are prone to reversal.
🧠 Educational Tip:
Flat openings favor patient traders. The key is to wait for market structure confirmation. The breakout from the first range usually defines the day’s dominant move. Most false trades occur when traders act before confirmation — staying observant pays more than staying active.
🔴 Scenario 3: GAP-DOWN Opening (200+ Points)
If Bank Nifty opens near 57,950 – 57,900 , the index will test the Opening Support Zone (58,011 – 57,888) . This area is vital for bulls to defend in order to sustain short-term uptrend structure.
If bullish reversal candles form near 57,888 (hammer or bullish engulfing), buyers may attempt to push the index back toward 58,158 – 58,258 .
However, if price breaks below 57,888 decisively with strong red candles and high volume, further weakness can extend toward 57,700 – 57,520 .
Avoid shorting immediately after a gap-down; instead, wait for a pullback toward resistance zones like 58,011 – 58,158 for higher probability trades.
Volume near support is key — declining volume on red candles indicates potential exhaustion and an upcoming reversal setup.
📘 Educational Insight:
Gap-downs are emotionally charged opens — many traders panic-sell into support zones. Experienced traders watch for exhaustion or reversal patterns to catch short-covering bounces. The best opportunities arise when the crowd reacts emotionally and you act logically.
💼 RISK MANAGEMENT TIPS FOR OPTIONS TRADERS:
Avoid trading options during the first 15 minutes after open — IV spikes can inflate premiums and result in quick time decay.
Always risk a maximum of 1–2% of total capital on any single trade.
Prefer ITM options for directional moves; they carry less decay and provide better correlation with the underlying index.
Trail stop-loss after 30–40 points of favorable movement to lock in profits.
Book partial profits near resistance or support zones — consistent small wins compound faster than rare big wins.
Avoid averaging down on losing positions — capital protection is priority number one.
📈 SUMMARY:
🟧 Key Neutral Zone: 58,158 – 58,258
🟥 Resistance Zones: 58,520 – 58,614
🟩 Support Zones: 58,011 / 57,888
⚖️ Bias: Bullish above 58,258 | Weakness below 58,158
📚 CONCLUSION:
Bank Nifty is approaching a critical juncture near 58,258 , where a decisive breakout can fuel continuation toward 58,614 , while rejection may trigger a healthy correction toward 58,011 – 57,888 .
The day’s success will depend on trader patience and ability to react to confirmation rather than anticipation. Respect the levels, avoid chasing moves, and focus on disciplined execution.
📊 Remember: In trading, the calmest mind often makes the clearest decisions. Let the price lead; your analysis should follow.
⚠️ DISCLAIMER:
I am not a SEBI-registered analyst . The analysis shared here is purely for educational and informational purposes . Please conduct your own research or consult a certified financial advisor before making any trading or investment decisions.

BANKNIFTY : Trading levels and plan for 11-Nov-2025📊 BANK NIFTY TRADING PLAN — 11 NOV 2025
(Timeframe Reference: 15-Min Chart)
Chart Summary:
Bank Nifty closed near 57,893 , sitting right in the middle of a No-Trade Zone (57,813 – 58,186) . This range highlights a zone of indecision where both bulls and bears are currently fighting for control.
The price structure shows a potential breakout setup: a move beyond this zone could lead to a sharp intraday trend, while remaining within it may result in choppy sideways action. Key levels to track include Opening Resistance at 58,186 and Opening Support at 57,813 .
Major resistance lies around 58,379 – 58,543 , while supports are placed near 57,627 – 57,358 . Tomorrow’s action will depend heavily on how price behaves around these breakout levels.
🟢 Scenario 1: GAP-UP Opening (200+ Points)
If Bank Nifty opens around or above 58,100 – 58,200 , it will directly enter the upper part of the No-Trade Zone near the Opening Resistance . Bulls need a strong follow-through above 58,186 to confirm an upside continuation.
If price sustains above 58,186 with bullish candle closings and volume expansion, an upward move toward 58,379 and 58,543 is likely.
However, if the index opens higher but faces rejection near 58,186 , expect a pullback toward 57,893 – 57,813 .
Ideal strategy: Wait for the first 15–30 minutes to settle. Enter only after a clear breakout retest above 58,186 to minimize risk of false moves.
Aggressive traders can trail stop-loss below 58,000 once the breakout sustains.
💡 Educational Note:
Gap-up openings near resistance often trap early buyers. Professionals wait for retests or volume confirmation before committing capital. A breakout that holds with clean price structure and rising volumes indicates institutional strength — that’s the kind of move worth trading.
🟧 Scenario 2: FLAT Opening (Within 57,813 – 58,186)
If Bank Nifty opens flat within this No-Trade Zone , expect early volatility and whipsaws. This range is not ideal for fresh entries until the index breaks out decisively on either side.
Avoid taking trades between 57,813 – 58,186 as price may fluctuate without direction.
If price breaks above 58,186 decisively with follow-through volume, targets open toward 58,379 – 58,543 .
If price breaks below 57,813 , expect weakness to extend toward 57,627 and possibly 57,358 .
Wait for confirmation candles and volume expansion — sideways markets are known for fake breakouts and false triggers.
🧠 Educational Tip:
Flat openings demand patience. When markets open inside a range, both buyers and sellers test control before a trend emerges. Most early losses occur because traders act before confirmation. The best opportunities form after the market “shows its hand” — not before.
🔴 Scenario 3: GAP-DOWN Opening (200+ Points)
If Bank Nifty opens below 57,700 , it will move near the lower boundary of the Opening Support Zone (57,813 – 57,627) . This will be the key area to watch for buyer reactions.
If reversal patterns (like hammer, bullish engulfing, or double bottom) appear near 57,627 – 57,358 , traders can look for a short-covering move toward 57,813 – 57,893 .
If price breaks and sustains below 57,627 with heavy selling, weakness may extend toward 57,358 and possibly 57,200 .
Avoid shorting immediately after a deep gap-down — wait for a pullback toward resistance for better entries and safer risk-reward setups.
Always observe how volume behaves near support — declining volume signals seller exhaustion, while strong red candles confirm continuation.
📘 Educational Insight:
Gap-downs often test emotional control. While they can look bearish initially, many turn into reversal days once the selling pressure fades. The key is to avoid emotional reactions and let the first few candles reveal intent. A stable base near major support often becomes a turning point.
💼 RISK MANAGEMENT TIPS FOR OPTIONS TRADERS:
Avoid buying options in the first 15 minutes — IV spikes post-open inflate premiums and cause quick time decay once volatility stabilizes.
Never risk more than 1–2% of your total capital on a single trade — survival in trading is about capital preservation.
Prefer ITM options for directional clarity; they offer smoother price behavior and less decay.
Trail stop-losses as soon as trades move 40–50 points in favor; protect profits without overexposure.
Avoid holding weekly options overnight unless you have a confirmed trend or hedge.
Always journal your trades — patterns of discipline are built from reflection, not reaction.
📈 SUMMARY:
🟧 No-Trade Zone: 57,813 – 58,186
🟥 Resistance Zones: 58,379 / 58,543
🟩 Support Zones: 57,627 / 57,358
⚖️ Bias: Neutral-to-Bullish above 58,186 | Weakness below 57,813
📚 CONCLUSION:
Bank Nifty is at a key decision zone — 57,813 – 58,186 acts as the battleground between bulls and bears. A sustained breakout above 58,186 can trigger a strong momentum rally toward 58,543 , while slipping below 57,813 could lead to a test of 57,627 – 57,358 .
The first 30 minutes of price action will set the tone — respect those levels, trade with confirmation, and avoid emotional impulses.
📊 Remember: Great traders don’t predict the market; they prepare for every scenario.
⚠️ DISCLAIMER:
I am not a SEBI-registered analyst . The views and levels shared here are purely for educational purposes . Please do your own research or consult a certified financial advisor before making any trading or investment decisions.
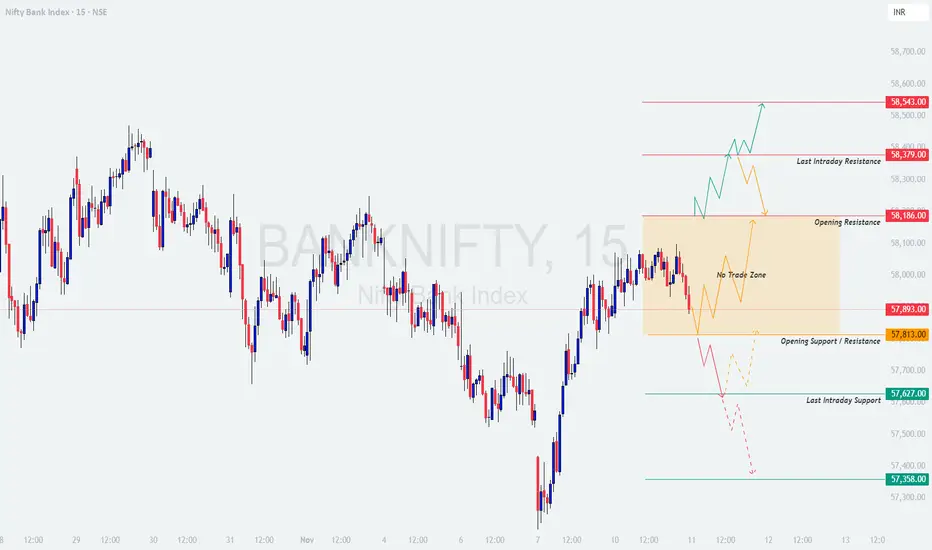
BANKNIFTY : Trading levels and plan for 10-Nov-2025📊 BANK NIFTY TRADING PLAN — 10 NOV 2025
(Timeframe Reference: 15-Min Chart)
Chart Summary:
Bank Nifty closed near 57,903 , resting just below its Opening Resistance / Support zone (58,013) . The market has shown a recovery from its recent dip and is now approaching a key decision point. The structure suggests a potential continuation if momentum builds above resistance, while the zone between 57,699 – 57,579 acts as an immediate support base for the bulls.
Key zones to note:
🟢 Supports: 57,699 / 57,579 / 57,337
🟥 Resistances: 58,013 / 58,382 / 58,541 (Profit Booking Zone)
Tomorrow’s session could open with a gap of 200+ points, and the opening structure will determine whether momentum sustains or fades.
🟢 Scenario 1: GAP-UP Opening (200+ Points)
If Bank Nifty opens above 58,100 , bulls will be eyeing continuation towards 58,382 and the Profit Booking Zone (58,382 – 58,541) .
If price sustains above 58,013 and holds the gap with strong volume, momentum buying can continue toward 58,382 . A breakout beyond that could push to 58,541 , where profit booking is expected.
However, if the index opens higher but fails to hold above 58,013 after the first 15–20 minutes, expect a pullback toward 57,903 – 57,699 .
Avoid chasing long positions at open — instead, wait for a retest of 58,013 as support before entering.
Short-term traders can look for intraday reversals if price shows rejection candles (shooting star or bearish engulfing) near 58,382 – 58,541 .
💡 Educational Note:
Gap-ups often attract emotional entries. The trick is to differentiate between genuine continuation and exhaustion. A strong follow-through candle with volume confirmation is essential — otherwise, what appears to be strength could turn into a bull trap.
🟧 Scenario 2: FLAT Opening (Between 57,699 – 58,013)
A flat opening near Opening Resistance / Support zone will make the early session tricky, as both sides will try to gain control. Expect tight consolidation before a breakout.
If price breaks and sustains above 58,013 , momentum can quickly shift toward 58,382 . Look for a solid bullish candle with volume before confirming breakout entries.
If price fails to break 58,013 and starts forming lower highs, it can retest the Opening Support (57,699 – 57,579) .
In case of sustained weakness below 57,579 , the structure turns bearish toward 57,337 .
Avoid entering within the tight zone of 57,699 – 58,013 ; this is a potential whipsaw area where stop-loss hits are frequent.
🧠 Educational Tip:
Flat openings are traps for impatient traders. Always let the first 3–4 candles define the direction. The best trades often come after false moves are flushed out and genuine volume-backed breakouts occur.
🔴 Scenario 3: GAP-DOWN Opening (200+ Points)
If Bank Nifty opens below 57,600 , the bias will turn cautious. Bears may test the Opening Support Zone (57,699 – 57,579) or even the Last Intraday Support (57,337) .
If price stabilizes around 57,579 – 57,337 and forms bullish reversal candles (hammer, engulfing), short-covering could lift price back toward 57,903 – 58,013 .
However, if price fails to recover above 57,579 and breaks below 57,337 decisively, weakness may extend further toward 57,100 – 56,950 .
Avoid panic shorting directly on the gap-down. Wait for a pullback to resistance areas for better entries and defined risk.
Watch for volume drop near support zones — this often signals exhaustion of selling pressure.
📘 Educational Insight:
Gap-downs usually cause emotional selling early in the session. Smart traders wait for confirmation of follow-through before acting. Price stability and volume divergence near major supports often provide the best risk-reward setups.
💼 RISK MANAGEMENT TIPS FOR OPTIONS TRADERS:
Avoid buying options during the first 15 minutes after open — high IV can inflate premiums and reduce returns once volatility cools.
Always define your stop-loss before taking a trade; risk no more than 1–2% of your total capital per setup.
Prefer ITM options for better delta and stability when directional bias is clear. Avoid far OTM strikes unless expecting sharp moves.
Trail your stop-loss after a 30–40 point favorable move — this locks in profits and reduces emotional exits.
Never revenge trade after losses — your capital is your ammunition. Protect it.
📈 SUMMARY:
🟧 Key Resistance Zone: 58,013 / 58,382 / 58,541
🟩 Support Zones: 57,699 / 57,579 / 57,337
⚖️ Bias: Neutral-to-Bullish above 58,013 | Weakness below 57,579
🎯 Profit Booking Area: 58,382 – 58,541
📚 CONCLUSION:
Bank Nifty is positioned at a critical inflection level — a breakout above 58,013 can open the path toward 58,382 – 58,541 , while losing 57,579 can tilt the momentum back toward the bears.
The day will favor traders who respect the first 15–30 minutes of price discovery and align trades only after volume-backed confirmation. Remember, in volatile markets, patience equals profits .
📊 Trade with logic, not emotion — the market rewards discipline, not impulse.
⚠️ DISCLAIMER:
I am not a SEBI-registered analyst . The above analysis is shared purely for educational purposes and should not be considered financial advice. Please do your own research or consult a certified financial advisor before making any trading or investment decisions.

BANKNIFTY : Trading levels and Plan for 07-Nov-2025📊 BANK NIFTY TRADING PLAN — 07 NOV 2025
(Timeframe Reference: 15-Min Chart)
Chart Summary:
Bank Nifty is currently trading near 57,574 , hovering just above its key Opening Support zone (57,423 – 57,504) . The index has been consolidating after recent declines and is now positioned between two crucial areas — Opening Resistance at 57,658 and Last Intraday Resistance at 57,883 .
A strong move beyond either side of this range is likely to set the tone for the day. Intraday volatility may rise around the open, so confirmation and patience will be key.
🟢 Scenario 1: GAP-UP Opening (200+ Points)
If Bank Nifty opens around or above 57,750 – 57,800 , it will directly approach the Opening Resistance zone. This area will act as the first major test for bulls.
If price sustains above 57,883 (Last Intraday Resistance), expect bullish continuation towards 58,088 , where profit booking may emerge.
Look for strong bullish candles with rising volume before taking long positions — avoid chasing the first candle of the day.
If price fails to sustain above 57,883 and shows rejection wicks or bearish engulfing patterns, it may retrace back to 57,658 – 57,574 .
Ideal strategy: Wait for a retest of 57,658 with support confirmation before entering fresh longs. This provides a safer risk-reward setup.
💡 Educational Note:
Gap-up openings often cause over-enthusiasm. Let the market show its intent. Sustained strength with high volume near resistance confirms that institutional buyers are active. A fake breakout without volume can lead to sharp intraday reversals.
🟧 Scenario 2: FLAT Opening (Within 57,504 – 57,658)
A flat opening near the Opening Resistance and Opening Support zones may keep the index choppy in the first 30 minutes. Both buyers and sellers are likely to test strength before committing directionally.
Avoid early trades within this band ( 57,504 – 57,658 ) — it’s a neutral range with limited edge.
If price breaks above 57,658 decisively, watch for momentum toward 57,883 and 58,088 .
If price breaks below 57,504 , expect weakness towards 57,423 , followed by 57,239 (Last Intraday Support).
Breakouts supported by volume expansion are more reliable — low-volume moves near these zones often trap traders.
🧠 Educational Tip:
Flat openings are ideal for breakout traders. Always react to confirmed breakouts rather than anticipating them. False moves during consolidation phases are the number one reason for premature losses.
🔴 Scenario 3: GAP-DOWN Opening (200+ Points)
If Bank Nifty opens below 57,350 , it enters the weak zone near the Opening Support (57,423 – 57,504) .
If price forms a reversal pattern (hammer, bullish engulfing, or double bottom) near 57,239 – 57,300 , traders can look for a short-covering opportunity toward 57,574 – 57,658 .
However, a sustained break below 57,239 with heavy selling volume could accelerate downside momentum toward 57,100 – 57,000 .
Avoid aggressive shorts on deep gap-downs; instead, wait for a pullback toward resistance for better entries.
📘 Educational Insight:
Gap-downs often begin with emotional selling. Most profitable trades form when you identify where sellers exhaust. Watch for signs like declining volume on down candles or sharp rejections near support zones — these often hint at reversals.
💼 RISK MANAGEMENT TIPS FOR OPTIONS TRADERS:
Avoid buying options in the first 15–20 minutes — early IV spikes make premiums expensive and often lead to time decay once volatility cools.
Define your stop-loss clearly before entering; never risk more than 1–2% of your total trading capital per trade.
If you’re directional, prefer ITM options for stability and avoid far OTM strikes on range-bound or flat days.
Trail your stop-loss as soon as you capture a 30–40 point favorable move — this locks in profits while reducing downside risk.
Remember: Protecting your capital during uncertain sessions matters more than catching every move.
📈 SUMMARY:
🟧 Opening Support Zone: 57,423 – 57,504
🟥 Resistance Zones: 57,658 / 57,883 / 58,088
🟩 Support Zones: 57,239 / 57,100
⚖️ Bias: Neutral-to-Bullish above 57,658 | Weakness below 57,504
📚 CONCLUSION:
Bank Nifty is trading at a crucial inflection point, where 57,658 acts as a key breakout level and 57,423 serves as an immediate defense for bulls. A breakout beyond these levels will dictate intraday direction.
The best trades tomorrow will come from waiting for confirmation — not prediction. Respect price structure, stay disciplined, and always trade based on technical evidence rather than emotion.
📊 Patience + Planning = Profitable Trading.
⚠️ DISCLAIMER:
I am not a SEBI-registered analyst . The analysis shared above is purely for educational purposes and to promote informed trading practices. Please consult a certified financial advisor before making any trading or investment decisions.
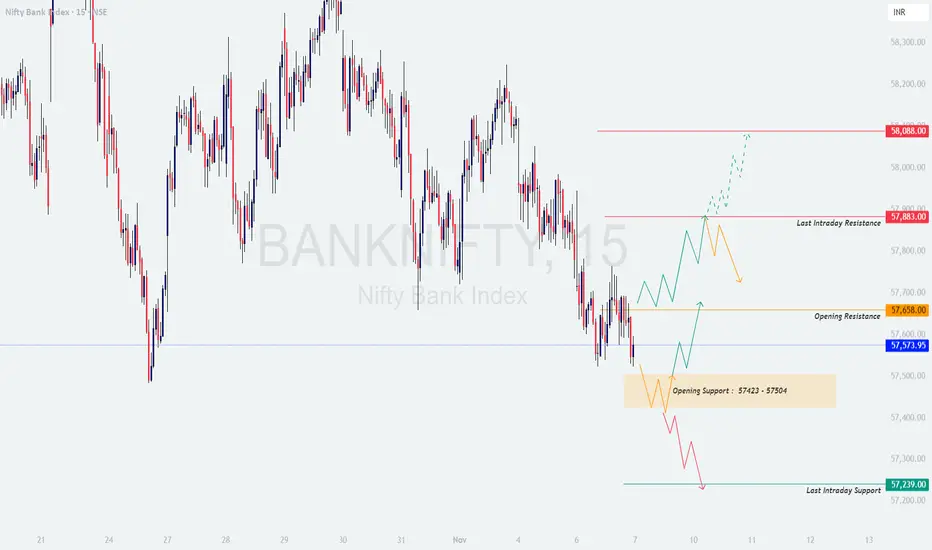
BANKNIFTY : Trading levels and Plan for 05-Nov-2025📊 BANK NIFTY TRADING PLAN — 05 NOV 2025
(Timeframe Reference: 15-min Chart)
Chart Summary:
Bank Nifty is currently trading near the 57,780 zone, which lies just below the key Opening Resistance area (57,782 – 57,989). A clear No Trading Zone has been identified between these levels, suggesting indecision at the open. A strong directional move is expected once the index breaks out of this band.
🟢 Scenario 1: GAP-UP Opening (200+ points)
If Bank Nifty opens above 58,000, it will likely test the immediate resistance near 58,137. A sustained move above this could invite momentum buying towards 58,385 — the next intraday resistance.
If price sustains above 58,137 with strong candle close, traders may consider long positions with a target towards 58,385.
Stop-loss can be maintained just below 57,980, as falling below this zone may trigger a pullback back into the range.
If price fails to sustain above 58,137 and shows rejection candles, short traders can look for a retracement back toward 57,989 – 57,780 zone.
🧠 Educational Note: Gap-up openings often trigger emotional entries. Always let the first 15–30 minutes settle before committing to a direction. Breakout confirmation through strong volume is essential to avoid traps.
🟧 Scenario 2: FLAT Opening (Within 57,782 – 57,989)
This range represents a No Trading Zone. Price is likely to remain volatile and whipsaw both sides before confirming direction. Patience is key here.
Avoid initiating fresh positions within the zone (57,782 – 57,989).
If price breaks above 57,989 decisively, expect a potential rise toward 58,137, followed by 58,385.
If price breaks below 57,782, it may drag the index towards the lower intraday support near 57,504 – 57,424.
💡 Educational Tip: Flat openings are ideal for breakout traders. Wait for clear directional volume confirmation before entering. Most false moves happen when traders anticipate instead of reacting.
🔴 Scenario 3: GAP-DOWN Opening (200+ points)
If the index opens below 57,600, weakness may extend towards the Last Intraday Support zone (57,424 – 57,504). This zone is critical for bulls to defend.
If a reversal candle forms near 57,424 – 57,504, buyers may attempt a short-covering move back toward 57,780.
However, a sustained move below 57,400 can extend the fall toward 57,240, which acts as the final intraday support.
Traders should avoid shorting deep gap-downs immediately — instead, wait for a pullback to the nearest resistance (57,700–57,780) for better risk-reward.
📘 Educational Insight: Gap-downs often lead to panic selling in the first 10–15 minutes. Always wait for the price to form a base before anticipating reversals. Intraday traders should track if volume drops near key support levels — it often hints at exhaustion of selling.
💼 RISK MANAGEMENT TIPS FOR OPTIONS TRADERS:
Avoid buying options during the first 15 minutes of volatile openings — IV (Implied Volatility) spikes can inflate premium costs.
Always define your risk before entering. Limit your exposure to 1–2% of total capital per trade.
If trading intraday options, trail your stop-loss after a 30–40 point favorable move in Bank Nifty.
Use ITM options for directional confidence and avoid far OTM strikes on non-trending days.
Stay disciplined — remember, missing a trade is better than being trapped in a false breakout.
📈 SUMMARY:
🟧 No Trading Zone: 57,782 – 57,989
🟥 Resistance Zones: 58,137 / 58,385
🟩 Support Zones: 57,504 – 57,424 / 57,240
⚖️ Bias: Neutral-to-Bullish above 57,989 | Weakness below 57,782
📚 CONCLUSION:
The structure suggests Bank Nifty is at a crucial decision point. Bulls must reclaim 58,000+ to re-establish control, while bears will try to push it below 57,780. Staying patient during the opening volatility and respecting breakout levels can make the difference between profit and emotional trades.
⚠️ DISCLAIMER:
I am not a SEBI-registered analyst . The views expressed here are for educational purposes only. Please conduct your own research or consult a financial advisor before making trading decisions.
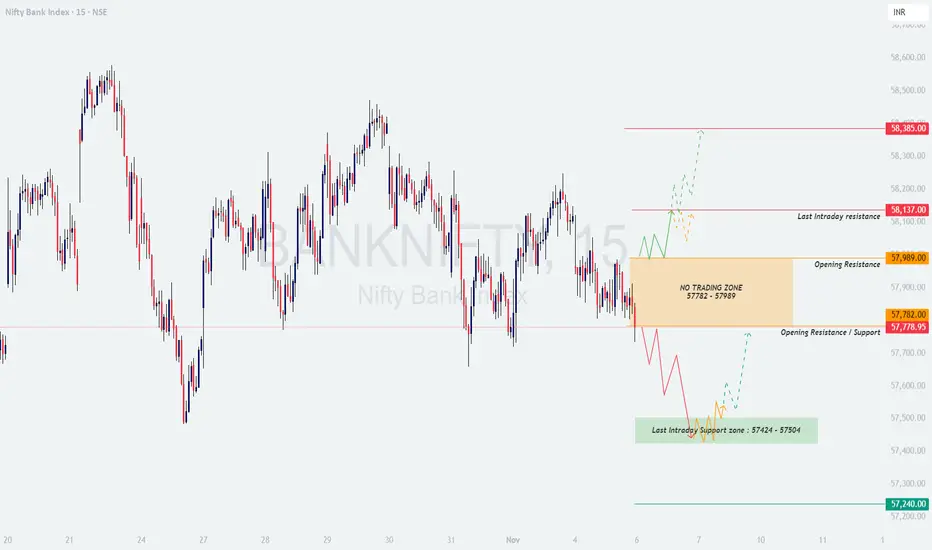
BANKNIFTY : Trading levels and plan for 03-Nov-2025BANKNIFTY TRADING PLAN – 03-Nov-2025
📊 Prepared by LiveTradingBox | Based on 15-min chart structure & psychological correction theory
🔍 Key Reference Levels:
🟩 Last Intraday Support: 57,344 – 57,234
🟧 No Trade Zone: 57,693 – 57,976
🟨 Opening Resistance: 58,060
🟥 Last Intraday Resistance: 58,295
🔺 Profit Booking Zone: 58,722
🟢 1. Gap-Up Opening (Above 58,060 – 200+ points)
If Bank Nifty opens above 58,060, it reflects a bullish sentiment driven by overnight momentum or positive global cues. However, the key test will be whether the index can sustain above this breakout zone or not.
Plan of Action:
Wait for the first 15–20 minutes to let early volatility settle.
A retest and strong candle close above 58,060 can trigger fresh buying opportunities.
Initial targets will be 58,295 (last intraday resistance) and then 58,722 (profit booking zone).
Maintain a stop loss below 57,950 on an hourly close basis for positional trades.
If Bank Nifty rejects from 58,295 with heavy volume, consider partial profit booking or a light counter short scalp targeting 58,000 – 57,900.
📘 Educational Insight:
Chasing a gap-up is one of the most common retail trader mistakes. Professionals wait for confirmation near resistance retests or structure validation to ensure they’re aligning with institutional flow rather than speculative enthusiasm.
🟦 2. Flat Opening (Around 57,750 ±100 points)
A flat start near the midpoint of the No Trade Zone (57,693 – 57,976) indicates indecision and balance between buyers and sellers. Patience is crucial here, as this range acts as a neutral ground where false signals can easily trap traders.
Plan of Action:
Avoid entering immediately after the open — the market needs time to reveal direction.
Wait for a breakout above 57,976 for potential upside movement toward 58,060 – 58,295.
A breakdown below 57,693 may trigger weakness toward 57,344 – 57,234.
Do not trade within the No Trade Zone to avoid choppy moves and unnecessary losses.
Focus on candle confirmations — avoid pre-empting breakouts or breakdowns.
📘 Educational Insight:
Flat openings are where discipline and patience pay off. Avoid trading “inside noise” — wait for price to leave the neutral range with conviction before joining the move.
🔻 3. Gap-Down Opening (Below 57,600 – 200+ points)
A gap-down below 57,600 signals weakness or profit booking, especially if it’s accompanied by negative global cues. The support zone of 57,344 – 57,234 becomes the key area to watch for buyer reactions.
Plan of Action:
Monitor price behavior near 57,344 – 57,234. If Bank Nifty forms a strong bullish reversal candle (hammer or engulfing), it can offer a potential intraday long setup.
Targets for such a bounce can be 57,600 – 57,800, but avoid overextending trades unless strong momentum follows.
Keep a strict stop loss below 57,200 to protect from deeper slides.
If the support fails to hold and price sustains below 57,234, expect continued weakness toward 57,000 – 56,850 levels.
Avoid aggressive averaging — trend continuation can accelerate in such cases.
📘 Educational Insight:
Gap-downs often trigger emotional selling among retail participants. However, observing price reactions at support zones helps identify whether the move is panic-driven or part of a larger corrective phase.
🧠 Risk Management Tips for Options Traders:
Never enter trades based on emotions — use defined entry and exit levels.
Avoid buying options during the first 15 minutes of the session; volatility premium is highest then.
Prefer ATM or slightly ITM options for directional trades — they offer better delta control.
Stick to a maximum risk limit of 2–3% per trade .
If you hit your daily loss limit, step aside and protect your capital — survival > prediction.
Keep monitoring time decay, especially post 2 PM — theta accelerates rapidly.
📈 Summary & Conclusion:
Above 58,060, trend bias is bullish toward 58,295 – 58,722, provided the level sustains.
Between 57,693 – 57,976, stay neutral — it’s a No Trade Zone; let direction confirm.
Below 57,600, expect weakness until support near 57,344 – 57,234 reacts.
Patience, observation, and disciplined execution are key to consistent results.
⚠️ Disclaimer:
I am not a SEBI-registered analyst . This analysis is intended purely for educational and informational purposes . Traders and investors should perform their own research or consult with a financial advisor before taking any trading or investment decisions.
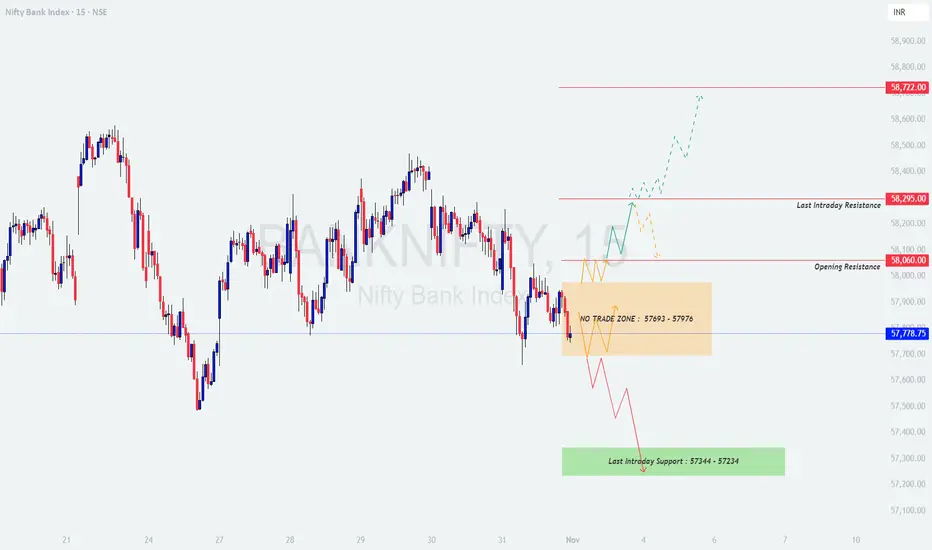
BANKNIFTY : Trading levels and Plan for 31-Oct-2025BANK NIFTY TRADING PLAN – 31-Oct-2025
📊 Prepared by LiveTradingBox | Based on 15-min structure and psychological correction theory
🔍 Key Reference Levels:
🟥 Profit Booking Zone: 58,368 – 58,594
🟧 Opening Resistance: 58,236
🟦 Current Reference Level: 58,067
🟩 Opening Support Zone: 57,856 – 57,896
🟢 Late Support Range: 57,580 – 57,692
🟢 1. Gap-Up Opening (Above 58,236 – 200+ points)
If Bank Nifty opens above 58,236, it indicates bullish enthusiasm and possible continuation momentum toward 58,368 – 58,594. However, chasing a strong gap-up is risky unless the index sustains above the breakout level after the first 15–20 minutes of opening.
Plan of Action:
Wait for price stability for at least the first 15 minutes — avoid impulsive entries.
If price retests and sustains above 58,236, consider a long entry aiming for 58,368 – 58,594.
Maintain a stop loss below 58,100** on an hourly close basis.
Partial profit booking near 58,368 is advised, trail remaining position for extended upside.
If price rejects from 58,368 – 58,594, expect a short-term pullback toward 58,100 – 57,900.
📘 Educational Insight:
Gap-ups near resistance zones often trigger emotional buying by retail traders. Smart traders wait for a retest near the breakout area to enter with a controlled risk–reward setup rather than chasing candles at open.
🟦 2. Flat Opening (Around 58,050 ±100 points)
A flat start near 58,050 suggests market indecision or neutral sentiment. This is the most crucial zone where both bulls and bears will attempt to take control. Price action near 58,236 or 57,896 will guide the day’s direction.
Plan of Action:
Let the market form its initial range within 30 minutes before reacting.
A breakout and sustain above 58,236 can trigger bullish momentum toward 58,368 – 58,594.
A breakdown below 57,896 can invite short trades targeting 57,692 – 57,580.
Avoid taking trades in between 58,050 – 57,896 range as it may cause false signals.
Wait for a confirmed candle close beyond these levels for a directional entry.
📘 Educational Insight:
Flat openings are generally setup builders. Let the structure develop — acting too early may lead to whipsaws. Always trade the breakout, not the anticipation.
🔻 3. Gap-Down Opening (Below 57,856 – 200+ points)
If Bank Nifty opens below 57,856, it signals weakness or bearish sentiment influenced by overnight global cues or profit booking. The next crucial zone is 57,580 – 57,692, which is expected to act as a strong support region.
Plan of Action:
Observe the first 15 minutes of market reaction near 57,580 – 57,692.
If buyers defend this zone with strong reversal candles, consider a reversal long entry targeting 57,856 – 58,000.
Keep a stop loss below 57,550** (psychological round level).
If price fails to hold above 57,580, avoid long positions — it can slide further to 57,400 – 57,300.
For bearish continuation trades, wait for sustained weakness below 57,580 to avoid traps.
📘 Educational Insight:
Gap-downs create panic among participants, but patient observation often reveals strong buying near support zones. Reaction at support matters more than prediction — trade what you see, not what you fear.
🧠 Risk Management Tips for Options Traders:
Use strict stop losses and avoid averaging losing trades.
Trade only after the first 15–20 minutes to avoid early volatility traps.
Prefer ATM or slightly ITM options to balance delta and time decay.
Always define risk per trade — never risk more than 2–3% of total capital.
Avoid emotional revenge trades; protect profits with trailing stops.
Record your trades daily to refine future decision-making.
📈 Summary & Conclusion:
Above 58,236, bias remains bullish toward 58,368 – 58,594.
Between 58,050 – 57,896, expect consolidation; avoid impulsive trading.
Below 57,856, weakness may extend toward 57,692 – 57,580; observe reactions here for reversals.
Trade levels, not emotions — patience and timing matter more than predictions.
⚠️ Disclaimer:
I am not a SEBI-registered analyst . The above analysis is purely for educational and informational purposes only . Traders should perform their own research or consult a financial advisor before making any trading or investment decisions.
