BANKNIFTY : Trading levels and Plan for 16-Sep-2025BANK NIFTY TRADING PLAN – 16-Sep-2025
📊 Spot Price (Previous Close): 54,852
🔑 Key Levels from Chart:
Opening Resistance Zone: 54,966 – 55,052
Last Intraday Resistance: 55,163
Major Resistance: 55,461
Opening Support Zone: 54,751 – 54,703
Last Intraday Support: 54,551
Buyer’s Support Zone: 54,269 – 54,352
🔹 Scenario 1: Gap-Up Opening (200+ Points above 54,966)
If Bank Nifty opens with strength above 54,966, it directly tests the Opening Resistance Zone (54,966 – 55,052).
A strong breakout and hourly close above this zone may push prices toward 55,163, which is the last intraday resistance.
If bullish momentum continues, an extended move toward the 55,461 major resistance is possible.
On the flip side, rejection from 55,052 can cause a pullback toward 54,966, which then acts as support.
📌 Educational Note: Gap-ups near resistance zones often face selling pressure. Always wait for confirmation candles before entering long trades.
🚨 Risk Tip: Instead of buying naked calls at higher premiums, prefer Bull Call Spreads (Buy ATM call + Sell OTM call) to reduce risk.
🔹 Scenario 2: Flat Opening (Between 54,703 – 54,966)
A flat open in this range suggests indecision, where both buyers and sellers will try to dominate.
A breakout above 54,966 can trigger bullish momentum toward 55,052 → 55,163, and possibly higher levels.
On the downside, if price slips below 54,751 – 54,703 support zone, it may test the 54,551 last intraday support.
Sustained trading in this zone without breakout may lead to sideways price action.
📌 Educational Note: Flat opens usually trap impatient traders. Observing the first 30 minutes helps in identifying genuine breakouts or breakdowns.
🚨 Risk Tip: Trade with small position sizing in flat zones. Scale up only after clear directional breakout.
🔹 Scenario 3: Gap-Down Opening (200+ Points below 54,551)
A sharp gap-down below 54,551 will put immediate pressure on bulls.
If this level fails, prices may slide toward the Buyer’s Support Zone (54,269 – 54,352).
A breakdown below 54,269 can intensify selling and invite deeper corrections.
However, if Bank Nifty finds support near 54,352 – 54,269 and rebounds, a pullback rally toward 54,551 may occur.
📌 Educational Note: Gap-downs near strong supports often create volatile intraday moves. Avoid panic selling; wait for confirmation before shorting.
🚨 Risk Tip: Use Bear Put Spreads (Buy ATM put + Sell lower strike put) instead of naked put buying to hedge against sudden short-covering rallies.
📝 Summary & Conclusion
Bullish above: 54,966 → Targets: 55,052 / 55,163 / 55,461
Neutral Zone: 54,703 – 54,966 → Choppy range, wait for breakout.
Bearish below: 54,551 → Downside targets: 54,352 / 54,269
📌 The market is currently at a crucial resistance zone. A clean breakout above 54,966 – 55,052 can extend bullish momentum, while a breakdown below 54,551 may shift trend to bearish.
💡 Options Tip: For directional trades, prefer ATM/ITM options for higher delta. In uncertain zones, adopt spreads (Bull Call / Bear Put) instead of naked options to minimize theta decay.
⚠️ Disclaimer: I am not a SEBI-registered analyst. This plan is prepared purely for educational purposes. Please do your own research or consult a financial advisor before making trading decisions.
Bankniftyprediction
BANKNIFTY : Trading levels and plan for 12-Sep-2025BANK NIFTY TRADING PLAN – 12-Sep-2025
📊 Spot Price (Previous Close): 54,644
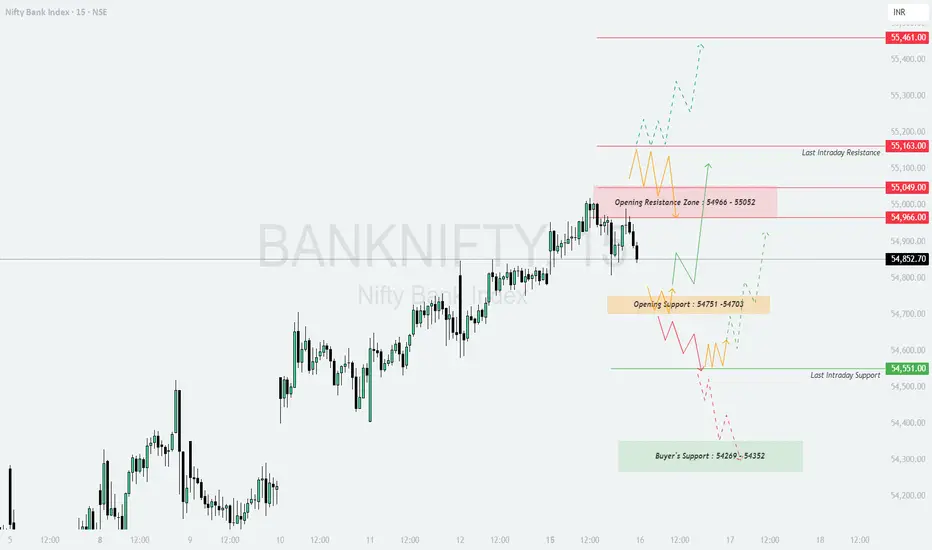
🔑 Key Levels:
Opening Resistance: 54,831
Last Intraday Resistance: 55,049
Major Resistance: 55,163
Opening Support: 54,550
Last Intraday Support: 54,386
Major Support: 54,157
🔹 Scenario 1: Gap-Up Opening (200+ Points above 54,831)
If Bank Nifty opens above 54,831, it will enter the bullish territory directly.
A sustained move above this resistance can trigger a rally toward 55,049, which is the last intraday resistance.
If momentum is strong, the index may further extend toward 55,163, but expect profit booking near this zone.
Any rejection near 55,049 – 55,163 can pull prices back toward 54,831, which then becomes the intraday support.
📌 Educational Note: Large gap-ups near resistance should be traded cautiously. Wait for confirmation candles before taking long entries.
🚨 Risk Tip: Avoid chasing calls blindly on gap-ups. Instead, consider spreads (Bull Call Spreads) to protect against sudden reversals.
🔹 Scenario 2: Flat Opening (Between 54,550 – 54,831)
A flat open within this zone signals a balanced start.
A breakout above 54,831 will open room for a bullish move toward 55,049 – 55,163.
On the downside, if Bank Nifty slips below 54,550, it will test the 54,386 support zone.
Price action within this range (54,550 – 54,831) may be choppy, so wait for a clear directional breakout.
📌 Educational Note: Flat openings often trap impatient traders. The first 30 minutes can provide clarity, so observe before acting.
🚨 Risk Tip: Use smaller positions when trading range-bound setups. Only scale up once breakout confirmation happens.
🔹 Scenario 3: Gap-Down Opening (200+ Points below 54,386)
If Bank Nifty opens below 54,386, it will put pressure on the market sentiment.
Breaking this support can extend the fall toward 54,157, which is a critical support zone.
If the index defends 54,386 and shows reversal signs, a pullback toward 54,550 may occur, creating a short-covering opportunity.
Below 54,157, the trend may turn strongly bearish, and deeper corrections are possible.
📌 Educational Note: Gap-downs near strong supports often create intraday volatility. Avoid panic trades and wait for confirmation candles.
🚨 Risk Tip: Instead of naked put buying, prefer Bear Put Spreads or hedge with futures to manage risk against rebounds.
📝 Summary & Conclusion
Bullish above: 54,831 → Targets: 55,049 / 55,163
Neutral Zone: 54,550 – 54,831 → Avoid overtrading here.
Bearish below: 54,386 → Next support: 54,157
📌 The index is currently in a critical consolidation phase. Watch for breakouts above 54,831 for bullish continuation and breakdowns below 54,386 for bearish moves.
💡 Options Tip: For directional trades, prefer ATM/ITM options. In choppy zones, use spreads instead of naked positions to control time decay.
⚠️ Disclaimer: I am not a SEBI-registered analyst. This plan is prepared purely for educational purposes. Please do your own research or consult a financial advisor before making trading decisions.

BANKNIFTY : Trading levels and plan for 11-Sep-2025BANK NIFTY TRADING PLAN – 11-Sep-2025
(Levels derived from support–resistance pivots and market psychology)
📈 Gap-Up Opening (200+ points above 54,732)
If Bank Nifty opens significantly above 54,732 (Last Intraday Resistance), the sentiment will turn strongly bullish.
Sustaining above this zone can drive momentum toward 54,955 (Major Resistance).
Intraday traders should watch for rejection near 54,955, as this is a psychological supply area.
Any pullback toward 54,732 – 54,643 may act as a retest zone for fresh long entries.
👉 Strategy: Avoid chasing the first candle. Enter long trades only if the price consolidates above 54,732 for 15–30 minutes. Targets: 54,955, with SL below 54,643. Short only if a clear rejection candle forms at 54,955.
📊 Flat Opening (Around 54,466 – 54,566 zone)
A flat open around the Opening Support/Resistance (54,466 – 54,566) indicates indecision.
If Bank Nifty sustains above 54,566, it may build momentum toward 54,732, and then toward 54,955.
If price fails to cross 54,566 and slips below 54,466, weakness may drag it toward 54,319 (Last Intraday Support).
This zone may see choppy moves; patience is key to avoid false entries.
👉 Strategy: Let the first 30 minutes settle. Go long only above 54,566 with targets 54,732 – 54,955. Consider shorts if it trades below 54,466, aiming for 54,319.
📉 Gap-Down Opening (200+ points below 54,266)
If Bank Nifty opens below 54,266, it signals weakness from the start.
Immediate cushion lies at 54,213; a breakdown here may extend to deeper supports near 54,000.
If buyers defend 54,213, a bounce toward 54,319 – 54,466 is possible, but strength must be confirmed.
Sustained trading below 54,213 may trigger panic selling.
👉 Strategy: Look for shorts below 54,213, targeting 54,000. Avoid aggressive longs unless a reversal candle appears near 54,213 with strong volume.
🛡️ Risk Management Tips for Options Traders
📊 Avoid taking trades in the first few minutes of volatile openings; let direction settle.
🛑 Always define a strict SL based on levels (prefer hourly candle close for major levels).
💰 Trail SL once trade moves in your favor to secure profits.
🚫 Avoid averaging in options; cut losing trades quickly and re-enter only on clear confirmation.
⚖️ Position sizing should be limited—don’t risk more than 1–2% of total capital in a single trade.
📌 Summary & Conclusion
✅ Above 54,732, Bank Nifty targets 54,955, bullish momentum intact.
🔄 Flat open near 54,466 – 54,566 requires patience; breakout/breakdown will define trend.
⚠️ Below 54,213, weakness can intensify toward 54,000.
🕰️ First 30 minutes of price action are critical—observe, then act.
⚠️ Disclaimer
I am not a SEBI-registered analyst . This trading plan is shared purely for educational purposes. Please do your own analysis or consult a financial advisor before taking trades.

BANKNIFTY : Trading levels and plan for 10-Sep-2025BANK NIFTY TRADING PLAN – 10-Sep-2025
(Levels derived from intraday chart zones, resistance/support pivots, and market psychology)
📈 Gap-Up Opening (200+ points above 54,428)
If Bank Nifty opens with a strong gap-up above 54,428, it directly enters a bullish momentum zone.
Sustaining above 54,424 (Last Intraday Resistance) may fuel a rally towards 54,637.
If momentum continues, the next psychological target will be 55,025.
However, rejection near 54,637 could bring a pullback toward 54,424 – 54,300 support band.
👉 Strategy: Avoid chasing the first candle. If price sustains above 54,424 for 30 minutes, long positions can be initiated with a target of 54,637 – 55,025. If rejection occurs, look for a short scalp back to 54,300.
📊 Flat Opening (Around 54,200 – 54,300 zone)
A flat opening near the Opening Resistance/Support (54,300) zone indicates indecision.
If Bank Nifty sustains above 54,300, upside potential is open towards 54,424, and later 54,637.
If it struggles below 54,300, expect weakness toward 54,012 (Opening Support Zone).
Consolidation in this zone may trap both sides initially; hence patience is essential.
👉 Strategy: Let the index stabilize for the first 30 minutes. Enter long only above 54,300 with confirmation, or short below 54,228 if weakness is visible.
📉 Gap-Down Opening (200+ points below 54,028)
If Bank Nifty opens below 54,028, the bias turns negative.
The first downside cushion lies in the Opening Support zone (53,970 – 54,012).
If this breaks, price can extend weakness toward 53,765 – 53,809 (Last Intraday Support).
Sustained breakdown below 53,765 may lead to deeper correction zones near 53,600 levels.
👉 Strategy: Short on breakdowns below 54,012, with profit booking near 53,765 – 53,809 zone. Watch for reversal candles around this support area for potential intraday bounces.
🛡️ Risk Management Tips for Options Traders
⚖️ Always size positions based on capital—avoid over-leveraging during gap openings.
⏳ Wait for confirmation candles (15–30 minutes) before entering trades, especially on gap-ups/downs.
🛑 Use hourly candle close for stop-loss placement to avoid premature exits.
💰 Trail stop-loss to lock profits once the index moves in your favor.
📉 Never average out losing trades in options; instead, cut losses quickly and look for fresh setups.
📌 Summary & Conclusion
✅ Above 54,424, Bank Nifty can rally toward 54,637 – 55,025.
⚠️ Below 54,012, weakness can extend to 53,765 – 53,809.
🔄 A flat start around 54,300 demands patience; breakout/breakdown from this zone will guide direction.
🎯 The first 30 minutes of price action will be critical in defining the trend.
⚠️ Disclaimer
I am not a SEBI-registered analyst . This trading plan is shared for educational purposes only. Please consult your financial advisor or do your own analysis before making any trades.

BANKNIFTY: Trading levels and Plan for 09-Sep-2025BANK NIFTY TRADING PLAN – 09-Sep-2025
📌 Key Levels to Watch :
Major Resistance Zone: 54,550 – 54,636
Upside Extension Resistance: 55,163
Opening Support: 54,037
Last Intraday Support: 53,765
The index is now trading near a decision-making point. Price behavior around the resistance zone and support levels will set the tone for the next move.
🔼 1. Gap-Up Opening (200+ points above 54,636)
If Bank Nifty opens above 54,636, it will open doors for bullish continuation.
📌 Plan of Action :
Sustaining above 54,636 can lead to a strong rally towards 55,163.
If momentum continues, the index may even attempt new highs beyond 55,200+.
Watch for early profit booking near 55,163, as this level could act as a supply zone.
👉 Educational Note: Gap-ups above resistance zones often trap late sellers. But fresh longs should be added only if the price sustains for 15–30 mins above resistance.
➖ 2. Flat Opening (Around 54,200 – 54,300)
A flat start gives traders an opportunity to observe early market sentiment.
📌 Plan of Action :
If Bank Nifty sustains above 54,300, expect a test of the 54,550 – 54,636 resistance zone.
A clean breakout above 54,636 can extend the move towards 55,163.
On the downside, a failure to hold 54,037 (opening support) may drag prices towards 53,765.
👉 Educational Note: Flat openings are ideal for option sellers in the first hour. Buyers should wait for confirmation of breakout/breakdown before initiating trades.
🔽 3. Gap-Down Opening (200+ points below 54,000)
If the index opens sharply lower, bearish momentum may dominate.
📌 Plan of Action :
Immediate support lies at 53,765 (last intraday support).
A breakdown below 53,765 can accelerate selling, targeting 53,500 – 53,400 levels.
However, if Bank Nifty takes support at 53,765 and rebounds strongly, expect a short-covering rally back towards 54,037.
👉 Educational Note: Gap-downs create panic, but seasoned traders wait for a reversal signal near strong support zones to capture short-covering rallies.
🛡️ Risk Management Tips for Options Traders
Always trade with a pre-defined stop-loss on hourly closing basis .
Keep position sizing under control — risk only 1–2% of total capital per trade .
On volatile days, prefer option spreads (bull call spread, bear put spread) over naked options to manage time decay.
Avoid chasing gap-ups or gap-downs blindly; wait for confirmation candles.
Scale out profits near resistance zones like 54,636 and trail stop-losses on remaining positions.
📌 Summary & Conclusion
🟢 Above 54,636 → Bullish trend continuation towards 55,163+ .
🟧 Flat Opening → Range-bound play; above 54,300 bullish, below 54,037 weak .
🔴 Below 54,000 → Bearish momentum, testing 53,765 and possibly lower .
⚠️ Critical Zone: 54,550 – 54,636 (Major Resistance). A clear breakout here will define the bullish trend continuation.
⚠️ Disclaimer: I am not a SEBI-registered analyst. This analysis is purely for educational purposes and should not be considered as financial advice. Please consult your financial advisor before making trading decisions.
BANKNIFTY : Trading levels and Plan for 08-Sep-2025b]BANK NIFTY TRADING PLAN – 08-Sep-2025
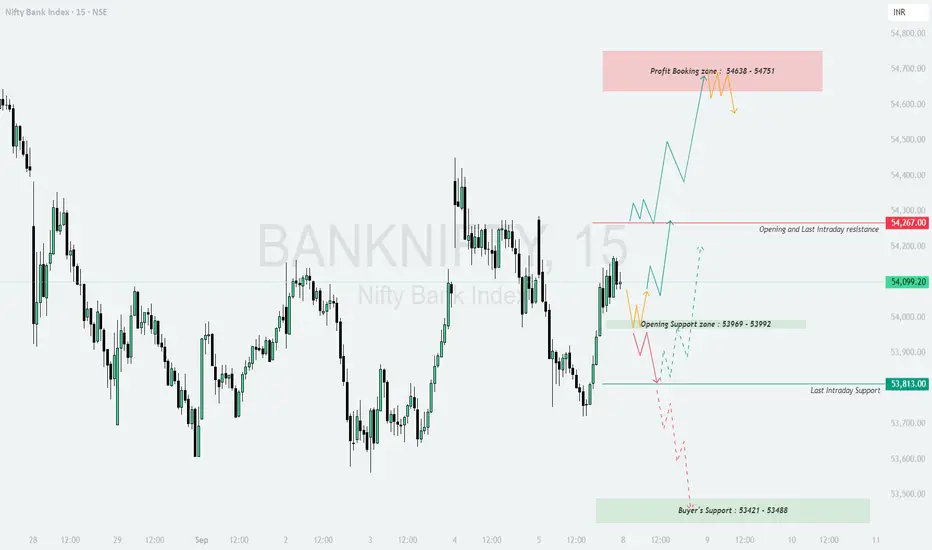
📌 Key Levels to Watch :
Profit Booking Zone: 54,638 – 54,751
Opening & Last Intraday Resistance: 54,267
Opening Support Zone: 53,969 – 53,992
Last Intraday Support: 53,813
Buyer’s Support (Strong Zone): 53,421 – 53,488
The market has entered a sensitive phase where traders need to closely monitor reactions around support and resistance levels.
🔼 1. Gap-Up Opening (200+ points above 54,267)
If Bank Nifty opens with a strong gap-up above 54,267, it directly challenges the resistance zone.
📌 Plan of Action :
Sustaining above 54,267 will invite momentum buying, pushing towards the profit booking zone 54,638 – 54,751.
Traders should be cautious here, as this zone is ideal for partial profit booking or scaling out of longs.
A breakout and sustained move above 54,751 can open room for further upside, but momentum may slow down.
👉 Educational Note: Gap-ups near resistance often face selling pressure. Wait for confirmation candles before chasing a long trade.
➖ 2. Flat Opening (Around 54,000 – 54,150)
A flat opening indicates a balanced market start, offering opportunities both ways.
📌 Plan of Action :
Sustaining above 54,099 – 54,150 will keep the momentum bullish, targeting 54,267.
If price breaks above 54,267, the move can extend towards the profit booking zone.
On the downside, failure to sustain above 54,000 may drag prices to test the opening support zone 53,969 – 53,992.
👉 Educational Note: Flat openings provide the best chance to evaluate market sentiment in the first 30 minutes. Avoid rushing into trades and let price action guide your entries.
🔽 3. Gap-Down Opening (200+ points below 53,900)
A weak opening below 53,900 will bring sellers into control.
📌 Plan of Action :
Initial support lies at 53,813 (last intraday support). A breakdown below this level can drag Bank Nifty towards the buyer’s support zone 53,421 – 53,488.
Expect strong buying attempts from this buyer’s zone. If the rebound holds, it can trigger a sharp pullback rally.
Sustaining below 53,421 will turn the market sentiment bearish, opening deeper downside targets.
👉 Educational Note: Gap-downs often cause emotional selling. Smart traders wait for a retest of supports before entering trades.
🛡️ Risk Management Tips for Options Traders
Always maintain a stop-loss on hourly closing basis to avoid being trapped in intraday volatility.
Avoid aggressive lot sizes on volatile gap-up/gap-down days. Keep risk per trade at 1–2% of capital .
Use option spreads (like bull call spreads or bear put spreads) near resistance/support to manage premium decay.
Never hold out-of-the-money options overnight unless backed by strong conviction.
Book partial profits at key zones like support/resistance and let the rest ride with a trailing stop.
📌 Summary & Conclusion
🟢 Above 54,267 → Bullish bias with targets at 54,638 – 54,751 (profit booking zone) .
🟧 Flat Opening → Watch 54,000 – 54,150 range; above bullish, below weak .
🔴 Below 53,900 → Weakness towards 53,813 & further to 53,421 – 53,488 (buyer’s support zone) .
⚠️ Critical Zone: 54,638 – 54,751 (Profit Booking Zone). Booking profits here is wise before chasing further upside.
⚠️ Disclaimer: I am not a SEBI-registered analyst. This analysis is for educational purposes only and should not be taken as financial advice. Please consult your financial advisor before trading.
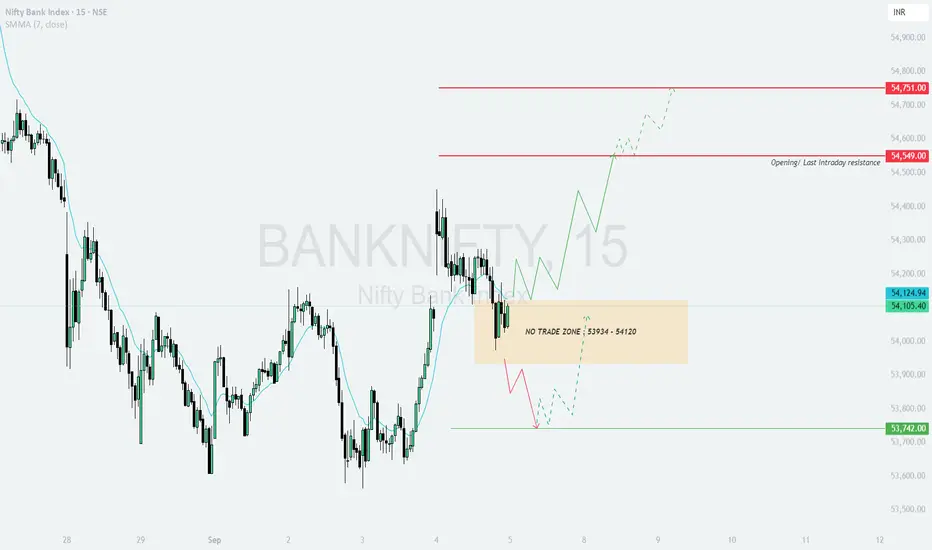
BANKNIFTY : Trading levels and Plan for 05-Sep-2025BANK NIFTY TRADING PLAN – 05-Sep-2025
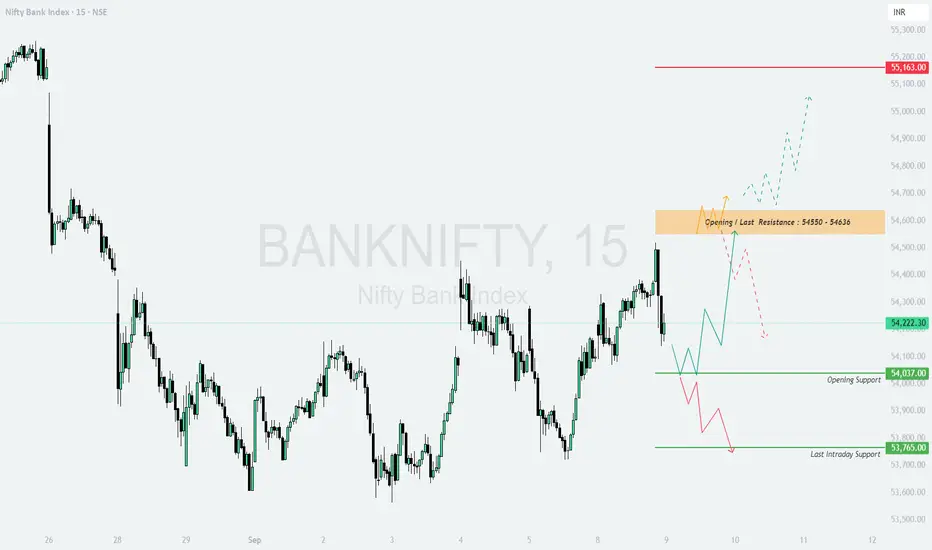
📌 Key Levels to Watch :
No Trade Zone: 53,934 – 54,120
Opening / Last Intraday Resistance: 54,549
Major Resistance: 54,751
Last Intraday Support: 53,742
The highlighted No Trade Zone (53,934 – 54,120) indicates indecision. Traders should wait for a breakout above or breakdown below this range to avoid getting trapped in false moves.
🔼 1. Gap-Up Opening (200+ points above 54,320)
If Bank Nifty opens with a strong gap-up above the No Trade Zone, it will directly test the resistance levels.
📌 Plan of Action :
Sustaining above 54,320 will strengthen the bullish bias.
First target to watch is 54,549, which is both an opening and last intraday resistance.
A clean breakout above 54,549 can fuel momentum towards 54,751, where profit booking may be expected.
👉 Educational Note: Gap-ups near resistance zones often witness volatility. Wait for the first 15–30 minutes to confirm strength before entering trades.
➖ 2. Flat Opening (Around 54,000 – 54,120)
A flat opening around the No Trade Zone suggests caution. The market may consolidate before choosing a direction.
📌 Plan of Action :
If Bank Nifty sustains above 54,120, upside towards 54,549 becomes likely.
A breakout beyond 54,549 may extend towards 54,751.
Failure to hold 54,000 will drag price back into weakness towards 53,742.
👉 Educational Note: Flat openings often provide directional clarity after consolidation. Avoid premature trades inside the No Trade Zone.
🔽 3. Gap-Down Opening (200+ points below 53,742)
If Bank Nifty opens below 53,742, sellers gain control, and downside momentum may accelerate.
📌 Plan of Action :
A gap-down below 53,742 opens room for further selling pressure.
Watch for quick intraday rebounds, but any recovery failing to cross back above 53,934 will remain weak.
Traders should be cautious of sharp volatility as panic selling can occur below major supports.
👉 Educational Note: Gap-downs are often emotional moves. Avoid chasing the fall blindly; wait for a clear pattern or retest before entering.
🛡️ Risk Management Tips for Options Traders
Define a strict stop loss on an hourly close basis to avoid false breakouts.
Never risk more than 1–2% of your trading capital per trade.
Use straddle/strangle adjustments in case of sideways moves around the No Trade Zone.
Exit at partial targets – book half near first resistance/support and trail the rest.
Avoid overtrading during expiry week when premiums decay faster.
📌 Summary & Conclusion
🟢 Above 54,320 → Bullish bias with 54,549 and 54,751 as upside targets .
🟧 Flat Opening in No Trade Zone (53,934 – 54,120) → Wait for breakout before entry .
🔴 Below 53,742 → Bearish momentum, with potential for further downside .
⚠️ Critical Zone: 53,934 – 54,120 (No Trade Zone). Avoid entries here to reduce noise and trap risks.
⚠️ Disclaimer: I am not a SEBI-registered analyst. This analysis is for educational purposes only and not financial advice. Please consult your financial advisor before making any trading decisions.
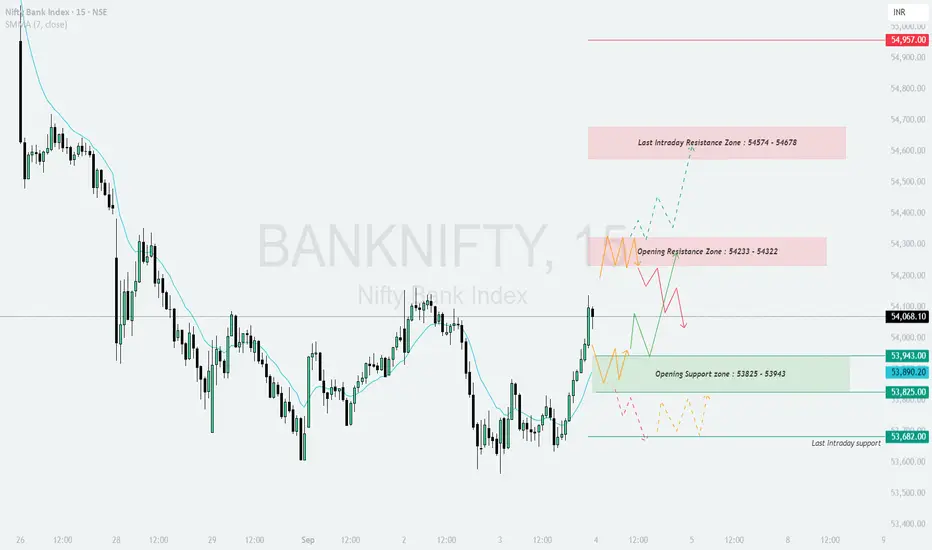
BANKNIFTY : Trading levels and Plan for 04-Sep-2025BANK NIFTY TRADING PLAN – 04-Sep-2025
📌 Key Levels to Watch :
Opening Resistance Zone: 54,233 – 54,322
Last Intraday Resistance Zone: 54,574 – 54,678
Major Resistance: 54,957
Opening Support Zone: 53,825 – 53,943
Last Intraday Support: 53,682
These levels will define intraday trend strength and reversals. Let’s analyze scenarios:
🔼 1. Gap-Up Opening (200+ points above 54,233)
If Bank Nifty opens significantly higher above 54,233, it will enter the resistance zone and buyers will aim to test 54,574 – 54,678.
📌 Plan of Action :
Sustaining above 54,322 can lead to a quick rally towards 54,574 – 54,678.
Booking profits near this zone is advised, as sellers may step in.
If momentum extends, the next target will be 54,957, but only if 54,678 breaks with strength.
👉 Educational Note: Gap-ups near resistance zones can often trap late buyers. Always wait for confirmation before entering fresh longs.
➖ 2. Flat Opening (Around 53,900 – 54,100)
A flat start near current levels indicates balance. Intraday movement will depend on whether support or resistance breaks first.
📌 Plan of Action :
Holding above 53,943 (Opening Support) can push price towards 54,233 – 54,322 (Resistance Zone).
A breakout above this zone may open the path to 54,574 – 54,678.
If price slips below 53,825, weakness can extend towards 53,682.
👉 Educational Note: Flat openings often provide the cleanest intraday trends once the first 30 minutes establish direction.
🔽 3. Gap-Down Opening (200+ points below 53,825)
If Bank Nifty opens weak below 53,825, sellers will take control, with supports coming into play.
📌 Plan of Action :
A gap-down below 53,825 increases probability of a slide towards 53,682 (Last Intraday Support).
If 53,682 breaks, the downside can intensify with sharp selling.
Any bounce from this zone should be treated cautiously unless price regains 53,825 – 53,943.
👉 Educational Note: Gap-downs can trigger panic selling, but experienced traders should watch for reversal patterns near strong supports.
🛡️ Risk Management Tips for Options Traders
Always place stop losses based on hourly close.
Limit risk to 1–2% of trading capital per position.
Scale out profits – exit part at first target, hold balance for extended moves.
Avoid over-leveraging in weekly expiry days to reduce volatility risk.
When uncertainty is high, prefer spreads (Bull Call / Bear Put) over naked options.
📌 Summary & Conclusion
🟢 Above 54,233 → Upside towards 54,574 – 54,678, extended 54,957 .
🟧 Flat Opening → Range-bound between 53,825 – 54,322; breakout will decide direction .
🔴 Below 53,825 → Weakness towards 53,682 and possibly lower .
⚠️ Key Pivot Zone: 53,825 – 53,943 will act as the critical battleground for bulls and bears.
⚠️ Disclaimer: I am not a SEBI-registered analyst. This trading plan is for educational purposes only and should not be treated as financial advice. Please consult your financial advisor before making trading decisions.
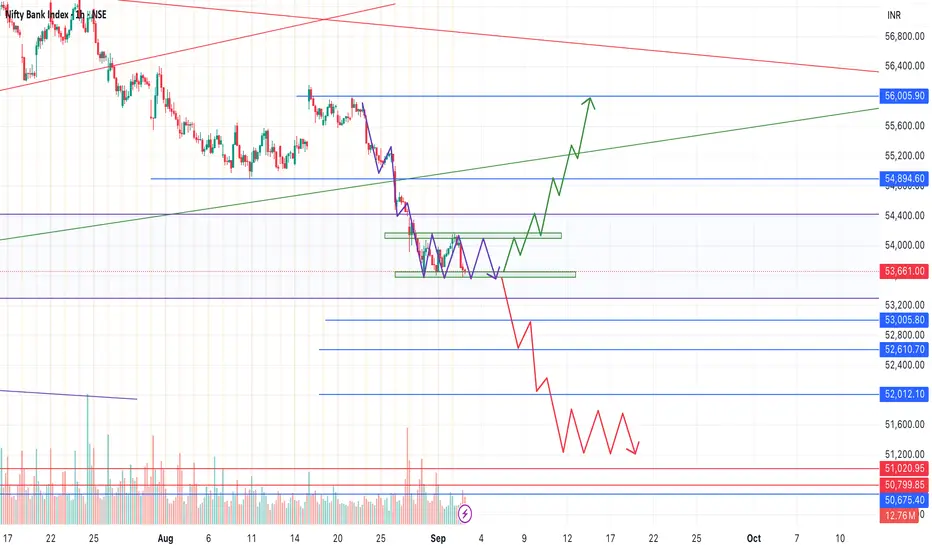
BankNifty - 1 Hour chart. BankNifty - 1 hour chart.
Current phase there will be consolidation. so any side it can give breakout.
I have added downside movement and top side movement targets where Bank Nifty can go.
You can follow chart with the level and trade accordingly.
BANKNIFTY : Trading levels and Plan for 03-Sep-2025BANK NIFTY TRADING PLAN – 03-Sep-2025
📌 Key Levels to Watch :
Opening Resistance: 53,868
Last Intraday Resistance: 54,037
Major Resistance Zone: 54,233 – 54,319
Opening Support Zone: 53,454 – 53,537
Last Intraday Support: 53,204
These zones will act as turning points where price reactions are expected. Let’s break it down scenario-wise.
🔼 1. Gap-Up Opening (200+ points above 54,037)
If Bank Nifty opens sharply higher above 54,037, momentum could continue towards the Resistance Zone 54,233 – 54,319.
📌 Plan of Action :
Sustaining above 54,037 can invite bullish momentum, targeting 54,233 – 54,319.
Profit booking may occur at the upper band of resistance (54,319), so be cautious near this zone.
If price fails to sustain and falls back below 54,037, weakness may drag it toward 53,868 again.
👉 Educational Note: In strong gap-ups, waiting for a pullback to support before entering is safer than chasing highs.
➖ 2. Flat Opening (Around 53,627 – 53,775)
A flat start near current levels signals indecision; market participants will watch for breakout from support/resistance.
📌 Plan of Action :
Sustaining above 53,775 could push price towards 53,868 → 54,037.
If unable to hold above 53,627, expect a retest of the Opening Support Zone (53,454 – 53,537).
Avoid over-trading inside this choppy band; wait for clean breakouts or breakdowns.
👉 Educational Note: Flat openings usually lead to sideways action early in the session; patience helps filter false signals.
🔽 3. Gap-Down Opening (200+ points below 53,454)
If Bank Nifty opens weak below the Opening Support Zone, sellers may dominate.
📌 Plan of Action :
A gap-down below 53,454 could test 53,204 (Last Intraday Support).
If 53,204 holds, a relief bounce towards 53,454 – 53,537 may occur.
A breakdown below 53,204 would intensify selling pressure, potentially opening the way for deeper downside.
👉 Educational Note: In gap-down situations, avoid aggressive longs unless strong reversal signals appear.
🛡️ Risk Management Tips for Options Traders
Stick to a strict stop loss on hourly close to avoid deep drawdowns.
Risk only 1–2% of capital per trade.
Book partial profits at nearby resistance/support to secure gains.
Avoid chasing trades in the middle of the zone; best trades occur at breakouts or bounces from key levels.
Use option spreads (Bull Call or Bear Put) to hedge against volatility and theta decay.
📌 Summary & Conclusion
🟢 Above 54,037 → Upside targets 54,233 – 54,319 .
🟧 Flat Opening → Watch 53,775 / 53,868 for upside, 53,454 zone for downside .
🔴 Below 53,454 → Weakness towards 53,204; breakdown may extend bearish move .
⚠️ Key Battle Zone: 53,454 – 53,537 (Opening Support Zone).
⚠️ Disclaimer: I am not a SEBI-registered analyst. This analysis is purely for educational purposes and should not be considered investment advice. Please consult your financial advisor before trading.

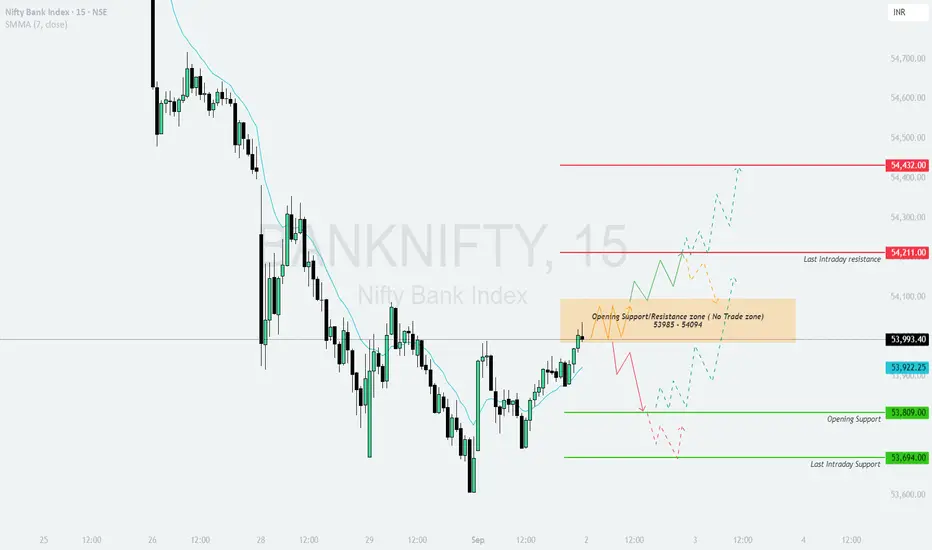
BANKNIFTY : Trading levels and plan for 02-Sep-2025BANK NIFTY TRADING PLAN – 02-Sep-2025
📌 Key Levels to Watch :
No Trade Zone (Opening Support/Resistance): 53,985 – 54,094
Last Intraday Resistance: 54,211
Major Resistance Above: 54,432
Opening Support: 53,809
Last Intraday Support: 53,694
These levels act as reaction points where traders should expect volatility and directional cues.
🔼 1. Gap-Up Opening (200+ points above 54,094)
If Bank Nifty opens significantly above the No Trade Zone, bulls may attempt to take control.
📌 Plan of Action :
Sustaining above 54,211 (last intraday resistance) can trigger further momentum.
The next upside target will be 54,432, where profit booking pressure could arise.
If price fails to sustain above 54,094 and slips back into the No Trade Zone, expect consolidation and choppy action.
👉 Educational Note: Gap-up openings often result in high option premiums. Instead of chasing, wait for a retest of support or consolidation before entering directional trades.
➖ 2. Flat Opening (Around 53,950 – 54,050)
If the market opens flat within the No Trade Zone (53,985 – 54,094), traders must exercise patience.
📌 Plan of Action :
Avoid trading immediately in the No Trade Zone as false signals are common.
A breakout above 54,094 with strong volume may lead to a move towards 54,211 – 54,432.
A breakdown below 53,985 will shift focus towards 53,809 (opening support).
👉 Educational Note: Flat openings are best approached with discipline. Let the market give clear confirmation before committing to a direction.
🔽 3. Gap-Down Opening (200+ points below 53,809)
If Bank Nifty opens lower, it will test key supports quickly.
📌 Plan of Action :
A gap-down below 53,809 directly exposes the market to test 53,694 (last intraday support).
Buyers may attempt a pullback from 53,694, making it a possible intraday reversal zone.
A decisive break below 53,694 will weaken sentiment further and can accelerate downside momentum.
👉 Educational Note: Gap-downs create panic moves. Avoid chasing shorts at lows; instead, look for pullbacks to resistance zones to enter with better risk/reward.
🛡️ Risk Management Tips for Options Traders
Always trade with a defined stop loss based on hourly close.
Risk only 1–2% of capital per trade.
Use option spreads (like Bull Call or Bear Put) instead of naked buying in volatile markets.
Scale out of trades at important resistance/support zones.
Avoid trading within the No Trade Zone (53,985 – 54,094) where whipsaws are likely.
📌 Summary & Conclusion
🟢 Above 54,211 → Upside momentum towards 54,432 possible .
🟧 Flat Opening → Avoid trades in 53,985 – 54,094 (No Trade Zone), wait for breakout/breakdown .
🔴 Below 53,809 → Weakness towards 53,694; below that, expect further downside .
⚠️ Key Battle Zone: 53,985 – 54,094 (No Trade Zone).
⚠️ Disclaimer: I am not a SEBI-registered analyst. This analysis is shared purely for educational purposes and should not be considered as investment advice. Please consult your financial advisor before trading.
BANKNIFTY : Trading levels and plan for 01-Sep-2025💼 BANK NIFTY TRADING PLAN – 01-Sep-2025
📌 Key Levels to Watch :
Opening Resistance Zone: 53,844
Last Intraday Resistance: 53,982
Sideways Resistance Zone: 54,142 – 54,214
Opening Support: 53,466
Buyer’s Zone for Reversal: 53,204 – 53,466
Last Intraday Support: 53,204
These levels will serve as reaction zones where market participants are likely to show strong activity.
🔼 1. Gap-Up Opening (200+ points above 53,844)
If Bank Nifty opens with a significant gap-up above 53,844, bullish traders will have the upper hand.
📌 Plan of Action :
Sustaining above 53,982 (last intraday resistance) can lead to a quick rally.
Upside targets will be 54,142 – 54,214 (sideways resistance zone) where profit booking pressure may arise.
Failure to hold above 53,844 can invite a retracement back toward 53,692 (current reference).
👉 Educational Note: Gap-up moves often look attractive, but chasing high premiums in options can be risky. Waiting for a retest of support levels gives safer entry points.
➖ 2. Flat Opening (Around 53,650 – 53,750)
If the index opens flat near its current zone, price behavior around 53,844 (opening resistance) will decide the trend.
📌 Plan of Action :
Sustaining above 53,844 can take Bank Nifty towards 53,982 and eventually 54,142 – 54,214.
If rejected from 53,844, price could slip back toward 53,466 (opening support).
A break below 53,466 will drag the index into the Buyer’s Zone (53,204 – 53,466), where intraday reversal attempts may happen.
👉 Educational Note: Flat openings provide balanced opportunities—traders should observe first 30 minutes to gauge real strength before taking directional trades.
🔽 3. Gap-Down Opening (200+ points below 53,466)
If Bank Nifty opens sharply lower, it will directly test the Buyer’s Reversal Zone (53,204 – 53,466).
📌 Plan of Action :
Aggressive buyers may defend 53,204 – 53,466, making this zone a potential reversal area.
If 53,204 holds, a recovery towards 53,466 and 53,692 is possible.
A decisive breakdown below 53,204 (last intraday support) can accelerate selling pressure and lead to extended downside.
👉 Educational Note: Gap-downs bring panic—avoid shorting at extreme lows; instead, watch for retracements to enter with better risk/reward.
🛡️ Risk Management Tips for Options Traders
Use hourly close-based stop losses instead of small tick-based stops.
Risk only 1–2% of trading capital per trade.
In volatile moves, prefer option spreads (Debit/Credit spreads) over naked buying.
Scale out profits at key zones like resistance or support—don’t wait for exact tops/bottoms.
Avoid overtrading during sideways phases; wait for clear breakouts/breakdowns.
📌 Summary & Conclusion
🟢 Above 53,982 → Upside momentum towards 54,142 – 54,214 .
🟧 Flat Opening → Watch 53,844 as pivot; above bullish, below cautious .
🔴 Below 53,466 → Weakness towards Buyer’s Reversal Zone (53,204 – 53,466) .
⚠️ Critical battle zones: 53,844 (resistance) & 53,466 (support).
⚠️ Disclaimer: I am not a SEBI-registered analyst. This analysis is shared only for educational purposes and should not be considered investment advice. Please consult your financial advisor before trading.

BANKNIFTY : Trading levels and Plan for 29-Aug-2025💼 BANK NIFTY TRADING PLAN – 29-Aug-2025
📌 Key Levels to Watch :
Opening Resistance Zone: 54,076 – 54,184
Last Intraday Resistance: 54,246
Major Resistance Above: 54,511
Opening Support Zone: 53,669 – 53,767
Last Intraday Support: 53,460
Major Support Below: 53,204
These levels represent intraday turning points where buyers or sellers may step in aggressively.
🔼 1. Gap-Up Opening (200+ points above 54,184)
If Bank Nifty opens with a strong gap above 54,184, bullish momentum is likely.
📌 Plan of Action :
Sustaining above 54,246 (last intraday resistance) may fuel upside towards 54,511, which is the next hurdle for bulls.
Partial profit booking is advisable near 54,511, as it could trigger a pullback.
If the index fails to sustain above 54,246, it may slip back into the 54,076–54,184 resistance band, indicating possible rangebound price action.
👉 Educational Note: On big gap-ups, avoid chasing the first 15 minutes. Wait for a retest of support before entering long trades.
➖ 2. Flat Opening (Around 53,669 – 53,767 Support Zone)
If Bank Nifty opens flat within the opening support band, the market will look for fresh direction.
📌 Plan of Action :
Holding above 53,767 can invite buying, targeting 54,076 → 54,246.
Failure to hold above 53,669 may push the index back towards 53,460, opening the door for more weakness.
Traders should avoid over-leveraging in this consolidation zone, as false breakouts are common.
👉 Educational Note: Flat openings usually demand patience. Allow price to test both sides of support/resistance before committing to a trade.
🔽 3. Gap-Down Opening (200+ points below 53,460)
If Bank Nifty opens with a sharp gap below 53,460, bearish control will likely continue.
📌 Plan of Action :
Below 53,460, the index can slide further towards 53,204 (major support).
The 53,204 zone is critical; strong buying wicks here may signal a reversal opportunity.
If 53,204 breaks decisively, expect extended downside momentum, so shorts can be trailed aggressively.
👉 Educational Note: Gap-down openings often trigger panic. Avoid emotional trades—stick to levels and wait for clear breakdown confirmations.
🛡️ Risk Management Tips for Options Traders
Risk only 1–2% of trading capital per trade.
Use hourly candle close stop-losses for confirmation instead of reacting to noise.
On high-volatility days, prefer spreads (Bull Call/Bear Put) over naked options.
Book profits in tranches, don’t wait for exact targets.
Keep an eye on India VIX to gauge premium decay and volatility risk.
📌 Summary & Conclusion
🟢 Above 54,246 → Upside towards 54,511 (profit booking zone) .
🟧 Flat near 53,669–53,767 → Wait for breakout, either to 54,246 or 53,460 .
🔴 Below 53,460 → Weakness towards 53,204 (critical support) .
🎯 The battle zone: 53,669–53,767 opening support will decide intraday momentum.
⚠️ Disclaimer: I am not a SEBI-registered analyst. This trading plan is prepared purely for educational purposes and should not be treated as investment advice. Please do your own research or consult a financial advisor before trading.

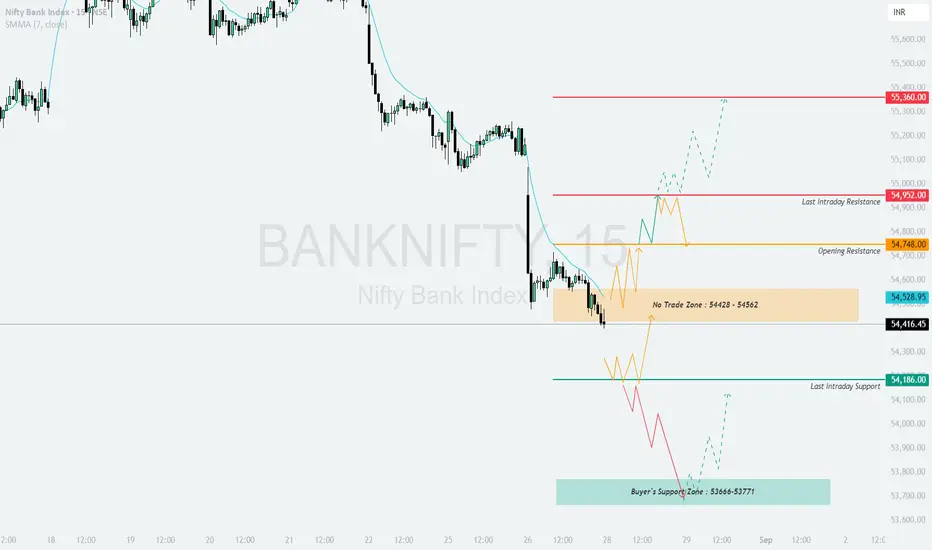
BANKNIFTY : Trading levels and Plan for 28-Aug-2025💼 BANK NIFTY TRADING PLAN – 28-Aug-2025
📌 Key Levels to Watch :
Opening Resistance: 54,748
Last Intraday Resistance: 54,952
Major Resistance Above: 55,360
No-Trade Zone: 54,428 – 54,562
Last Intraday Support: 54,186
Buyer’s Support Zone: 53,666 – 53,771
These levels act as decision-making zones for intraday setups.
🔼 1. Gap-Up Opening (200+ points above 54,748)
If Bank Nifty opens above 54,748, early strength will be visible.
📌 Plan of Action :
Sustaining above 54,952 (Last Intraday Resistance) can push the index towards 55,360, which will act as a major resistance and profit booking zone.
Failure to hold above 54,952 may drag prices back to retest 54,748 support, giving rangebound moves.
A breakout above 55,360 should be traded cautiously with partial booking at higher levels.
👉 Educational Note: On strong gap-ups, always avoid chasing; instead, wait for price retests near support to manage risk better.
➖ 2. Flat Opening (Around 54,428 – 54,562 No-Trade Zone)
A flat start near the No-Trade Zone means price is indecisive.
📌 Plan of Action :
If Bank Nifty sustains above 54,748, buyers may take it towards 54,952 → 55,360.
If it slips below 54,428, selling pressure may drag it down to 54,186 support.
Avoid aggressive trading inside the no-trade band (54,428 – 54,562), as it can trigger false breakouts.
👉 Educational Note: Flat openings require patience. Allow 30 minutes for trend clarity before entering trades.
🔽 3. Gap-Down Opening (200+ points below 54,186)
If Bank Nifty opens below 54,186, bearish momentum will dominate.
📌 Plan of Action :
Below 54,186, price can slide quickly towards 53,666 – 53,771 Buyer’s Zone.
Watch carefully for reversals in the buyer’s zone; if sustained, a recovery bounce can emerge.
If the buyer’s zone breaks with volume, deeper weakness may continue.
👉 Educational Note: On gap-down days, trend-following trades work better than reversal attempts. Wait for retests before shorting.
🛡️ Risk Management Tips for Options Traders
Risk only 1–2% of capital per trade.
Use hourly close stop-loss for directional moves.
Prefer spreads (Bull Call / Bear Put) on gap days to minimize premium decay.
Do not trade aggressively in the No-Trade Zone (54,428 – 54,562).
Monitor Bank Nifty PCR & India VIX to gauge sentiment and volatility.
📌 Summary & Conclusion
🟢 Above 54,952 → Possible upside to 55,360 .
🟧 Flat near 54,428–54,562 → Avoid trades until breakout .
🔴 Below 54,186 → Downside towards 53,666–53,771 .
🎯 Key Decision Zone: 54,428 – 54,562 (No-Trade Zone) will guide the trend.
⚠️ Disclaimer: I am not a SEBI-registered analyst. This trading plan is purely for educational purposes and should not be considered financial advice. Please consult a financial advisor before making trading or investment decisions.
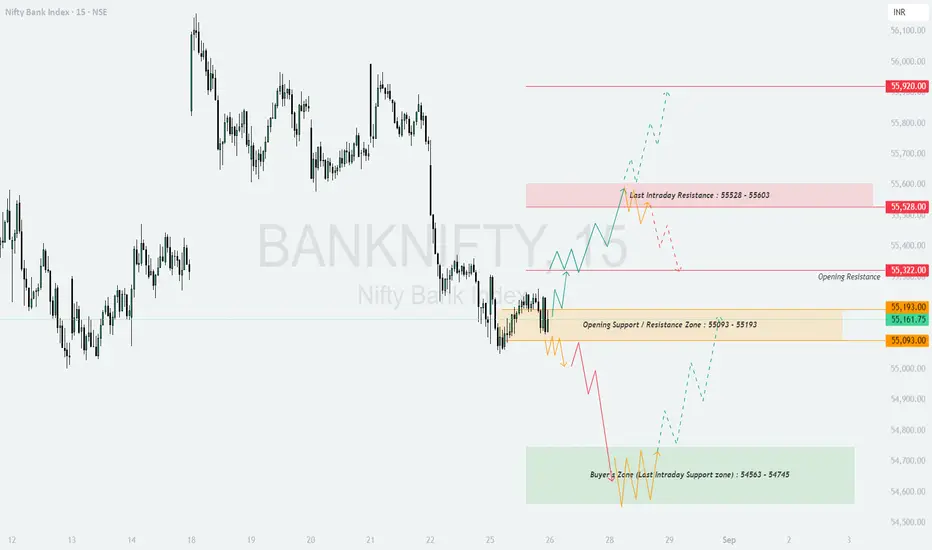
BANKNIFTY : Trading levels and plan for 26-Aug-2025📊 BANK NIFTY TRADING PLAN – 26-Aug-2025
The price action on 25-Aug-2025 has defined critical levels for the next trading session. The Opening Support/Resistance Zone is 55,093 – 55,193, with key upside resistances at 55,322 and 55,528–55,603, while the strong downside support remains in the 54,563 – 54,745 Buyer’s Zone.
Let’s analyze the trading plan for all opening scenarios.
🔼 1. Gap-Up Opening (200+ Points Above 55,322)
If Bank Nifty opens above 55,322, it enters the bullish territory, testing the “Opening Resistance” directly.
📌 Plan of Action:
Watch if the price sustains above 55,322 for 15–30 minutes. Sustaining here will attract buying momentum.
Next target would be the Last Intraday Resistance zone 55,528–55,603.
If momentum continues and buyers hold above 55,603, extension towards 55,920 is possible.
If the index fails to hold above 55,322, then profit booking may pull it back toward 55,193 – 55,093 zone for retesting.
Risk note: Do not chase calls aggressively after a big gap-up 🚫. Always prefer entering on dips toward support for safer risk–reward.
➖ 2. Flat Opening (Around 55,093–55,193)
A flat opening around the Opening Support/Resistance Zone will be a balanced case where the market decides the next trend based on initial strength.
📌 Plan of Action:
If price sustains above 55,193, it can gradually move higher towards 55,322 → 55,528–55,603.
Failure to hold above 55,093 will invite selling pressure and drag the index towards the Buyer’s Zone (54,745–54,563).
First 30 minutes are crucial — let the market structure develop before entering trades to avoid false breakouts.
Risk note: Use hedged option strategies like Bull Call Spreads or Iron Condors if volatility is high. This helps reduce premium decay risk.
🔽 3. Gap-Down Opening (200+ Points Below 54,950)
A sharp gap-down below 55,000 would put pressure on bulls and may activate the Buyer’s Zone.
📌 Plan of Action:
If Bank Nifty opens below 55,000 and fails to reclaim 55,093, then the downside target becomes 54,745 – 54,563.
A bounce from the Buyer’s Zone can give scalping opportunities on the long side, but only with strict stop-loss.
If even 54,563 breaks, expect further downside expansion. Option writers may benefit from selling Calls.
Risk note: After a gap-down, avoid panic entries 🚦. Wait for retests of broken levels before confirming trend direction.
🛡️ Risk Management Tips for Options Traders
Never risk more than 1–2% of capital on a single trade.
Avoid trading immediately in the first 5 minutes after open; let volatility cool down.
Always maintain stop-losses in both futures and options.
Prefer spreads (Bull Call / Bear Put) over naked positions to control risk.
Remember: Protecting capital is more important than chasing every move. 💡
📌 Summary & Conclusion
🟢 Above 55,322 → 55,528–55,603 → 55,920 possible.
🟧 Flat near 55,093–55,193 = decision zone, wait for breakout/breakdown.
🔴 Below 55,093 → 54,745–54,563 Buyer’s Zone will be tested.
Key pivot: 55,093–55,193 zone.
⚠️ Disclaimer: I am not a SEBI-registered analyst. This analysis is purely for educational purposes and should not be considered financial advice. Please consult a financial advisor before making trading/investment decisions.
BANKNIFTY : Trading levels for 25-Aug-2025BANK NIFTY TRADING PLAN – 25-Aug-2025
📊 The market is at a decisive zone where price action around the 55,168 support–resistance pivot will guide the day’s direction. With clear intraday resistance at 55,528–55,687 and strong support around 54,563–54,745, let’s break down the trading plan for all three possible opening scenarios.
🔼 1. Gap-Up Opening (200+ Points Above 55,528)
If Bank Nifty opens above 55,528, it directly enters the “Opening Resistance Zone.” Such gaps often trigger profit booking in the early minutes, as traders who carried long positions may book profits.
📌 Plan of Action:
Wait for the first 15–30 minutes to see whether price sustains above 55,528.
If sustained, expect a rally towards the Last Intraday Resistance 55,687 and further into the target zone of 55,954–56,061.
However, if the index fails to sustain and slips back below 55,528, a quick retracement toward 55,168 may occur.
Risk note: Do not chase aggressive calls after a sharp gap-up. Instead, wait for pullbacks to key levels for a favorable risk–reward entry.
➖ 2. Flat Opening (Around 55,150–55,250)
A flat start around 55,168 will be the most balanced case, where both bulls and bears will have opportunities depending on who gains control first.
📌 Plan of Action:
If Bank Nifty sustains above 55,168 with strong buying, expect an upward move toward 55,528. A breakout above this resistance can open the way to 55,687 and eventually 55,954–56,061.
On the contrary, if price fails to hold 55,168 and slips below, selling pressure may drag it toward 54,745–54,563 (Last Intraday Support Zone).
Traders should closely monitor the first 30 minutes’ structure to avoid false breakouts.
Risk note: Options traders can use spreads (Bull Call Spread / Bear Put Spread) instead of naked buying to reduce theta decay and premium risk.
🔽 3. Gap-Down Opening (200+ Points Below 54,950)
A sharp gap-down below 55,000 may lead to panic selling, especially if global cues are weak.
📌 Plan of Action:
If the index opens below 55,000 and fails to reclaim 55,168, expect selling to intensify toward the 54,745–54,563 support zone.
If the support zone holds, intraday pullbacks are possible — traders may look for quick scalps on the long side but with strict stop-losses.
A breakdown below 54,563 will open deeper downside levels, creating opportunities for option writers on the short side.
Risk note: After a gap-down, avoid panic selling at open. Allow the index to retest broken levels — failed retests often provide high-probability trades.
📌 Risk Management Tips for Options Traders
Always trade with a defined stop-loss — never average into a losing trade.
Avoid trading in the first 5 minutes after a big gap; let volatility settle.
Position sizing is key — never risk more than 1–2% of total capital on a single trade.
Use hedged strategies like spreads instead of naked positions when IV (implied volatility) is high.
Remember, missing a trade is better than forcing a wrong trade. Patience pays.
📊 Summary & Conclusion
🟢 Sustaining above 55,528 opens doors to 55,687 → 55,954–56,061.
🟧 Flat opening near 55,168 makes it a decision zone for either breakout or breakdown.
🔴 Below 55,168, weakness may drag Bank Nifty toward 54,745–54,563.
Key pivot for the day: 55,168.
⚠️ Disclaimer: I am not a SEBI-registered analyst. The above analysis is for educational purposes only. Please do your own research or consult a financial advisor before making any trading decisions.

BANKNIFTY : Trading plan and levels for 22-Aug-2025📌 BankNifty Trading Plan for 22-Aug-2025
Key Levels from Chart:
Opening Resistance → 55,849
Opening Support Zone → 55,622 – 55,697
Last Intraday Resistance Zone → 56,097 – 56,135
Last Intraday Support Zone → 55,334 – 55,395
Downside Target Support → 55,174
Previous Close → 55,733.90
🚀 Scenario 1: Gap Up Opening (200+ points above previous close)
If BankNifty opens around 55,950+, buyers will dominate the initial sentiment.
The first major hurdle is Opening Resistance at 55,849. If sustained above, momentum can quickly test 56,097 – 56,135 (Last Intraday Resistance Zone).
A clean breakout above 56,135 can push the index toward 56,355 (Profit Booking Zone).
However, failure near resistance could cause intraday profit booking, dragging it back toward the 55,849 retest zone.
💡 Plan of Action : Go long only above 55,849 with confirmation. Trail stop-loss below 55,697. Book partial profits near 56,135 and tighten stops beyond that. Avoid chasing if price struggles near resistance.
📊 Scenario 2: Flat Opening (within ±100 points of 55,734)
Flat openings often lead to sideways choppiness around support and resistance zones.
If price sustains above 55,849, bullish momentum may extend toward 56,097 – 56,135.
Failure to break 55,849 and slipping below 55,622 – 55,697 (Opening Support Zone) will invite weakness.
Breakdown below 55,622 can accelerate selling toward 55,334 – 55,395 (Last Intraday Support Zone).
💡 Plan of Action : Avoid trading inside 55,622 – 55,849 chop zone. Wait for breakout: long above 55,849 or short below 55,622 for clear momentum trades.
⚠️ Scenario 3: Gap Down Opening (200+ points below previous close)
If BankNifty opens near 55,500 or below, bearish sentiment will dominate.
Immediate cushion lies at 55,334 – 55,395 (Last Intraday Support Zone). Breakdown below this zone can drag the index toward 55,174 strong support.
If 55,334 holds, expect a relief bounce back toward 55,622 zone.
Be cautious of false breakdowns, as gap-downs often lead to short-covering rallies.
💡 Plan of Action : Go short only if 55,334 breaks with volume, keeping SL above 55,395. For long scalps, wait for bullish reversal patterns near 55,334 before targeting 55,622.
📌 Risk Management Tips for Options Traders 💡
Use hedged strategies like spreads or straddles in high volatility instead of naked buying.
Place strict stop-losses on option premiums – don’t average losing positions.
Respect the 2% rule → risk only 2% of total capital per trade.
Avoid overtrading inside congestion zones; wait for directional clarity.
Trail your profits and book partials near resistance/support zones 🎯.
📝 Summary & Conclusion
Above 55,849, targets are 56,097 – 56,135, then 56,355 🚀.
Between 55,622 – 55,849, sideways choppiness likely ⚖️ – avoid trades.
Below 55,622, weakness toward 55,334 – 55,395, and if broken → 55,174 ⚠️.
👉 The day will be trend-driven outside the support/resistance zones. Discipline and patience are key to avoid false moves.
⚠️ Disclaimer
I am not a SEBI registered analyst. This trading plan is shared purely for educational purposes . Please consult with your financial advisor before making trading or investment decisions.

A possible Head and Shoulder formation in BankniftyChance of a head and shoulder formation on the hourly chart of the Index.
If the market clears the resistance line around 57300, it can form another high or test the recent high made.
On the lower side, there is are support and it may respect the support levels.
Major support levels :- 56800, 56640
Resistance levels :- 57285, 57600
Wait for the market to move above the neck line for any bullish trade to enter in the index. Else bearish trade can be initiated below 56650 levels.
Watch for the price action near the price levels before entering the trade.

Banknifty Swing AnalysisBank nifty potentially is in a corrective wave, the downside forecast has been marked. Currently it is still in wave A. If wave A is impulsive and current rally lacks momentum/divergent on RSI, then it's likely wave B. This bull trap could lure traders thinking a new uptrend has begun, only to be followed by wave C collapse.

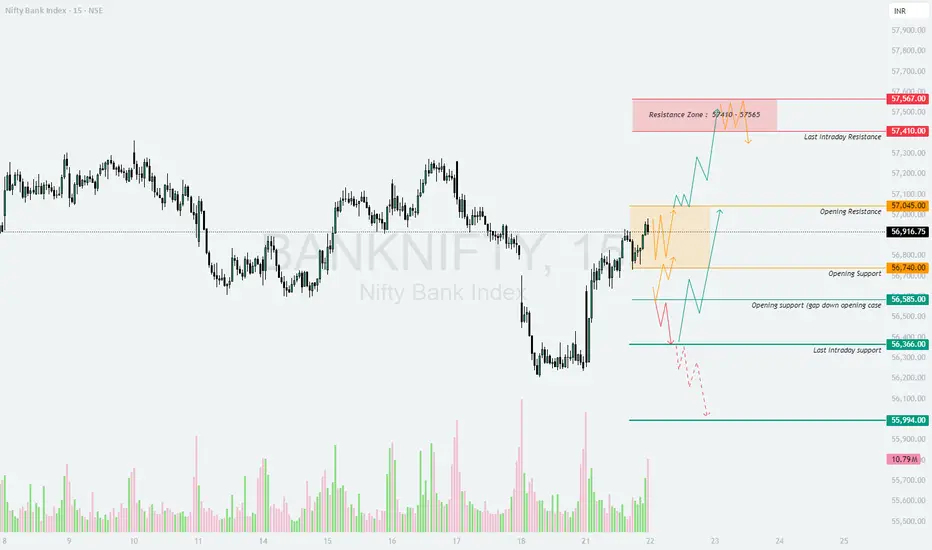
BANKNIFTY - Trading levels and Plan for 22-July-2025📊 BANKNIFTY TRADING PLAN – 22-July-2025 📊
🔍 Market Context:
Bank Nifty closed at 56,916.75, forming a consolidation just below the resistance zone. Price action near the Opening Support (56,740) and Opening Resistance (57,045) will be crucial to watch. Depending on the type of market open, plan your trades with precision and discipline.
📈 GAP-UP OPENING (➕200+ points above 57,100)
In case of a gap-up opening above the Opening Resistance Zone (57,045–57,100), Bank Nifty may directly move into the Supply Zone (57,410–57,567).
Plan of Action:
Wait for the index to hit 57,410–57,565 supply zone.
Look for reversal candles or rejection wicks on lower timeframes (5/15-min) to consider shorting with tight SL above 57,567.
Targets: 57,045 > 56,740 > 56,585
Avoid fresh long trades until a decisive breakout and retest above 57,567.
📘 Educational Note: Never buy straight into a supply zone after a gap-up. Wait for price action confirmation.
📉 Option Strategy: Ideal for Bearish Put Spreads or Intraday ATM/ITM Put Buying near reversal.
📊 FLAT OPENING (within 56,740–57,045)
If Bank Nifty opens flat, expect consolidation or a breakout from the opening box zone.
Plan of Action:
Bullish Setup: If price sustains above 57,045 with strong volume, consider longs.
➤ Targets: 57,410–57,567
Bearish Setup: If price breaks below 56,740, then
➤ Targets: 56,585 > 56,366
📘 Educational Note: Avoid trading in the first 15–30 mins unless clear direction is seen. Let the range settle.
🧠 Discipline Tip: Follow “If-This-Then-That” logic; don’t preempt movement inside the range.
📉 GAP-DOWN OPENING (➖200+ points below 56,700)
A gap-down opening near or below 56,585 or 56,366 may attract panic selling or quick recovery.
Plan of Action:
Below 56,585, watch for 5–15 min candle close. If sustained below 56,366, expect downside till 55,994
If price reclaims 56,740, look for a pullback rally.
Conservative buyers should wait for reclaim of 56,740 with strength before going long.
📘 Educational Note: Panic lows after gap-downs often lead to sharp reversals. Let price prove its strength first.
📉 Option Strategy: Use ITM Put Options or Bearish Call Spreads. Avoid OTM chases post-move.
🛡️ Risk Management & Options Tips:
Always define SL on 15-min or hourly candle close.
Never risk more than 1–2% of your capital per trade.
Avoid trading both sides in volatile markets; stick to the breakout direction.
Avoid buying cheap OTM options post-breakout — prefer ATM/ITM with momentum.
Protect profits by trailing SL or booking in tranches.
📌 Summary & Key Levels:
🔴 Resistance Zone: 57,410–57,567
🟧 Opening Resistance: 57,045
🟨 Opening Support: 56,740
🟦 Gap Support (gap-down): 56,585
🟫 Last Support: 56,366 > 55,994
📢 Conclusion:
22-July could be a decisive session for Bank Nifty as it approaches a critical resistance band. React to price—not predictions. Stay disciplined, don’t overtrade, and adjust to opening scenarios for optimal risk-reward setups.
⚠️ Disclaimer: I am not a SEBI registered analyst. This analysis is for educational purposes only. Please consult your financial advisor before taking any trading decisions.
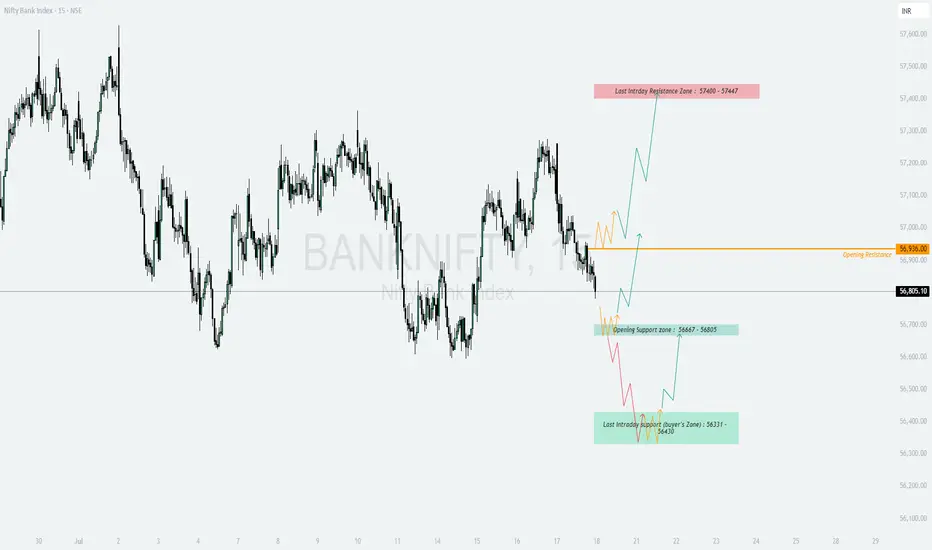
BANKNIFTY - Trading levels and Plan for 18-Jul-2025📊 BANK NIFTY INTRADAY TRADING PLAN – 18-Jul-2025
Gap Opening Reference: 200+ Points Considered Significant
📍 IMPORTANT LEVELS TO MONITOR
🟥 Last Intraday Resistance Zone: 57,400 – 57,447
🟧 Opening Resistance: 56,936
🟩 Opening Support Zone: 56,667 – 56,605
🟢 Last Intraday Support (Buyer’s Zone): 56,331 – 56,430
🚀 SCENARIO 1: GAP-UP OPENING (Above 57,136) 📈
(Gap opening considered above 200+ points from the previous close)
If Bank Nifty opens above 57,136 , strength is expected toward Last Intraday Resistance Zone: 57,400 – 57,447 .
Avoid buying immediately after the opening candle; allow 15–30 minutes for price confirmation and volatility settlement.
If price sustains above 57,400 , upside momentum may continue, but consider trailing your stop-loss as this is an exhaustion zone.
Options Tip: Consider ATM or slightly OTM Call Options or Bull Call Spread setups for controlled risk.
📊 SCENARIO 2: FLAT OPENING (Between 56,667 – 56,936) ⚖️
This range marks the equilibrium between buyers and sellers, as defined by Opening Support Zone and Opening Resistance .
Observe the first 15–30 minute candle for clear direction.
If price sustains above 56,936 , bias turns bullish toward 57,400 – 57,447 .
If price breaks below 56,667 , sellers may push Bank Nifty toward Buyer’s Zone: 56,331 – 56,430 .
Options Tip: Employ Strangle or Iron Fly strategies around flat openings with tight ranges.
📉 SCENARIO 3: GAP-DOWN OPENING (Below 56,467) ⚠️
If Bank Nifty opens below 56,467 , downside momentum may accelerate toward Last Intraday Support: 56,331 – 56,430 .
Avoid instant selling at open. Let first 15–30 minute candle give direction clarity.
If price sustains below 56,331 , weakness could extend further.
Options Tip: Focus on ATM or ITM Put Options , or Bear Put Spreads for safer downside positioning.
💡 OPTIONS TRADING RISK MANAGEMENT TIPS
📏 Risk no more than 1–2% of your capital on any single trade.
⏳ Give at least 15–30 minutes after market open before initiating trades.
🔐 Use Hourly Close-based Stop Losses to avoid getting trapped by wicks.
⚖️ Prefer hedged strategies ( Spreads, Iron Fly, Strangles ) during high IV (Implied Volatility) phases.
🚫 Avoid revenge trading. Accept stop-loss gracefully; focus on next setup.
📌 SUMMARY & CONCLUSION
Bullish Bias: Gap-up above 57,136 → Focus on 57,400–57,447 zone.
Range-bound Bias: Flat between 56,667–56,936 → Watch for breakout confirmation.
Bearish Bias: Gap-down below 56,467 → Eye on 56,331–56,430 support zone.
Prioritize confirmation from 15–30 minute opening range before acting.
Maintain strict risk management discipline using options tools like spreads.
⚠️ DISCLAIMER: I am not a SEBI-registered analyst. This trading plan is shared strictly for educational and informational purposes. Please consult your financial advisor before making any trading or investment decisions.
BANKNIFTY : Intraday Trading levels and Plan for 17-July-2025📊 BANK NIFTY INTRADAY TRADING PLAN – 17-Jul-2025
200+ Points Gap Opening Considered Significant | Structured by Psychological Zones
📍 KEY ZONES AND LEVELS TO MONITOR:
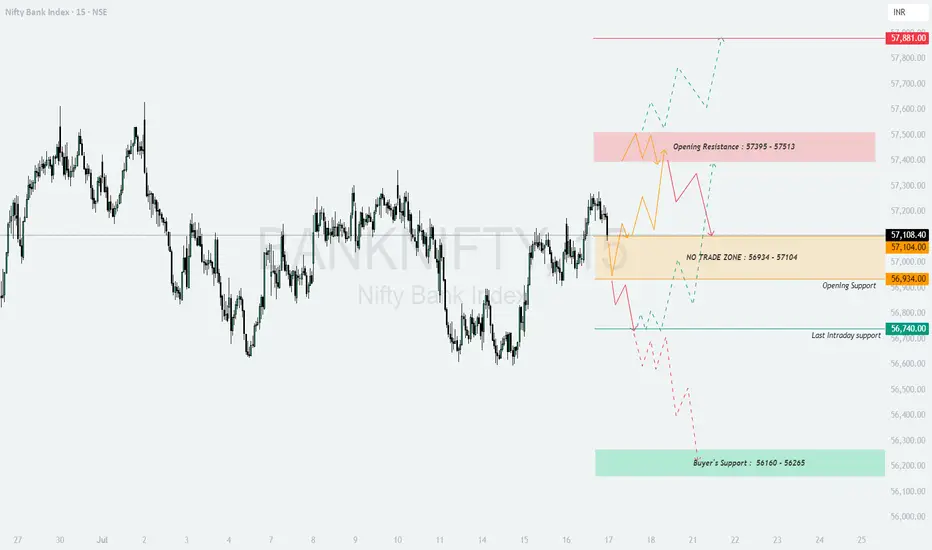
🟥 Opening Resistance Zone: 57,395 – 57,513
🔴 Profit Booking Resistance: 57,881
🟧 NO TRADE ZONE: 56,934 – 57,104
🟦 Opening Support: 56,934
🟩 Last Intraday Support: 56,740
🟩 Buyer’s Support Zone: 56,160 – 56,265
🚀 SCENARIO 1: GAP-UP OPENING (Above 57,395) 📈
If BANK NIFTY opens above 57,395 with 200+ points gap-up, the market enters the Opening Resistance Zone (57,395 – 57,513) .
Buyers should be cautious within this zone, focusing only on quick momentum scalps until a 15-minute candle closes above 57,513 .
If 57,513 breaks and sustains, the next target would be 57,881 (Profit Booking Resistance) .
Options Tip: Deploy ATM Call Options with small quantity initially, increase exposure only on candle confirmation. Avoid far OTM calls in strong gap-ups.
📊 SCENARIO 2: FLAT OPENING (Between 56,934 – 57,104) ⚖️
This zone is marked as NO TRADE ZONE on the chart. Prices may behave indecisively here, so patience is key.
If BANK NIFTY sustains above 57,104 after opening flat, expect upside continuation toward the Opening Resistance Zone.
If BANK NIFTY breaks below 56,934 , look for weakness targeting Last Intraday Support 56,740 .
Options Tip: Consider Iron Condor or Strangle Writing setups within this NO TRADE ZONE if volatility is high. Otherwise, wait for breakout confirmation.
📉 SCENARIO 3: GAP-DOWN OPENING (Below 56,740) ⚠️
If BANK NIFTY opens below 56,740 with a significant gap, bearish momentum is confirmed.
The immediate downside target would be the Buyer’s Support Zone: 56,160 – 56,265 .
Sell-on-rise strategy can be considered after the first 15-minute candle closes below 56,740 .
Options Tip: Prefer ATM or ITM Put Options or build Bear Put Spreads for controlled risk-reward. Avoid naked shorts in case of sudden reversal.
💡 RISK MANAGEMENT TIPS FOR OPTIONS TRADERS
📏 Risk only 1–2% of capital per trade.
⏳ Avoid aggressive entries in the first 15–30 minutes ; let price settle.
🔐 Use Hourly Candle Close for major decision stops, not just wick-based SL.
⚖️ Consider Hedged Strategies (like spreads) during volatile conditions.
📅 Avoid trading just before major news events or expiry if possible.
📌 SUMMARY & CONCLUSION
Bullish Scenario: Gap-up above 57,395 → Target 57,881
Neutral Scenario: Flat between 56,934 – 57,104 → Wait for breakout confirmation
Bearish Scenario: Gap-down below 56,740 → Target 56,160 – 56,265
Trade cautiously around marked zones and follow structured rules. Consistency over prediction!
⚠️ DISCLAIMER: I am not a SEBI-registered analyst. This plan is shared for educational and informational purposes only. Please consult your financial advisor before making any investment decisions.
BANKNIFTY : Trading levels and plan for 16-July-2025📊 BANK NIFTY INTRADAY TRADING PLAN – 16-Jul-2025
Based on 15-Min Chart Observation | 200+ Point Gap Considered Significant
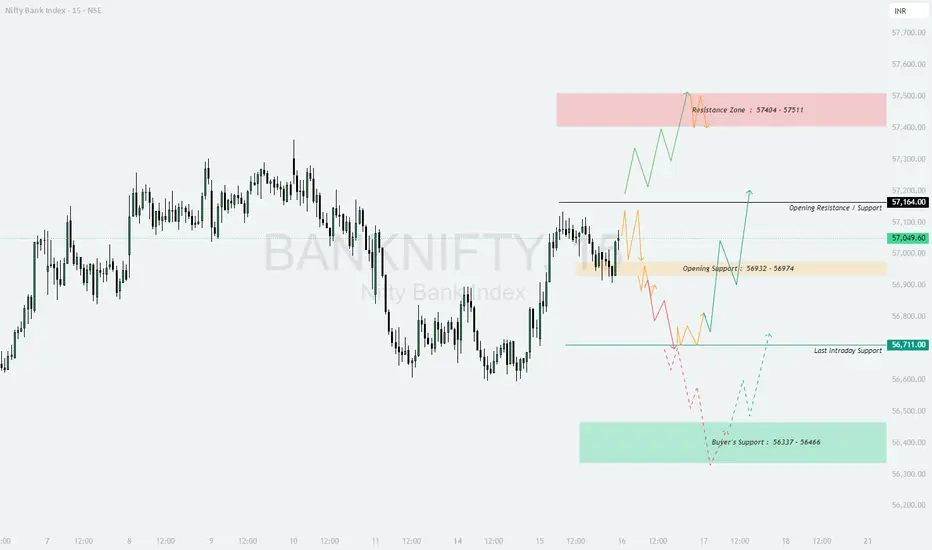
📍 IMPORTANT LEVELS TO WATCH
🟥 Resistance Zone: 57,404 – 57,511
⚫️ Opening Resistance / Support: 57,164
🟧 Opening Support Zone: 56,932 – 56,974
🟩 Last Intraday Support: 56,711
🟩 Buyer’s Support Zone: 56,337 – 56,466
🚀 SCENARIO 1: GAP-UP OPENING (Above 57,164) 📈
If BANK NIFTY opens above 57,164 with a gap of 200+ points, expect a continuation toward the Resistance Zone 57,404 – 57,511 .
Aggressive buying should only be considered after a 15-min candle close above 57,164 to confirm strength.
If prices enter the Resistance Zone, avoid fresh longs and look for profit booking opportunities.
Options Tip: Focus on ATM or ITM Call Options . Avoid far OTM options on gap-up days to minimize theta loss.
📊 SCENARIO 2: FLAT OPENING (Between 56,932 – 57,164) 🔄
This range is marked as a mixed zone: Opening Resistance / Support Zone . Price behavior here will set the day’s tone.
If BANK NIFTY sustains above 57,164 , move towards the bullish setup targeting the upper Resistance Zone.
If BANK NIFTY breaks below 56,932 , expect a decline toward Last Intraday Support 56,711 .
Options Tip: Consider Straddle or Strangle setups for premium decay if prices stay sideways between 56,932 – 57,164. Exit quickly if volatility spikes.
📉 SCENARIO 3: GAP-DOWN OPENING (Below 56,711) ⚠️
A gap-down below 56,711 signals bearish momentum. Initial downside target would be the Buyer’s Support Zone: 56,337 – 56,466 .
Wait for the first 15-minute candle close below 56,711 before shorting to confirm strength.
If prices bounce from Buyer’s Support Zone , observe for reversal signals and manage trailing stop-loss.
Options Tip: Favor ATM or ITM Put Options . On gap-downs, avoid naked far OTM positions—use Bear Put Spreads for balanced risk-reward.
💡 RISK MANAGEMENT TIPS FOR OPTIONS TRADERS
📏 Risk only 1–2% of your trading capital per trade.
⏳ Avoid impulsive entries in the first 15–30 minutes of market opening.
⚖️ Always mark your Stop-Loss based on candle close, not just price spikes.
📈 Choose ATM or ITM options —they offer better Delta and lesser time decay.
💼 Reduce position size when markets open with large gaps to avoid slippage risks.
📌 SUMMARY & CONCLUSION
Bullish Scenario: Above 57,164 → Target 57,404 – 57,511
Range-Bound Scenario: Between 56,932 – 57,164 → Watch closely for breakouts
Bearish Scenario: Below 56,711 → Target 56,337 – 56,466
Stay disciplined and patient. Let the market come to your planned levels instead of chasing moves.
⚠️ DISCLAIMER: I am not a SEBI-registered analyst. This analysis is for educational purposes only. Please do your own research or consult a certified financial advisor before making trading decisions.