BANKNIFTY : Trading levels and Plan for 14-Jul-2025📊 BANK NIFTY INTRADAY PLAN – 14 JULY 2025 (15-Min Chart Analysis)
Educational breakdown for gap-up, flat, and gap-down opening scenarios. Refer to chart zones carefully before executing trades.
📍 Previous Close: 56,712.85
📌 Gap opening threshold: 200+ points
⏱️ Tip: Allow the first 15–30 minutes for price settlement before acting on levels.
📌 KEY LEVELS TO MONITOR
Resistance Zone: 57,164
Last Intraday Resistance: 56,974
Opening Resistance Zone: 56,834
Opening Support/Resistance Zone: 56,688 – 56,640
Buyer's Support Zone: 56,427 – 56,330
Major Support (Breakdown Zone): 56,202
🚀 SCENARIO 1: GAP-UP OPENING (Above 56,834) 📈
Bias: Bullish with caution at upper resistance zones
If Bank Nifty opens above 56,834 , expect a direct test of Last Intraday Resistance: 56,974 .
Sustainable strength above 56,974 can lead towards 57,164 . This is the final resistance zone where booking profits is advisable.
If prices hit 57,164 early in the day, avoid chasing. Wait for a pullback and observe whether 56,974 holds as support.
On strong bullish momentum, avoid deep OTM call buying — stick with ATM/ITM options for safer theta exposure.
📊 SCENARIO 2: FLAT OPENING (Near 56,712 – 56,688) 🔄
Bias: Neutral-to-bearish depending on first hour structure
If opening is near 56,712 – 56,688 , focus on whether 56,688–56,640 (Opening Support/Resistance Zone) holds.
If price breaks and sustains below 56,640, expect a move toward Buyer’s Support Zone: 56,427 – 56,330 .
Best setups would come if price consolidates above or below this opening zone for 30–45 minutes before directional confirmation.
Wait for breakdown candle confirmation before taking PE trades. Avoid random entries in choppy structure.
📉 SCENARIO 3: GAP-DOWN OPENING (Below 56,502) ⚠️
Bias: Bearish with buy-on-dip potential at key support
If opening is below 56,502 , Bank Nifty may directly drift towards Buyer’s Support Zone: 56,427 – 56,330 .
Expect sharp reaction candles from this zone. This is where aggressive intraday buyers may step in.
If even 56,330 breaks, a further slide towards 56,202 becomes likely — avoid catching falling knives below this level unless there’s a clear structure forming.
For conservative traders, avoid counter-trading until price reclaims 56,688 after breakdown.
💡 OPTIONS TRADING – RISK MANAGEMENT TIPS
Use ATM or ITM options in fast-moving markets; avoid deep OTM trades as theta eats premium quickly.
If VIX is high, apply hedging strategies like vertical spreads to manage risk.
Avoid initiating trades based on the first 5-minute candle alone; confirmation is key.
Never risk more than 1–2% of total capital on any single trade.
Watch Bank Nifty along with Nifty and broader sector indices like PSU Banks for confirmation.
Avoid re-entry into the same trade direction after 2:45 PM to reduce event risk.
📌 SUMMARY & CONCLUSION
Bullish Trigger: Above 56,834 → Target 57,164
Neutral Zone: 56,712 – 56,688 → Wait for structure clarity
Bearish Trigger: Below 56,640 → Watch 56,427 – 56,330 for bounce
Trade with discipline, respect levels, and follow confirmation logic before acting.
Options buyers must avoid holding positions post 3 PM if trades are not in favor.
⚠️ DISCLAIMER: I am not a SEBI-registered analyst. This trading plan is for educational purposes only. Please do your own research or consult your financial advisor before trading.
Bankniftyprediction

BANKNIFTY : Trading levels and Plan for 11-Jul-2025📊 BANK NIFTY INTRADAY PLAN – 11 JULY 2025 (15min TF)
An educational and actionable trading strategy based on technical zones and opening behavior.
📍 Reference Close: 56,956.95
📈 Gap Opening Threshold: 200+ points
⏱️ Pro Tip: Let the market stabilize in the first 15–30 mins before entering trades for better confirmation.
📌 KEY LEVELS TO WATCH
Opening Resistance: 57,123
Last Intraday Resistance: 57,223
Profit Booking Zone: 57,609 – 57,678
NO TRADE ZONE: 57,020 – 56,910
Last Intraday Support: 56,768
Support for Consolidation: 56,436 – 56,518
Buyer's Support (Must Try Zone): 56,202 – 56,304
📈 SCENARIO 1: GAP-UP OPENING (Above 57,123)
Bias: Bullish, but caution at higher resistances
If Bank Nifty opens above 57,123 , momentum can build toward 57,223 , the last intraday resistance.
A breakout and sustained close above 57,223 opens the door for a move toward the Profit Booking Zone: 57,609–57,678 .
Watch for exhaustion signs like long upper wicks or volume drop at those higher zones to secure profits.
Avoid chasing CE options if IV is high post-gap-up; wait for consolidation or retracement.
📊 SCENARIO 2: FLAT OPENING (Between 57,020 – 56,910) – NO TRADE ZONE 🟧
Bias: Indecisive — Let market choose direction first
A flat open inside the No Trade Zone suggests potential chop and fakeouts.
Avoid fresh positions in this zone unless you get a decisive breakout above 57,123 or breakdown below 56,910 .
Use this time to observe option premium behavior and build directional bias based on price/volume cues.
Patience will be more profitable than premature trades here.
📉 SCENARIO 3: GAP-DOWN OPENING (Below 56,768)
Bias: Bearish to potential bounce plays
A gap-down below 56,768 puts bears in control, with support at 56,436–56,518 .
If prices break below that consolidation zone, expect a move towards Buyer’s Support Zone: 56,202 – 56,304 , where reversal is possible.
Look for bullish reversal candles at the lower zone for call buying or intraday pullback trade.
If breakdown continues below 56,200, avoid bottom fishing – stick with the trend.
💡 OPTIONS TRADING RISK MANAGEMENT TIPS
Avoid buying OTM options blindly on a gap-up or gap-down – IV crush is real!
Wait for a candle confirmation before jumping into a trade.
Use 15-minute candle close-based SL to prevent getting whipsawed.
Avoid trading in No Trade Zone unless a clear direction is established.
Use vertical spreads to limit risk and hedge positions.
Protect profits after 2 PM – avoid entering new trades in the last hour unless very high conviction.
📌 SUMMARY & CONCLUSION
Bullish Momentum: Above 57,123, target 57,609–57,678
Neutral/Choppy Zone: 57,020 – 56,910 – avoid taking trades here
Bearish Zone: Below 56,768, with bounce watch at 56,202–56,304
Let price action confirm your bias before committing capital
Control risk with predefined SL and avoid emotional trading
⚠️ DISCLAIMER: I am not a SEBI-registered analyst. The above analysis is for educational purposes only. Please consult a certified financial advisor before making trading decisions.

BANKNIFTY - Trading plan and levels for 08-Jul-2025# 💼 \ BANK NIFTY INTRADAY PLAN – 08-July-2025\
📉 \ Index CMP:\ 56,919
📍 \ Chart Setup:\ Support/Resistance Zones + Price Reaction Patterns
🔍 \ Key Levels Analyzed for All Opening Scenarios (200+ pts gap considered)]
---
### 🔑 \ Key Zones To Watch:\
🟧 \ Opening Support / Resistance:\ **57,085**
🟥 \ Last Intraday Resistance Zone:\ **57,321 – 57,375**
🟥 \ Profit Booking / Supply Zone:\ **57,662 – 57,800**
🟦 \ Opening Support Zone:\ **56,657 – 56,705**
🟫 \ Last Intraday Support:\ **56,479**
---
## 🟩 \ 1. GAP-UP Opening (200+ points above 57,085)\
If BANKNIFTY opens above **57,285–57,375**, watch how it behaves inside the intraday resistance zone.
\
\ 📈 \ Breakout Opportunity:\
If price breaks above **57,375** with strength, target the higher **supply zone at 57,662–57,800**.
Entry only after a 15-min candle close above 57,375 with volume.
\ 🔻 \ Reversal from Resistance:\
If price opens in this zone and shows rejection (wick, bearish engulfing), short toward **57,085** with SL above 57,400.
\ 🧠 \ Tip:\ Avoid fresh buying directly into 57,662–57,800 unless market shows sustained momentum.
\
## 🟨 \ 2. FLAT Opening (between 56,880 – 57,085)\
Likely to consolidate early; wait for clean directional move from support or breakout level.
\
\ 🎯 \ Upside Trade:\
Buy above **57,085** if price sustains, target 57,321–57,375.
Watch for continuation if that zone breaks (same setup as Gap-Up case).
\ 🔻 \ Downside Trade:\
If price breaks below **56,880**, expect it to head toward **Opening Support Zone at 56,657–56,705**.
Avoid shorting aggressively in the middle of the range; instead trade near zones.
\ 🕒 \ Patience Pays:\
Wait 15–30 minutes post open for confirmation before executing trades.
\
## 🟥 \ 3. GAP-DOWN Opening (below 56,705)\
A bearish open below the Opening Support Zone brings the **Last Intraday Support (56,479)** into focus.
\
\ 📉 \ Short Opportunity:\
If price fails to sustain above 56,657 after a gap down and retests the level, short with a target of **56,479**.
SL should be just above 56,705.
\ 🔁 \ Reversal Opportunity:\
If price bounces strongly from **56,479–56,500**, a reversal trade may be taken back toward **56,705–56,880** zone.
Use bullish engulfing or inside bar breakout as confirmation.
\ 📌 \ Note:\ This zone is the last hope for intraday bulls – trade cautiously.
\
---
## 🧠 \ Risk Management Tips for Options Traders:\
✅ Trade ATM/ITM options to avoid time decay during consolidation.
✅ Avoid holding positions beyond 12:00 PM if direction remains unclear.
✅ Don’t buy CALLS near known resistance zones or PUTS near support without breakout confirmation.
✅ Use **fixed risk-reward ratio** setups – ideally 1:2 or more.
✅ Never average losers in options – especially in volatile zones.
---
## 📌 \ Summary & Conclusion:\
🎯 \ Above 57,375 = Bullish Continuation\ toward 57,800 possible.
⚠️ \ Rejection from 57,375 = Sell-off to 57,085 or lower.\
🧲 \ Buyers expected at 56,657–56,705 and 56,479.\
📊 Structure favors trend continuation if 57,085 holds as support.
---
⚠️ \ Disclaimer:\
This plan is for educational purposes only. I am \ not a SEBI-registered advisor\ . Please do your own research or consult a financial advisor before taking any trade based on this plan.

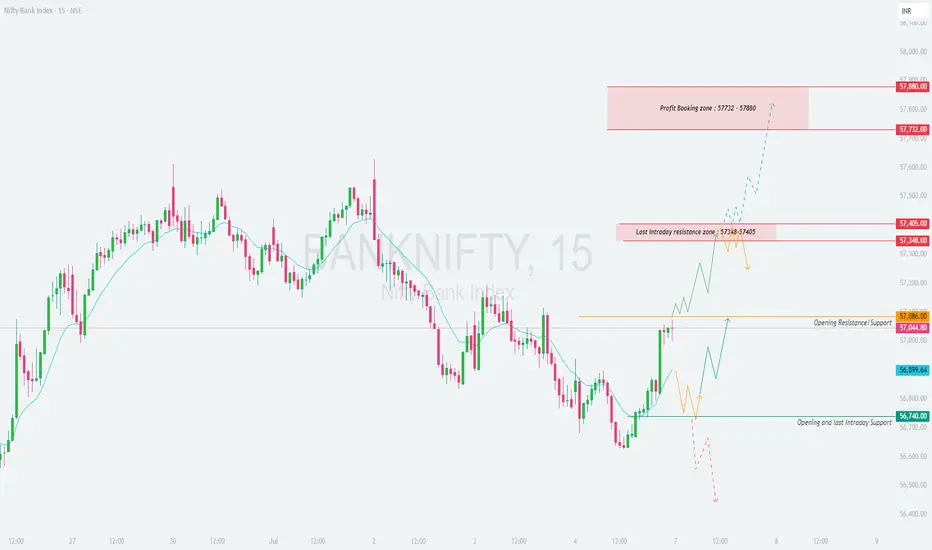
BANKNIFTY : Trading levels and plan for 07-July-2025📘 BANKNIFTY TRADING PLAN – 07-Jul-2025
🕒 Timeframe: 15-Minute | 📈 Structure: Support & Resistance Reaction Zones | ⚙️ Logic: Price Action-Based Intraday Decisioning
📍 Key Levels to Watch:
🔸 Opening Resistance / Support Zone: 57,086
🔸 Last Intraday Resistance Zone: 57,348 – 57,405
🔸 Profit Booking Zone: 57,732 – 57,880
🔹 Opening & Intraday Support Zone: 56,740
🔹 Minor Support Before Breakdown: 56,899
🟩 1. GAP-UP Opening (200+ points above 57,086)
If Bank Nifty opens near or above 57,300–57,400, it will be entering the Last Intraday Resistance Zone. Wait for price to sustain above 57,405 on 15-min candle close to confirm bullish strength.
📈 Action: Buy on breakout above 57,405, targeting 57,732 – 57,880 zone. Partial profit can be booked at 57,732.
🛑 Stop Loss: Keep SL just below 57,348 zone or use 15-min candle low.
⚠️ Caution: Avoid fresh longs near 57,800, as this is a profit booking zone.
If price fails to hold above 57,405 and shows rejection candles like doji/inverted hammers:
📉 Action: Consider shorting with SL above 57,405, targeting 57,086.
🛑 SL: Above the rejection wick
🎯 Target: Retest of breakout near 57,086
🟨 2. Flat Opening (between 56,899 – 57,086)
This range is the neutral zone, where the index may consolidate or create a directional breakout.
🕒 Wait for the first 15–30 mins to allow price action to unfold.
📈 If price breaks above 57,086 with volume, initiate long trade toward 57,348 – 57,405.
📉 If price rejects from 57,086 or breaks below 56,899, a short trade toward 56,740 becomes viable.
🛑 SLs: Use candle-close basis stops near breakout/breakdown levels.
🟥 3. GAP-DOWN Opening (200+ points below 56,740)
A gap-down below 56,740 brings us directly near the last intraday support breakdown area.
📉 Action: Sell on breakdown retest of 56,740, target 56,500 – 56,410 if downside continues.
🔄 Reversal Trade: If price sharply rebounds from 56,740 and crosses 56,899, consider reversal long trades with target 57,086.
🛑 SL: For short – above breakdown candle; for reversal – below support low.
💡 Risk Management Tips for Options Traders:
✅ Trade near breakout/breakdown zones, avoid chasing after wide moves
✅ Avoid buying deep OTM options in time decay zones (post 1 PM)
✅ Keep risk fixed per trade – e.g., 1%–2% of capital
✅ Use spreads (like bull call spread or bear put spread) when volatility is high
✅ Exit when trade structure invalidates (even before SL hits)
📝 Summary & Conclusion:
🔹 Price is currently reacting around the opening supply zone of 57,086.
🔸 Bulls will need to sustain above 57,405 to push toward the 57,732 – 57,880 zone.
🔻 Bears will gain momentum below 56,740, targeting deeper correction.
🕒 Best trades usually form after 15–30 mins of price stability – avoid rushing entries.
⚠️ Disclaimer:
I am not a SEBI-registered analyst . This analysis is for educational purposes only. Please do your own research or consult a financial advisor before making any trading decisions.
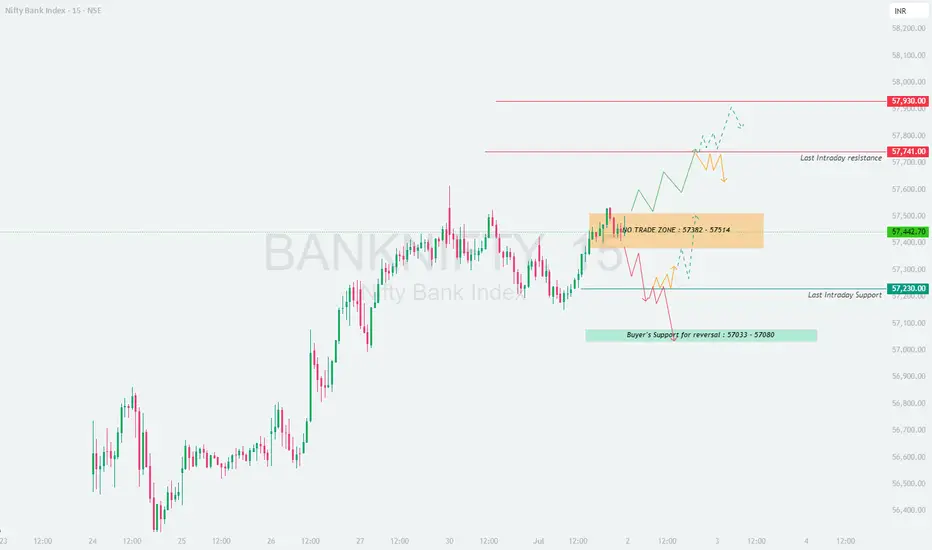
BANKNIFTY : Trading levels and plan for 02-Jul-2025
\ 📊 BANKNIFTY TRADING PLAN – 2-Jul-2025\
📍 \ Previous Close:\ 57,443
📏 \ Gap Opening Consideration:\ ±200 points
🧭 \ Key Zones to Watch:\
🔸 \ No Trade Zone:\ 57,382 – 57,514
🔺 \ Last Intraday Resistance:\ 57,741
🔻 \ Last Intraday Support:\ 57,230
🟦 \ Buyer’s Support for Reversal:\ 57,033 – 57,080
🟥 \ Sharp Resistance for Profit Booking:\ 57,930
---
\
\ \ 🚀 GAP-UP OPENING (Above 57,741):\
A gap-up above \ 57,741\ breaks the intraday resistance and enters a zone where further upside is likely if momentum sustains. However, the \ profit-booking zone near 57,930\ may act as a supply zone.
✅ \ Plan of Action:\
• If price sustains above 57,741 with volume, initiate long trades targeting 57,930
• Watch for signs of exhaustion near 57,930 — trailing stop-loss or partial booking is advised
• Avoid fresh shorts unless reversal candles appear near 57,930
🎯 \ Trade Setup:\
– \ Buy above:\ 57,741 with SL below 57,690, Target: 57,930
– \ Sell only if reversal spotted at 57,930 with SL above 57,960
📘 \ Tip:\ Use trailing stop-loss once in green zone to protect profits.
\ \ ⚖️ FLAT OPENING (Between 57,382 – 57,514):\
Flat opening near the \ No Trade Zone\ suggests indecisiveness. Let the price move outside this range before taking directional trades.
✅ \ Plan of Action:\
• Avoid trading inside 57,382–57,514; fakeouts are likely
• Wait for a breakout above 57,514 to go long or breakdown below 57,382 to go short
• Keep trades light in early session unless trend is clear
🎯 \ Trade Setup:\
– \ Buy above 57,514], SL: 57,440, Target: 57,741
– \ Sell below 57,382], SL: 57,440, Target: 57,230
📘 \ Tip:\ Flat opens often trap early option buyers. Wait for clean structure before entering.
\ \ 📉 GAP-DOWN OPENING (Below 57,230):\
A gap-down below \ 57,230\ brings the price into critical buyer’s support zone between \ 57,033–57,080\ . Expect sharp reversals or further downside based on price action.
✅ \ Plan of Action:\
• Observe price behavior in 57,033–57,080 zone
• Reversal here offers good R\:R long setups
• Breakdown of this zone may trigger fast decline
🎯 \ Trade Setup:\
– \ Buy near 57,050], SL: 57,000, Target: 57,230 / 57,382
– \ Sell below 57,030], SL: 57,080, Target: 56,880
📘 \ Tip:\ Don’t preempt reversals. Wait for candle confirmation or bullish engulfing near support.
---
\ 📌 SUMMARY & TRADE LEVELS:\
✅ \ Bullish Above:\ 57,514 → 57,741 → 57,930
🔽 \ Bearish Below:\ 57,382 → 57,230 → 57,033
🟧 \ No Trade Zone:\ 57,382–57,514 (stay cautious inside this range)
📍 \ Major Action Zones:\
– 🔺 \ Resistance:\ 57,741 & 57,930
– 🔻 \ Supports:\ 57,230 & 57,033–57,080
---
\ 💡 OPTIONS TRADING RISK MANAGEMENT:\
🛡️ \ Do's:\
• Use hedged strategies like Bull Call Spreads in high IV
• Position sizing should be <2% of capital per trade
• Wait for momentum candles to enter directional trades
🚫 \ Don'ts:\
• Avoid naked option selling in volatile zones
• Never average losers
• Don’t rush entry at opening candle
📘 \ Bonus Tip:\ On flat openings, try neutral strategies like Iron Condors if volatility expected to drop.
---
\ ⚠️ DISCLAIMER:\
I am not a SEBI-registered analyst. The above content is purely for educational and illustrative purposes. Always consult your financial advisor before taking any trade. Trade at your own risk and always use stop-loss to protect your capital.
BANKNIFTY : TRADING LEVELS AND PLAN FOR 01-JUL-2025
\ 📊 BANK NIFTY TRADING PLAN – 1-Jul-2025\
📍 \ Previous Close:\ 57,278
📏 \ Gap Opening Consideration:\ ±200 points
📈 \ Chart Timeframe:\ 15-min
🧭 \ Zones to Watch:\
🔴 Resistance for Sideways/Profit Booking: \ 57,808 – 57,980\
🔺 Last Intraday Resistance: \ 57,494\
🟦 Opening Support/Resistance Zone: \ 57,198 – 57,166\
🟩 Last Intraday Support Zone: \ 56,801 – 56,882\
---
\
\ \ 🚀 GAP-UP OPENING (Above 57,680):\
If Bank Nifty opens above \ 57,680\ , it directly enters the \ Sideways/Profit Booking Zone\ (57,808–57,980). This area has high chances of resistance or reversal due to past selling pressure and overbought signals.
✅ \ Plan of Action:\
• Wait for price confirmation with a 15-min candle close above 57,980
• Consider short trades near the upper range if price gets rejected
• Avoid fresh longs unless breakout above 57,980 sustains with volume
🎯 \ Trade Setup:\
– \ Sell near:\ 57,950 with tight SL above 58,000
– \ Target:\ 57,494 or lower
– \ Buy above breakout zone 58,000 with SL below 57,800
📘 \ Tip:\ After strong gap-ups, wait for consolidation or trap confirmation before acting.
\ \ ⚖️ FLAT OPENING (Between 57,200 – 57,300):\
If the index opens flat, it will trade near the \ Opening Support/Resistance Zone\ of \ 57,198 – 57,166\ . Expect initial indecision. Price action near this zone will guide the day’s trend direction.
✅ \ Plan of Action:\
• Wait for a clear break above 57,494 for bullish confirmation
• If price holds above 57,166 and makes higher lows, look for longs
• Breakdown below 57,166 = short opportunity targeting 56,882
🎯 \ Trade Setup:\
– \ Buy above:\ 57,494 with SL below 57,300
– \ Sell below:\ 57,166 with SL above 57,300
📘 \ Tip:\ Don’t trade within the 57,166–57,494 chop zone unless a breakout confirms.
\ \ 📉 GAP-DOWN OPENING (Below 57,050):\
Gap-downs can attract dip buyers, but only if the \ 56,801 – 56,882\ support zone holds. Below that, the market turns weak again.
✅ \ Plan of Action:\
• Wait for reversal signs (e.g., hammer candle) at the 56,801 zone
• Avoid long trades unless price reclaims 57,166
• A clean break below 56,800 can trigger panic selling
🎯 \ Trade Setup:\
– \ Buy at reversal near:\ 56,801 with SL below 56,700
– \ Sell below breakdown of:\ 56,800 with SL above 56,950
– \ Target:\ 56,500 or trailing based on structure
📘 \ Tip:\ Avoid buying early in a falling market. Let buyers show strength.
---
\ 🧭 IMPORTANT LEVELS FOR 1-Jul-2025:\
🔺 \ Resistance:\ 57,494 / 57,808 – 57,980
🟧 \ Neutral Zone:\ 57,166 – 57,494 (choppy range)
🟩 \ Support Zones:\ 57,166 / 56,882 / 56,801
---
\ 💡 OPTIONS TRADING – RISK MANAGEMENT TIPS:\
✅ Use \ weekly ATM straddles or strangles\ only after a range breakout
✅ Don’t overpay for premiums on gap-ups or IV spikes
✅ Follow the \ 2:1 risk-reward\ rule strictly
✅ Size your trade based on volatility
✅ Consider spreads (like bull put or bear call) to manage risk in premium decay environments
🛑 Avoid selling naked options on event or trending days.
---
\ 📌 SUMMARY – QUICK ACTION RECAP:\
• ✅ \ Bullish above:\ 57,494 → Target 57,808+
• ❌ \ Bearish below:\ 57,166 → Target 56,882 and 56,801
• ⚠️ \ Neutral chop zone:\ 57,166 – 57,494 → Avoid indecisive trades
🎯 \ Top Opportunity Zones:\
– Long breakout trade above 57,494
– Short breakdown trade below 57,166
– Reversal play from 56,801 if support holds
---
\ ⚠️ DISCLAIMER:\
I am not a SEBI-registered analyst. This trading plan is shared purely for educational purposes. Please consult with your financial advisor before taking any trade. Always manage risk with stop-loss and position sizing. Trade responsibly.

BANK-NIFTY LEVELS FOR INTRADAY (EDUCATIONAL PURPOSE) 01/07/2025🔷 Bank Nifty Intraday Trade Plan – 1 July
📊 Analysis: 15-min TF | Execution: 1-min TF
🔸 GAP-UP Opening (Above 57,400)
📌 Plan: Avoid aggressive buying. Watch for rejection signs near highs
🔁 Entry: Sell if price breaks 5-min low with volume
🛑 SL: 25–30 pts above high
🎯 Target: 57,150 – 57,200
🔹 GAP-DOWN Opening (Below 57,100)
📌 Plan: Avoid panic shorts. Look for strong reversal pattern
🔁 Entry: Buy if 5-min opening high is reclaimed
🛑 SL: 25–30 pts below swing low
🎯 Target: 57,250 – 57,300
⚫ NORMAL Opening (Between 57,100–57,400)
📌 Range Play Setup
🔸 Sell Zone: Near 57,360–400 (resistance zone)
🔹 Buy Zone: Near 57,120–150 (support zone)
🛑 SL: 25–30 pts beyond trigger level
🎯 Target: 40–60 pts
🔺 Breakout Trade Setup
🔁 Entry: Above 57,400 breakout with momentum
🛑 SL: Below breakout bar
🎯 Target: 57,480 – 57,550
📌 Note: Stick to price action. Avoid overtrading. Follow setup rules strictly.
🧠 React to the market, not to your bias

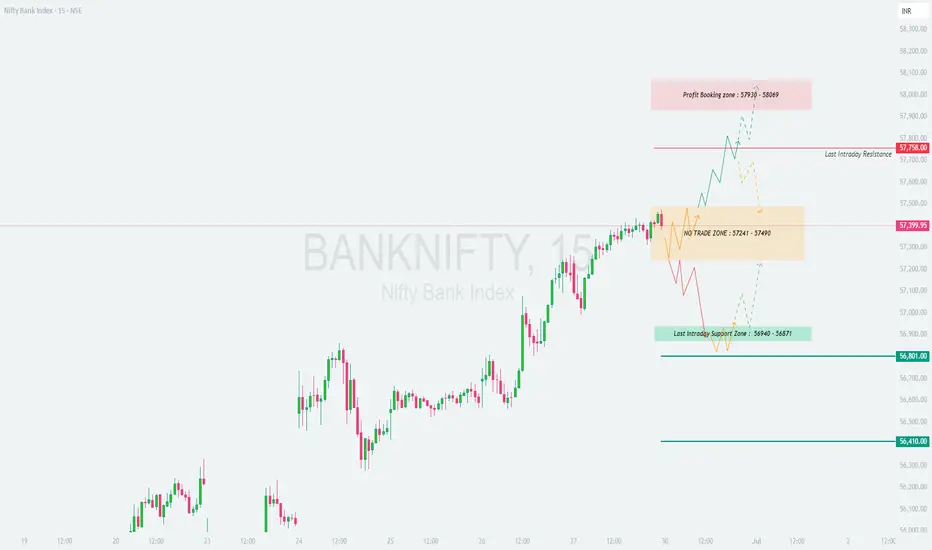
BANKNIFTY : Trading levels and plan for 30-JUN-2025
\ 📊 BANK NIFTY TRADING PLAN – 30-Jun-2025\
📍 \ Previous Close:\ 57,400
📏 \ Gap Reference Threshold:\ ±200 points
🕒 \ Timeframe:\ 15-Min
📈 \ Chart Zones Used:\ No Trade Zone, Support & Resistance areas
---
\
\ \ 🚀 GAP-UP OPENING (Above 57,785):\
If Bank Nifty opens with a gap-up above \ 57,785\ , it will immediately enter the \ Profit Booking Zone (57,930 – 58,069)\ . In this case, traders should be alert for potential exhaustion or consolidation in that zone. Avoid chasing the move unless a breakout is clean with strong follow-through volume.
✅ \ Plan of Action:\
• Wait for price to test 57,930–58,069
• Enter long only if price consolidates and breaks out above 58,069 with good volume
• Watch for profit booking candles or bearish reversal near 58,000 zone
🎯 \ Trade Setup:\
– \ Buy:\ Only above 58,069 (confirmed breakout)
– \ Target:\ 58,300+
– \ SL:\ Below 57,785
📘 \ Tip:\ Opening spikes often trap traders. Wait 15–30 mins before entering a trade after a gap-up.
\ \ ⚖️ FLAT OPENING (Between 57,241 – 57,490):\
This area is defined as a \ No Trade Zone\ due to expected choppy price action. Markets may consolidate or trap both bulls and bears. Best to avoid any directional trades here unless a breakout occurs with conviction.
✅ \ Plan of Action:\
• No trade inside the zone (wait for breakout)
• If price breaks above 57,490 with volume → Long setup
• If price breaks below 57,241 → Short setup initiated
🎯 \ Trade Setup Options:\
– \ Buy:\ Only above 57,490
– \ Sell:\ Only below 57,241
– \ Targets:\ 57,785 (upside), 56,940 (downside)
– \ SL:\ Opposite end of the zone or recent 15-min swing
📘 \ Tip:\ In flat opens, structure develops post 9:30 AM. Be patient and follow only clear breakouts with volume.
\ \ 📉 GAP-DOWN OPENING (Below 56,940):\
A gap-down below \ 56,940\ pushes the market into the \ Last Intraday Support Zone (56,940 – 56,871)\ . If this zone fails to hold, the next major support is at \ 56,410\ . This setup favors sellers but must be executed after observing initial rejection or acceptance of the lower levels.
✅ \ Plan of Action:\
• Short below 56,871 if initial candle confirms breakdown
• If price quickly reclaims 56,940, avoid shorts — it could trap bears
• Watch reversal pattern near 56,410 for potential long
🎯 \ Trade Setup:\
– \ Sell:\ Below 56,871
– \ Target:\ 56,410
– \ SL:\ Above 56,940
📘 \ Tip:\ Don’t rush short trades. Let the price confirm failure of support before initiating.
---
\ 🧩 KEY ZONES TO TRACK:\
🔴 \ Profit Booking:\ 57,930 – 58,069
🔴 \ Last Intraday Resistance:\ 57,785
🟧 \ No Trade Zone:\ 57,241 – 57,490
🟩 \ Last Intraday Support:\ 56,940 – 56,871
🟦 \ Major Support:\ 56,410
---
\ 💡 OPTIONS TRADING TIPS (For Intraday Traders):\
✅ Prefer ATM strikes in high IV zones to avoid time decay
✅ Use spreads (Bull Call / Bear Put) in low volatility conditions
✅ Avoid deep OTM buying on Friday due to Theta erosion
✅ Keep SL fixed: Options can lose value quickly after reversals
✅ Hedge naked options with proper risk-defined trades
✅ Monitor Open Interest buildup around support/resistance levels
---
\ 📌 SUMMARY – STRATEGY AT A GLANCE:\
• ✅ \ Bullish above:\ 57,490 → Potential up move till 57,785 and 58,069
• ⛔️ \ Sideways inside:\ 57,241 – 57,490 → Avoid trades in this zone
• ❌ \ Bearish below:\ 56,871 → Breakdown setup with next support at 56,410
• 🧠 \ Core Idea:\ Let price lead. React, don’t predict blindly.
---
\ ⚠️ DISCLAIMER:\
I am not a SEBI-registered advisor. This analysis is meant purely for educational purposes. Traders are advised to consult their financial advisor and manage risk strictly. Always use stop-loss and proper position sizing.
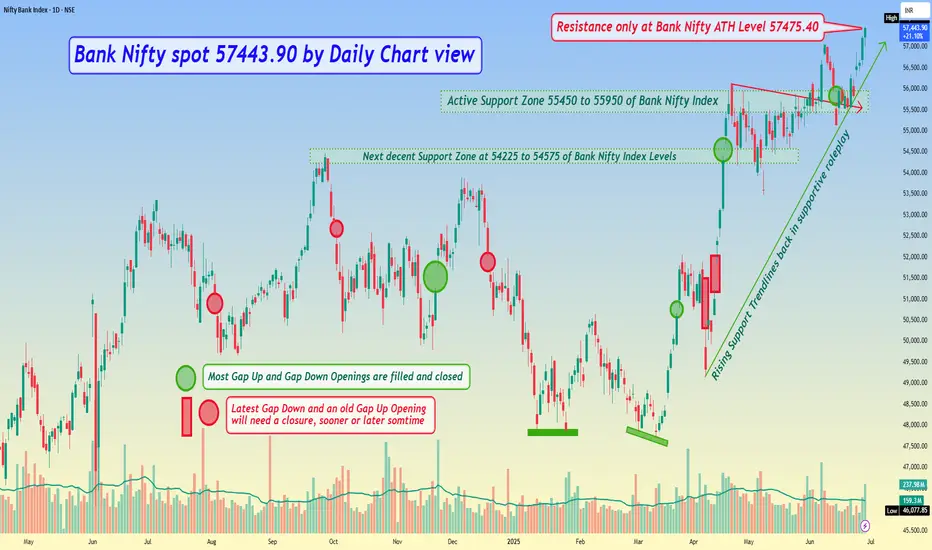
Bank Nifty spot 57443.90 by Daily Chart view - Weekly update*Bank Nifty spot 57443.90 by Daily Chart view - Weekly update*
- Resistance only at Bank Nifty ATH Level 57475.40
- Active Support Zone 55450 to 55950 of Bank Nifty Index
- Rising Support Trendlines back in supportive role has sustained
- Next decent Support Zone at 54225 to 54575 of Bank Nifty Index Levels
- Bullish Rounding Bottom below ATH indicatives more positive trends to look forward to.....
BANKNIFTY : Trading levels and plan for 27-Jun-2025
\ 📊 BANK NIFTY TRADING PLAN – 27-Jun-2025\
📍 \ Previous Close:\ 57,174
📏 \ Gap Reference:\ ±200 points
🕓 \ Timeframe:\ 15-Min
🎯 \ Focus:\ Structured trading based on volatility zones with breakout/breakdown follow-through setups
---
\
\ \ 🚀 GAP-UP OPENING (Above 57,297):\
If Bank Nifty opens above \ 57,297\ , it will breach the \ Opening Resistance Zone\ and move into the \ Intraday Resistance area (57,513)\ . Momentum-driven traders must stay alert for quick profit-taking near \ 57,700+\ — marked as a \ Sharp Profit Booking Zone\ .
✅ \ Plan of Action:\
• Watch early 5–15 minute candle behaviour
• If strong green candle above 57,297 with follow-through → go long
• Avoid aggressive longs near 57,513 – 57,700 zone unless volume breakout seen
🎯 \ Trade Setup:\
– \ Buy\ above 57,297
– \ Target:\ 57,513 → 57,700
– \ Stop-loss:\ Below 57,180 (spot closing basis)
📘 \ Tip:\ Don't chase the opening spike. Let price stabilize and confirm with retest of 57,297 zone for lower-risk entry.
\ \ ⚖️ FLAT OPENING (Between 57,047 – 57,297):\
Flat opening inside the \ No Trade Zone\ (highlighted range) signals indecision. Price may oscillate between support and resistance — breakout trades only after the range is broken on either side.
✅ \ Plan of Action:\
• If price breaks above 57,297 with strong candle → bullish continuation
• If price breaks below 57,047 → look for quick short setups
• Avoid trading within 57,047–57,297 until clarity emerges
🎯 \ Trade Setup Options:\
– Long: Only above 57,297 with candle close
– Short: Below 57,047 with momentum
– \ Target:\ 57,513 (upside) or 56,822 (downside)
– \ Stop-loss:\ Based on opposite zone breakout
📘 \ Tip:\ Let market show direction post 9:30 AM. Trade with candle confirmation to reduce fake breakout risk.
\ \ 📉 GAP-DOWN OPENING (Below 56,822):\
Gap-downs below \ 56,822\ place Bank Nifty near the \ Last Intraday Support zone\ . If this level is breached, the next watch area is around \ 56,626\ — expect potential bounce or sharp fall from here based on sentiment.
✅ \ Plan of Action:\
• If first candle sustains below 56,822 → short on pullback
• Avoid longs until 56,822 is reclaimed
• Watch price action closely near 56,626 for buyer reaction
🎯 \ Trade Setup:\
– \ Sell\ below 56,822
– \ Target:\ 56,626
– \ SL:\ Above 56,900 or candle close back inside support
📘 \ Tip:\ Avoid fresh longs in a falling gap-down market. Always wait for signs of reversal before considering bullish trades.
---
\ 📌 KEY ZONES TO WATCH:\
🔴 \ Sharp Profit Booking:\ 57,700
🔴 \ Intraday Resistance:\ 57,513
🟧 \ Opening Resistance:\ 57,297
🟨 \ No Trade Zone:\ 57,297 – 57,047
🟩 \ Opening Support:\ 57,047
🟦 \ Intraday Support:\ 56,822
🟫 \ Deep Support:\ 56,626
---
\ 💡 OPTIONS TRADING TIPS & RISK MANAGEMENT:\
✅ Use \ spread strategies\ like Bull Call or Bear Put to reduce premium decay
✅ Avoid \ buying deep OTM options\ without clear momentum
✅ \ Protect capital:\ Risk max 1.5%–2% per trade
✅ \ Never average losers\ ; re-enter with better structure
✅ \ Exit on time:\ Don’t hold trades beyond trend invalidation — follow candle structure
✅ Keep eye on \ Open Interest buildup\ near key zones
---
\ 🧾 SUMMARY:\
• 🔼 \ Bullish above:\ 57,297 → potential breakout toward 57,513 / 57,700
• ⚠️ \ Sideways inside:\ 57,297 – 57,047 → no trade zone
• 🔽 \ Bearish below:\ 56,822 → fall may extend till 56,626
• 🧠 \ Key Message:\ Let price show the path. React to confirmation, not assumptions.
---
\ ⚠️ DISCLAIMER:\
I am not a SEBI-registered advisor. This trading plan is solely for educational purposes. Please consult your financial advisor before taking any trades. Always use proper risk management, stop-loss, and position sizing strategies.

BANK NIFTY Levels For Intraday ( Educational Purpose) 26/06/2025🚨 Bank Nifty Intraday Plan (for 1-Min Traders) – 26th June
🟢 If Gap-Up Opening
✅ Buy above: 56,650
🎯 Target: 56,820 / 56,950
🛑 SL: 56,550
🚫 Avoid trade if no volume or false breakout at high.
🔴 If Gap-Down Opening
✅ Sell below: 56,500
🎯 Target: 56,320 / 56,150
🛑 SL: 56,600
🚫 Avoid short if price recovers above 56,600.
📍 Use 1-min chart with confirmation of 3 candles & volume surge.
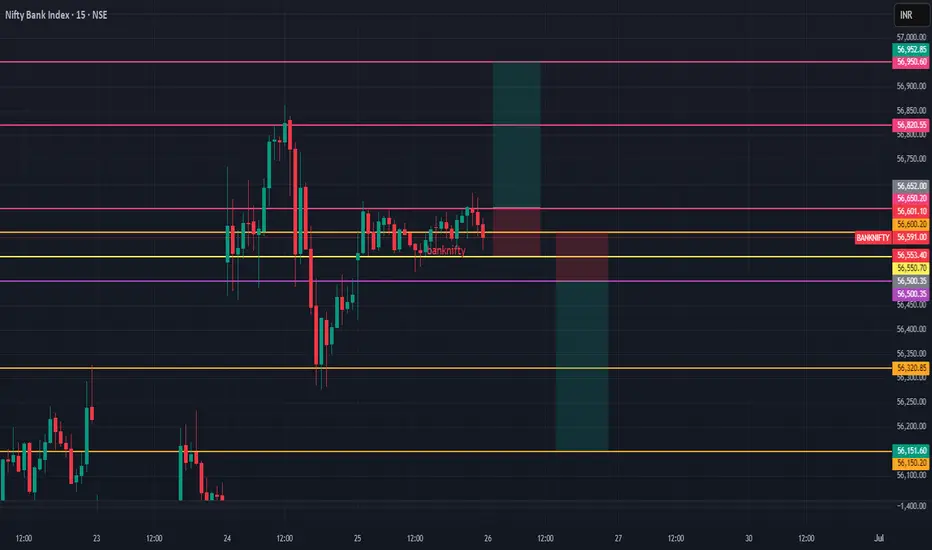
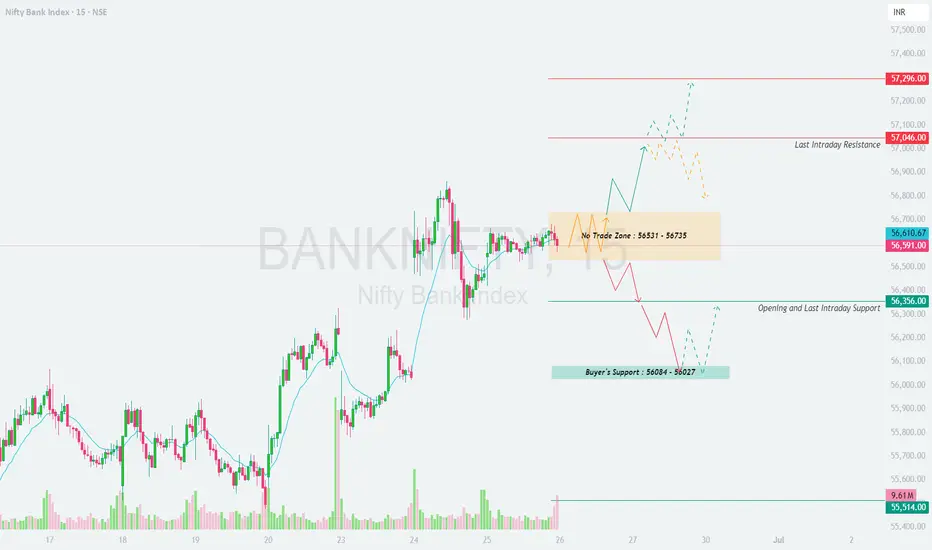
BANKNIFTY : Trading Levels and Plan for 26-Jun-2025
\ 📊 BANK NIFTY TRADING PLAN – 26-Jun-2025\
📍 \ Previous Close:\ 56,591
📏 \ Gap Opening Threshold:\ ±200 Points
🕒 \ Chart Reference:\ 15-min Time Frame
📦 \ Volume Snapshot:\ 9.61M (suggesting trader participation)
---
\
\ \ 🚀 GAP-UP OPENING (Above 56,735):\
If Bank Nifty opens above the \ No Trade Zone (56,531 – 56,735)\ , it may attempt to test the \ Last Intraday Resistance Zone – 57,046\ . A strong push above this level can open up room till \ 57,296\ .
✅ \ Plan of Action:\
• Allow first 15–30 minutes for confirmation
• A breakout and sustained strength above 57,046 can trigger a directional move
• Watch for price action (e.g. rejection wicks) near 57,046 before entering
🎯 \ Trade Setup:\
– Long above 57,046 (on bullish candle close)
– Target: 57,296
– SL: Below 56,735
– Avoid shorts unless price gives rejection confirmation at 57,046–57,296 zone
📘 \ Pro Tip:\ Momentum trades work best here — avoid small SLs due to wide range.
\ \ ⚖️ FLAT OPENING (Within 56,531 – 56,735):\
This is a \ No Trade Zone\ and should be approached with caution. Prices may consolidate or trap early buyers/sellers.
✅ \ Plan of Action:\
• Observe price action for breakout above 56,735 or breakdown below 56,531
• Avoid trading inside the zone — it's prone to fake moves
• Structure your entry after the breakout is confirmed with volume
🎯 \ Trade Setup:\
– Long above 56,735 → Target 57,046
– Short below 56,531 → Target 56,356
– SL: Just above/below the zone boundary
📘 \ Pro Tip:\ If stuck inside this zone, wait. Reacting early leads to poor entries and whipsaws.
\ \ 📉 GAP-DOWN OPENING (Below 56,356):\
Opening below this zone places immediate focus on the \ Buyer’s Support Zone (56,084 – 56,027)\ . If this level holds, a bounce could be expected, else 55,514 may come into play.
✅ \ Plan of Action:\
• If a bullish candle forms near 56,027–56,084, go long for reversal scalps
• Breakdown below 56,027 = potential strong sell-off
• Avoid trying to bottom fish unless reversal is evident with volume spike
🎯 \ Trade Setup:\
– Long: Only on reversal from 56,027 with SL below zone
– Short: Below 56,027 with confirmation
– Target: 55,514
– SL: 50–60 pts based on volatility
📘 \ Pro Tip:\ Buyer zones often lead to sharp reversal moves — play small and safe until confirmed.
---
\ 💡 RISK MANAGEMENT & OPTIONS TRADING TIPS:\
✅ Use \ Spread Strategies\ when IV is high — e.g., Bear Put Spread
✅ Avoid buying options inside \ No Trade Zone\ due to theta decay
✅ Strict \ 15-min candle close SL\ to validate exits
✅ Never risk more than \ 2% of your capital\ on a single trade
✅ Size options position based on premium — not lot count alone
---
\ 📌 KEY LEVELS TO WATCH:\
🟧 \ No Trade Zone:\ 56,531 – 56,735
🟥 \ Last Intraday Resistance:\ 57,046
🔺 \ Profit Booking Resistance:\ 57,296
🟩 \ Opening Support:\ 56,356
🟦 \ Buyers Support Zone:\ 56,084 – 56,027
🟥 \ Breakdown Support:\ 55,514
---
\ 🎯 SUMMARY – GAME PLAN FOR THE DAY:\
• 🔼 \ Bullish Above:\ 56,735 → Watch 57,046
• ⏸️ \ Avoid Inside Zone:\ 56,531 – 56,735
• 🔽 \ Bearish Below:\ 56,356 → Target Buyer’s Zone
• ⚠️ \ Breakdown Below:\ 56,027 = Trend Reversal Risk
---
\ ⚠️ DISCLAIMER:\
I am not a SEBI-registered advisor. This content is purely for educational purposes. Please consult a qualified financial advisor before acting on any trades. Use strict stop-loss and trade management techniques at all times.
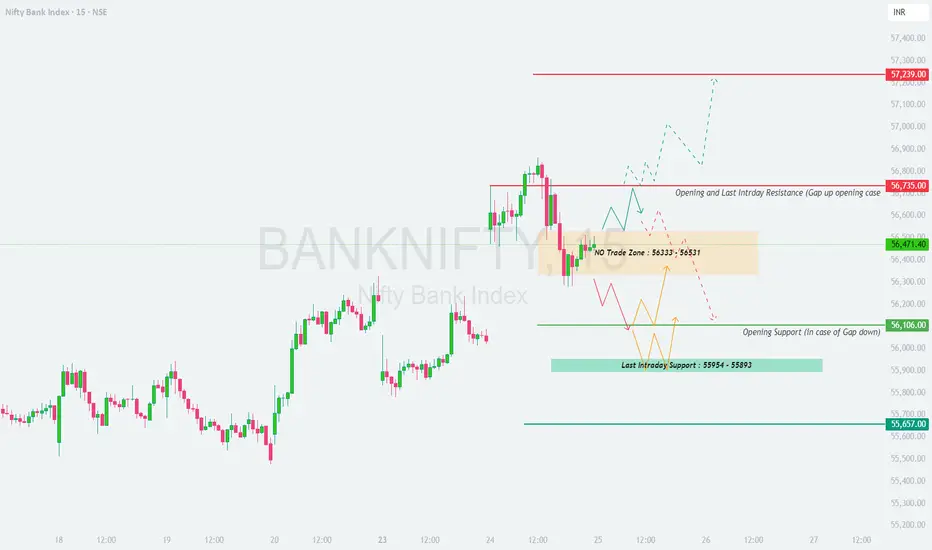
Banknifty : Trading Plan and levels for 25-Jun-2026
\ 📊 BANKNIFTY TRADING PLAN – 25-Jun-2025\
📍 \ Previous Close:\ 56,471.40
📏 \ Gap Threshold Considered:\ 200+ points
📉 \ Chart Basis:\ 15-min Timeframe
📌 \ Volume Watch:\ 11M (important for confirmation near key levels)
---
\
\ \ 🚀 GAP-UP OPENING (Above 56,735):\
If BankNifty opens above \ 56,735\ , it enters the prior \ Last Intraday Resistance and Opening Resistance Zone\ , which could act as a potential supply area. A further move toward \ 57,239\ (upper target) is possible only on sustained momentum.
✅ \ Plan of Action:\
• Let the price stabilize for 15–30 minutes.
• A breakout above 56,735 with volume can attract follow-up buying.
• However, any hesitation near this zone may trigger intraday profit booking.
🎯 \ Trade Setup:\
– Long above 56,735 (only if candle sustains with strength)
– Target: 56,900 / 57,239
– SL: 56,550
– Short opportunity arises if price reverses from 56,735 zone with bearish wick
📘 \ Pro Tip:\ Use trailing SL when riding bullish momentum post-gap-up.
\ \ ⚖️ FLAT OPENING (Between 56,333 – 56,531):\
This zone is marked as a \ No Trade / Decision Zone\ . The market might consolidate here before a decisive move either way.
✅ \ Plan of Action:\
• Avoid early trades in this choppy zone.
• Watch for breakout above 56,531 = bullish signal
• Breakdown below 56,333 = early weakness
🎯 \ Trade Setup:\
– Long above 56,531
– Short below 56,333
– SL: 40–60 pts depending on volatility
– Prefer breakout + retest pattern
📘 \ Pro Tip:\ Patience pays here — don't get trapped in false moves inside the range.
\ \ 📉 GAP-DOWN OPENING (Below 56,106):\
A gap-down below \ 56,106 (Opening Support)\ will shift the focus to the \ Last Intraday Support Zone – 55,954 to 55,893\ . If these supports fail, deeper correction may follow toward \ 55,657\ .
✅ \ Plan of Action:\
• Watch reaction at 55,954–55,893
• If price bounces here with volume, expect a quick intraday reversal trade
• A breakdown here confirms bearish grip toward 55,657
🎯 \ Trade Setup:\
– Short below 55,893 with confirmation
– Target: 55,657
– SL: 56,050
– Long only if strong bullish reversal candle forms in green zone
📘 \ Pro Tip:\ Avoid knife-catching. Let the support prove itself before going long.
---
\ 💼 OPTIONS RISK MANAGEMENT TIPS:\
✅ \ 1. Avoid buying options blindly on gap opens—wait for confirmation\
✅ \ 2. Use spreads in consolidation zones to minimize theta loss\
✅ \ 3. Track volume + price together; high IV = better premium opportunity\
✅ \ 4. Never risk more than 2% of capital in a single trade\
✅ \ 5. For index options, always define SL by candle close (15-min preferred)\
---
\ 📌 SUMMARY – KEY LEVELS TO WATCH:\
🔴 \ Major Resistance:\ 57,239
🟥 \ Opening & Intraday Resistance:\ 56,735
🟧 \ No Trade Zone:\ 56,333 – 56,531
🟩 \ Opening Support:\ 56,106
🟦 \ Intraday Support Zone:\ 55,954 – 55,893
🟫 \ Major Breakdown Level:\ 55,657
---
\ 🧭 CONCLUSION:\
• 🔼 \ Above 56,735:\ Bullish if sustains — target 57,239
• ⏸ \ Between 56,333–56,531:\ Avoid trading until breakout/breakdown
• 🔽 \ Below 56,106:\ Weak bias — eyes on supports at 55,954 and 55,657
Stick to process, not prediction. Observe structure, manage risk, and stay adaptable. 🎯📊💼
---
\ ⚠️ DISCLAIMER:\
I am not a SEBI-registered analyst. This trading plan is shared for educational purposes only. Please consult your financial advisor before making any trading decisions. Always use strict risk management and stay disciplined. 📉📚🛡️
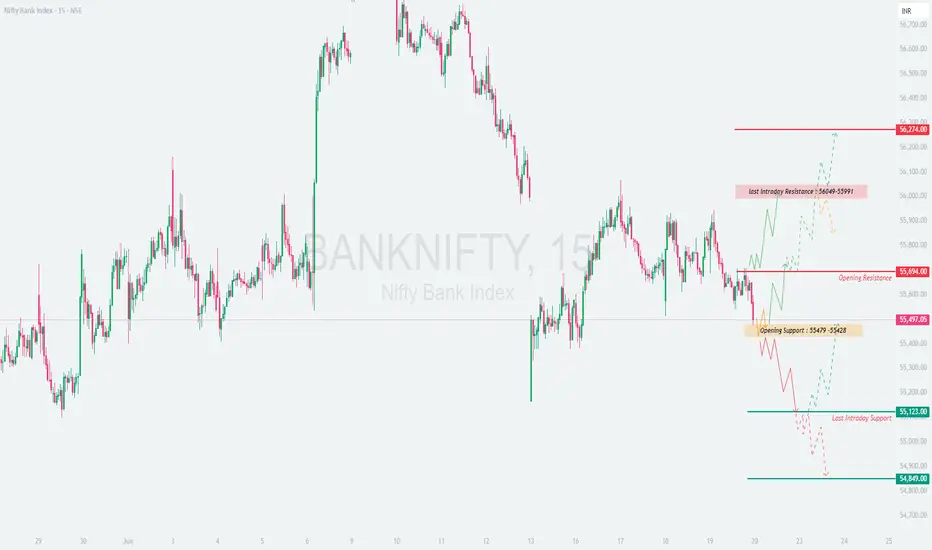
BANKNIFTY : Trading levels and plan for 20-Jun-2025
\ 📊 BANK NIFTY TRADING PLAN – 20-Jun-2025\
📍 \ Previous Close:\ 55,497.05
📏 \ Gap Opening Threshold:\ 200+ points
🕰 \ Chart Timeframe:\ 15-min
---
\
\ \ 🚀 GAP-UP OPENING (Above 55,694):\
If Bank Nifty opens above 55,694 with a 200+ points gap-up, the index may trigger a breakout attempt.
✅ \ Plan of Action:\
• Watch for sustained move above \ Opening Resistance (55,694)\
• First resistance lies in the \ Last Intraday Resistance zone (56,049–55,991)\
• A breakout above 56,049 can fuel momentum toward \ 56,274\
• In case of rejection from resistance zone, be ready for intraday pullback to 55,694 or even 55,497
• Ideal entries:
– Long above 56,049 after 15–30 min consolidation
– SL for longs: Below 55,850
– Exit zone: Trail to 56,274 or book near swing highs
📘 \ Tip:\ Avoid aggressive buying immediately on gap-ups — instead, wait for candle confirmation and continuation above resistance.
\ \ 🔁 FLAT OPENING (Between 55,497 – 55,694):\
Flat opens within this range indicate indecision and may lead to a breakout or breakdown depending on volume.
✅ \ Plan of Action:\
• Wait for first 15-min range breakout
• \ Bullish case:\ Break above 55,694 → Target 56,049–56,274
• \ Bearish case:\ Break below 55,497 → Sell toward 55,123
• Avoid trades inside \ 55479 – 55528\ (Opening Support) unless clear trend develops
• SLs must be strictly based on candle closing outside the zones
📘 \ Tip:\ Flat openings are high-reward only when you play post-breakout moves. Wait for structure → trade with momentum.
\ \ 📉 GAP-DOWN OPENING (Below 55,123):\
Gap-downs offer opportunity for short trades and potential bounces near key support levels.
✅ \ Plan of Action:\
• Below 55,123, bearish sentiment strengthens.
• Next level to watch: \ 54,849 (Support zone)\
• If 54,849 breaks decisively, expect further downside, else consolidation likely
• Ideal trades:
– Short below 55,123 with SL above 55,200
– Long only if strong bullish reversal seen from 54,849
• Risk increases if price whipsaws around 55,123 — trade lighter or avoid overtrading
📘 \ Tip:\ In gap-down cases, avoid panic shorts. Look for breakdown candles with volume for confidence.
---
\ 🛡 RISK MANAGEMENT & OPTIONS TRADING TIPS:\
✅ \ 1. Avoid trading first 5-min candles — observe initial volatility\
✅ \ 2. Use defined SL based on structure (like 15-min close below level)\
✅ \ 3. Avoid buying deep OTM options in sideways zones — theta decay eats premiums\
✅ \ 4. Use spreads like Bear Call / Bull Put when IV is high or movement is limited\
✅ \ 5. Always trail stop-loss once trade is in profit zone\
---
\ 📌 SUMMARY – KEY LEVELS FOR 19-Jun-2025:\
• 🟩 \ Buyer’s Support Zone:\ 54,849 – key reversal area
• 🟦 \ Opening Support:\ 55479 – 55428
• 🟥 \ Opening Resistance:\ 55,694
• 🟧 \ Last Intraday Resistance:\ 55,991 – 56,049
• 🚩 \ Breakout Level:\ 56,274
💡 \ Above 56,049 = Buy strength | Below 55,123 = Sell weakness\
---
\ 📢 DISCLAIMER:\ I am not a SEBI-registered analyst. This trading plan is shared for educational purposes only. Please consult your financial advisor before making any trade decisions based on this content.
BANKNIFTY : Trading plan and levels for 21-JUN-2025
\ 📊 BANK NIFTY TRADING PLAN – 21-Jun-2025\
📍 \ Previous Close:\ 56,216.50
📏 \ Gap Opening Threshold:\ 200+ points
🕒 \ Timeframe:\ 15-minute chart (price action-based planning)
---
\
\ \ 🚀 GAP-UP OPENING (Above 56,664):\
If Bank Nifty opens above 56,664, it will be entering fresh bullish territory. This level marks the **breakout zone**, and caution is needed for confirmation trades.
✅ \ Plan of Action:\
• Monitor price action for 15–30 minutes.
• If price sustains above 56,664, the index may show follow-through up-move.
• Potential upside targets: \ 56,800 – 56,950\ range.
• However, if the index gets rejected from 56,664 with selling pressure, watch for a pullback toward the **NO TRADE ZONE (56,261–56,109)**.
🎯 \ Trade Setup:\
– Long only if 15-min candle closes above 56,664
– Stop-loss: below 56,500
– Target: 56,800 and trail higher
📘 \ Tip:\ Don’t buy aggressively at open. Let the breakout be confirmed with volume. Gaps often retrace if broader market doesn't support.
\ \ 📘 FLAT OPENING (Between 56,044 – 56,261):\
This is the **NO TRADE ZONE** where indecision is high. Price can whipsaw both sides and create traps.
✅ \ Plan of Action:\
• Stay patient in first 15 minutes — let price choose direction.
• \ Bullish Setup:\ Buy only if price sustains above 56,261 and shows strength toward 56,664
• \ Bearish Setup:\ Sell if price breaks below 56,044 with a convincing close
• Avoid random trades inside 56,109–56,261 zone
🎯 \ Trade Setup:\
– Long > 56,261 or Short < 56,044
– Use tight SLs and quick profit-booking in such zones
📘 \ Tip:\ Range trades can fail here. Let levels break before initiating positions.
\ \ 📉 GAP-DOWN OPENING (Below 55,889):\
If the index opens below the previous support of 55,889, expect weakness to prevail.
✅ \ Plan of Action:\
• Immediate support lies at \ 55,652\ . A bounce may be seen from this level.
• Breakdown below 55,652 can lead to 55,400–55,250 zones
• Watch for reversal candles if testing support, else shorting opportunities emerge
🎯 \ Trade Setup:\
– Sell below 55,652 with SL above 55,800
– Only go long if price sharply reverses from 55,652 with volume
📘 \ Tip:\ Gaps to the downside are usually accompanied by panic. Don’t chase trades, wait for structure to develop.
---
\ 🛡 RISK MANAGEMENT & OPTIONS TRADING TIPS:\
✅ \ 1. Avoid first 5-min trades – let volatility settle\
✅ \ 2. Prefer ATM or slightly ITM options to avoid high theta decay\
✅ \ 3. Don’t over-leverage after gap opens – premiums are inflated\
✅ \ 4. Use trailing SL once in profit – lock gains smartly\
✅ \ 5. Avoid blind straddles in NO TRADE ZONES – wait for directional clarity\
---
\ 📌 SUMMARY – LEVELS TO WATCH FOR 21-Jun-2025:\
• 🟠 \ NO TRADE ZONE:\ 56,109 – 56,261
• 🟥 \ Breakout Resistance:\ 56,664
• 🟩 \ Opening Support:\ 56,044
• 🟦 \ Last Intraday Support:\ 55,889
• 🔻 \ Support for Breakdown:\ 55,652
💡 \ Strategy Recap:\
• 🔼 Above 56,664 = Bullish
• ⏸ Inside 56,109–56,261 = Wait & watch
• 🔽 Below 55,889 = Caution for shorts
---
\ 📢 DISCLAIMER:\
I am not a SEBI-registered analyst. This plan is shared for educational purposes only. Please consult your financial advisor before making trading decisions. Trade responsibly. 💹

BANKNIFTY : Trading plan for 18-Jun-2025📘 BANK NIFTY – TRADING PLAN for 18-Jun-2025
🕒 Chart Timeframe: 15-min | 📍 Previous Close: 55,678.70
📏 Gap Opening Threshold: 200+ points
🔼 GAP-UP OPENING (Above 55,878):
If Bank Nifty opens above the No Trade Zone (55,856) by more than 200 points, price would be near or above the Last Intraday Resistance at 56,193 . Immediate upside momentum can push it toward the Profit Booking Zone between 56,316 – 56,391 .
✅ Plan of Action:
• Wait 15–30 mins to avoid emotional entry near resistance.
• If price sustains above 56,193 with strength (volume + higher lows), consider long trades for target zones of 56,316 – 56,391.
• If price gets rejected at 56,193 or forms bearish reversal patterns, consider short scalps with SL above 56,250, targeting back to 55,856.
• Only aggressive buyers may look for momentum above 56,391, but avoid chasing at extended zones.
📘 Educational Note: Gaps near known resistance zones are tricky. Most profits are made not by predicting, but by reacting to clean confirmation .
⚖️ FLAT OPENING (Between 55,678 – 55,856):
Flat opening inside the No Trade Zone (55,696 – 55,856) indicates a possible sideways session at the open. This zone can act as both resistance and support depending on the first breakout direction.
✅ Plan of Action:
• Avoid trading inside this zone initially — it’s designed to trap both sides.
• For Bullish Bias: Wait for price to break and hold above 55,856. Then consider longs toward 56,193 with SL below 55,800.
• For Bearish Bias: Breakdown below 55,696 with rejection candles is an opportunity to short for target 55,483. SL can be set above 55,750.
• First 15–30 mins are crucial for range direction setup — let price develop a trend.
📘 Educational Note: When trading inside a No Trade Zone, always let one side break clearly, then ride the direction with confirmation candles .
🔽 GAP-DOWN OPENING (Below 55,478):
A 200+ point gap-down would place Bank Nifty below the Opening Support (55,483) , possibly into the Buyer’s Support Zone (55,123 – 55,232) . This zone is critical and can trigger sharp rebounds or panic drops depending on sentiment.
✅ Plan of Action:
• If opening occurs near 55,123 – 55,232, look for bullish reversal signals (hammer, bullish engulfing) for long scalps with SL below 55,100, targeting 55,483.
• If price bounces from 55,123 and reclaims 55,483, buyers may get aggressive, opening room till 55,696.
• However, if price breaks below 55,123, avoid longs. Ride the downside till next major support emerges on higher timeframes.
• Avoid shorting directly into support—wait for a breakdown and retest.
📘 Educational Note: Buyer’s zones are where institutions might enter. So always confirm strength before buying and avoid shorting unless support fails convincingly.
🛡 RISK MANAGEMENT TIPS for OPTIONS TRADERS:
✅ 1. Time Entry Smartly: Avoid first 15 mins on high-gap days. Let structure build.
✅ 2. Focus on Breakout + Retest Entries — More reliable than pure breakout scalps.
✅ 3. Hedge Long Option Positions with spreads (e.g., Call Spread) to offset IV drops.
✅ 4. Always have a Stop Loss on Candle Close Basis — Prefer 15-min or hourly closes.
✅ 5. Adjust size with volatility: Higher the gap, smaller the lot size to manage risk better.
📊 SUMMARY & LEVELS TO WATCH:
• 🟢 Bullish Scenario:
– Above 55,856 → Target: 56,193 → 56,316 – 56,391
– SL below 55,800 on longs
• 🔴 Bearish Scenario:
– Below 55,696 → Target: 55,483 → 55,232 → 55,123
– Breakdown SL above 55,750
• 🟧 No Trade Zone: 55,696 – 55,856 — Wait for breakout
• 🟩 Support Zones: 55,483 / 55,232 / 55,123
• 🟥 Resistance Zones: 56,193 / 56,391
📌 Decision Point: Break of 55,856 or 55,696 decides intraday direction
⏱ Tip: Use confirmation candles + volume analysis to filter entries and exits.
📢 DISCLAIMER: I am not a SEBI-registered analyst. The above analysis is intended for educational and informational purposes only. Kindly consult your registered financial advisor before making any trading or investment decision.

MRF: Inverted Head & Shoulders Breakout |Targets Ahead! MRF has confirmed a breakout from an Inverted Head & Shoulders pattern on the daily chart, signaling a potential bullish trend reversal. The breakout has occurred with strong volumes, adding conviction to the move.
🔍 Trade Setup:
Buy Above: ₹115,579
Stop Loss: ₹111,230 (Closing Basis)
Targets:
🎯 Target 1: ₹118,028
🎯 Target 2: ₹120,443
🎯 Target 3: ₹123,358
🎯 Target 4: ₹126,157
🎯 Target 5: ₹129,019
The pattern structure aligns well with Fibonacci extension levels and previous resistance zones, providing a favorable risk-to-reward ratio.
📌 Chart Highlights:
Breakout above neckline with volume surge
Positive RSI momentum confirming breakout strength
Price sustaining above key moving averages
⚠️ Disclaimer:
I am not a SEBI-registered advisor. This analysis is shared for educational and informational purposes only. Please consult your financial advisor before making any investment or trading decisions. Trade at your own risk.

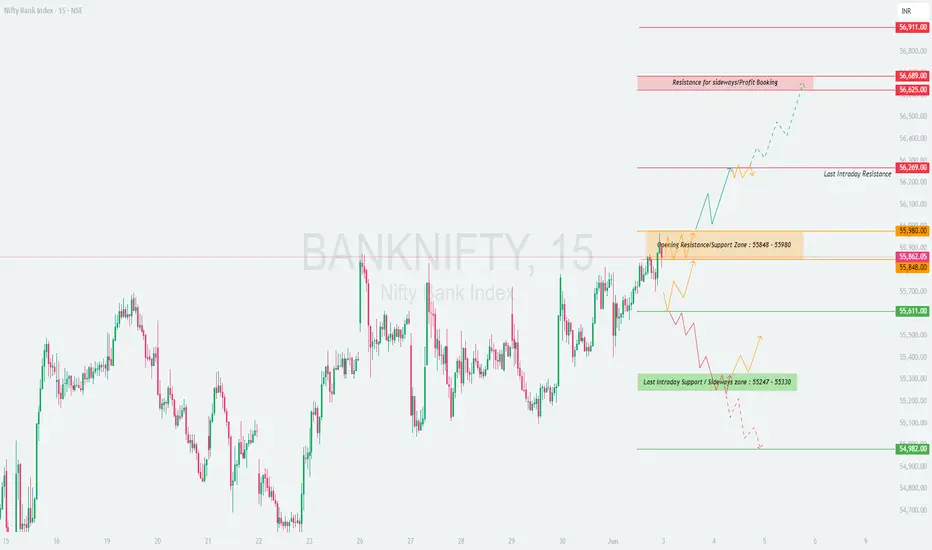
BANKNIFTY : Trading levels and Plan for 03-Jun-2025📘 BANK NIFTY – TRADING PLAN for 03-Jun-2025
🕒 Timeframe: 15-minute Chart Structure
📍 Gap Opening Threshold: 300+ points from previous close of 55,862.05
🔼 GAP-UP OPENING (Above 56,180):
A gap-up beyond 300 points will likely place Bank Nifty near or above the Last Intraday Resistance at 56,269 . This region has historically witnessed profit booking or reversal patterns. If price continues to hold above this resistance, it may aim for the Resistance for Sideways/Profit Booking at 56,625 – 56,689 . Above that lies the final upside target of 56,911.
✅ Plan of Action:
• Wait for 15–30 minutes post-open to confirm sustainability above 56,269.
• If price forms a base and breaks above 56,300 with volume support, look for a breakout trade toward 56,625 – 56,689.
• If rejection is seen at 56,269, with bearish reversal patterns like shooting star / bearish engulfing, consider short trades targeting back to 56,000 – 55,980 with SL above the day’s high.
• Only aggressive breakout buyers may consider continuation trades above 56,689, targeting 56,911, but only after a clear consolidation or retest.
🧠 Educational Insight: In strong gap-ups, always remember: the first move is often emotional. Let structure develop. Avoid chasing strength at known resistance without a base.
⚖️ FLAT OPENING (Between 55,848 – 55,980):
A flat or minor gap open in this zone places price inside the Opening Resistance/Support Zone . This is a zone of indecision, often characterized by choppy price action and traps.
✅ Plan of Action:
• Avoid jumping into trades at the open. Let a clear directional bias form.
• For Long Trades: Wait for a breakout and sustained price action above 55,980, with at least 1–2 bullish candles holding above it. Target would be 56,269, then 56,625.
• For Short Trades: If price fails to sustain above 55,980 and forms lower highs, consider shorts below 55,848, aiming for 55,611, and potentially 55,330 if momentum builds.
• Avoid trading inside this boxy range unless a decisive 15-min candle gives direction.
🧠 Educational Insight: Price in resistance/support zones often consolidates. The smart move is to let the direction emerge and avoid the urge to catch every minor bounce or dip.
🔽 GAP-DOWN OPENING (Below 55,560):
A gap-down of over 300 points will place price below the Last Intraday Support Zone (55,330 – 55,247) , or possibly near the panic support level of 54,982. This area becomes critical for intraday sentiment.
✅ Plan of Action:
• Let the initial panic selling settle in the first 15–30 mins.
• For Reversal Longs: If price reaches 54,982 and shows reversal signs (bullish hammer, engulfing), one can attempt a long scalp toward 55,247 – 55,330, with a tight SL below 54,960.
• For Breakdown Shorts: If price breaks and sustains below 55,247 – 55,330 zone without any signs of demand, you can short with SL above 55,330, for a move towards 54,982 and further if broader markets also remain weak.
• Be ready for false breakdowns in such setups—always rely on candle close confirmation.
🧠 Educational Insight: Gap-downs are often driven by fear or news. Instead of chasing fear, let the market show whether it's real selling or a trap. Trade reactively, not emotionally.
🛡 RISK MANAGEMENT TIPS FOR OPTIONS TRADERS:
✅ 1. Don’t trade the first 5–15 mins on gaps — wait for structure confirmation.
✅ 2. Avoid naked option buying after IV spike on big gaps — prefer spreads or directional futures with hedge.
✅ 3. Use time-based exits — if trade doesn’t move in 20–25 mins after breakout, re-evaluate.
✅ 4. Use proper position sizing — risk only 1–2% of your capital per trade.
✅ 5. Don’t trade breakouts blindly near resistance/support — look for confluence (price + volume + structure).
📊 SUMMARY & CONCLUSION:
• 🟢 Bullish Above: 55,980, Target: 56,269 → 56,625 → 56,911
• 🔴 Bearish Below: 55,848, Target: 55,611 → 55,330 → 54,982
• 🟧 Opening Resistance/Support Zone: 55,848 – 55,980 (Wait for clarity)
• 🟩 Support Zones: 55,330 / 54,982
• 🟥 Resistance Zones: 56,269 / 56,625 / 56,911
• ⏱ Time-based strategy: Let 15–30 mins develop, then decide based on clear structure
✨ Final Thought: Trade what you see, not what you feel. Level-based structure with time confirmation gives the best entries. Avoid emotional trades on gaps.
📢 DISCLAIMER: I am not a SEBI-registered analyst. This trading plan is for educational and informational purposes only. Please consult a SEBI-registered financial advisor before taking any investment or trading decision.
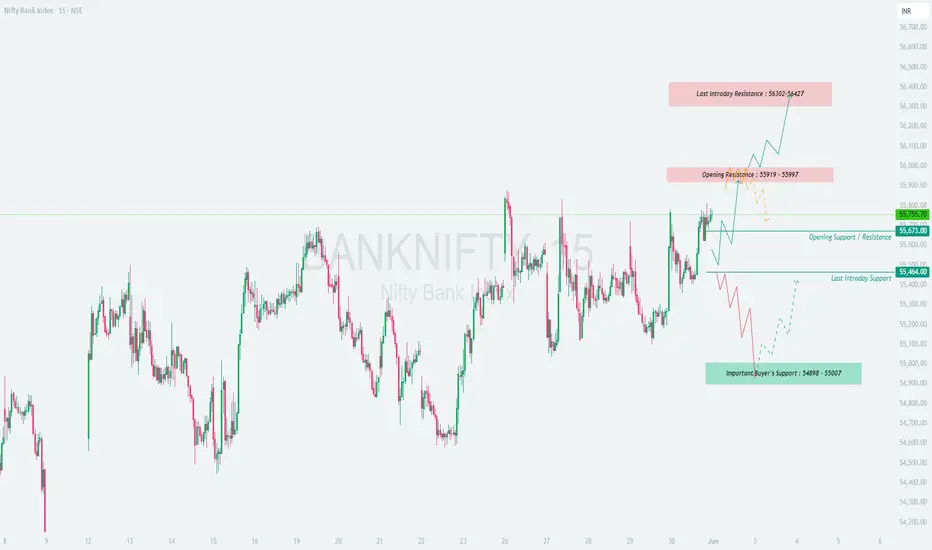
BANKNIFTY : Trading levels and plan for 02-Jun-2025📘 BANK NIFTY – TRADING PLAN for 02-Jun-2025
🕒 Timeframe: 15-minute Chart Structure
📍 Gap Opening Threshold: 200+ points from previous close of 55,755.70
🔼 GAP-UP OPENING (Above 55,997):
If Bank Nifty opens above the Opening Resistance zone (55,919 – 55,997) , the bulls will hold an early advantage. This signals potential breakout strength, but traders must stay cautious of the Last Intraday Resistance (56,302 – 56,427) .
✅ Plan of Action:
• If the opening candle sustains above 55,997, look for bullish price action confirmation (e.g., a strong green candle with follow-through).
• Go long above 55,997 targeting:
→ 56,302 (first resistance)
→ 56,427 (profit-booking zone)
• Stop-loss can be placed just below the breakout candle low or under 55,919 zone.
• Be cautious of exhaustion near 56,302–56,427; if prices spike too fast, avoid fresh longs and wait for pullback/retest.
🧠 Educational Tip: Gap-up breakouts often trap late buyers. Ensure breakout is supported by volume and structure; look for follow-through candles before entering trades.
⚖️ FLAT OPENING (Between 55,673 – 55,919):
A flat open in this neutral zone keeps both breakout and breakdown scenarios alive. The price is likely to consolidate or form a directional move after the first 15–30 minutes.
✅ Plan of Action:
• Watch the upper resistance at 55,919 – 55,997 and lower support near 55,673 – 55,464.
• A break and close above 55,997 can initiate a breakout rally (as discussed above).
• A break and close below 55,673 may lead to a test of lower supports:
→ 55,464 (Last Intraday Support)
→ 55,007 – 54,898 (Major Buyer’s Support Zone)
• Avoid trading within the 55,673–55,919 range unless a clear structure forms (like bullish/bearish engulfing or rejection wicks).
🧠 Educational Tip: During flat openings, most whipsaws occur. Patience is your biggest edge. Let market participants reveal their intent before committing to a direction.
🔽 GAP-DOWN OPENING (Below 55,464):
If Bank Nifty opens more than 200 points lower and breaches the 55,464 level, it signals immediate weakness. Bears may attempt to drag prices down to the strong demand zone at 54,898 – 55,007.
✅ Plan of Action:
• Observe how price reacts at 55,007 – 54,898:
→ If strong bullish reversal candles appear (hammer, bullish engulfing), a long reversal trade may be attempted toward:
• 55,464** (first resistance)
→ If the zone is breached, bearish momentum may accelerate toward deeper levels.
• For aggressive shorts, look for confirmation with a bearish candle below 54,898, targeting lower levels intraday (use tight stop-loss).
• Avoid emotional entries at the open; wait 15–30 mins for structure clarity.
🧠 Educational Tip: Demand zones are best traded on confirmation, not anticipation. Look for price rejection and structure. Don’t catch falling knives without confirmation.
🛡 RISK MANAGEMENT TIPS FOR OPTIONS TRADERS:
✅ Avoid buying far OTM options post-gap openings; stick with near ATM options or spreads.
✅ Use spreads like bull call/bear put spreads to control theta decay, especially if price stalls after the move.
✅ Stick to defined risk per trade (e.g., 1–2% of capital) and don’t double down on losing positions.
✅ Avoid revenge trading if the first trade fails; instead, reassess structure and re-enter only on confirmation.
✅ Always respect stop-loss based on 15-min close , not just spikes or volatility wicks.
📊 SUMMARY & CONCLUSION:
• 🟢 Bullish Scenario: Above 55,997 → Targets: 56,302 / 56,427
• 🔴 Bearish Scenario: Below 55,464 → Targets: 55,007 / 54,898
• 🟧 Neutral Zone: 55,673 – 55,919 → Wait for breakout or breakdown
• 🟩 Support Levels: 55,673 / 55,464 / 54,898
• 🟥 Resistance Levels: 55,919 / 55,997 / 56,427
• 🧠 Key Strategy: Let the first 15–30 minutes unfold. Follow price structure and risk management, not emotions.
✨ Final Word: The best trades come from waiting. Let the chart confirm your bias and stick to your plan.
📢 DISCLAIMER: I am not a SEBI-registered analyst. This trading plan is for educational purposes only. Please consult with a SEBI-registered financial advisor before making any trading or investment decisions.
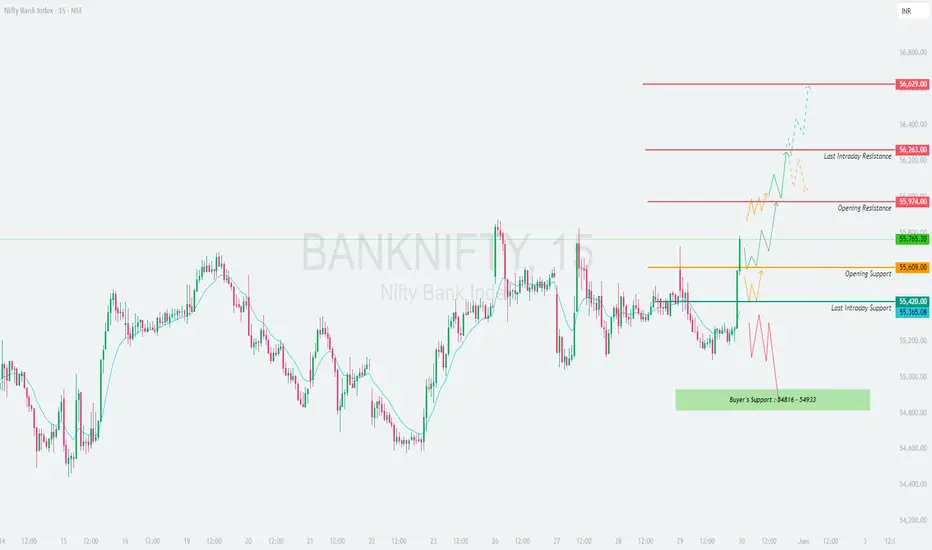
BANKNIFTY : How to trade on 30-May-2025📘 BANK NIFTY – TRADING PLAN for 30-May-2025
📊 Based on 15-min Chart Structure Analysis
📍 Gap Opening Threshold: 200+ points from previous close of 55,765
🔼 GAP-UP OPENING (Above 55,974+):
If Bank Nifty opens above the Opening Resistance zone (55,974+) , it will likely step into bullish continuation territory, with strong momentum carryover from the previous session.
✅ Plan of Action:
• Watch for a 15-min candle close above 55,974 to confirm strength.
• Once confirmed, traders can look for long trades targeting:
→ 56,263 (Last Intraday Resistance)
→ 56,629 (Breakout Extension Target)
• Ideal stop-loss would be just below 55,974, or under the candle that confirms the breakout.
• Be cautious if the index approaches 56,263 quickly after the open — some rejection is likely due to prior supply.
• Trailing SL is crucial as price nears higher resistance zones.
🧠 Educational Tip: Never chase a gap-up move in the first 5 minutes. Let price establish a base or retest breakout level before entry. Momentum needs follow-through volume, not emotion-based entries.
⚖️ FLAT OPENING (Between 55,609 – 55,974):
A flat open between Opening Support (55,609) and Opening Resistance (55,974) keeps the market in a neutral to mildly bullish state.
✅ Plan of Action:
• Avoid trading in the first 15 mins unless there’s clear direction.
• Wait for price to either:
→ Break above 55,974 for long entry (targets: 56,263 → 56,629)
→ Break below 55,609 for short entry (targets: 55,420 → 55,365)
• If Bank Nifty oscillates within this band, treat it as a “No Trade Zone” and wait for range breakout.
• Ideal setup would be a breakout-retest pattern for confirmation and cleaner entry.
🧠 Educational Tip: Consolidation zones often trap both bulls and bears. It’s smarter to sit out and conserve capital than to participate in chop. Precision is more profitable than prediction.
🔽 GAP-DOWN OPENING (Below 55,365):
A significant gap-down of over 200 points may bring the index near the Last Intraday Support (55,365 – 55,420) or even into the Buyer’s Demand Zone: 54,816 – 54,933 .
✅ Plan of Action:
• If Bank Nifty opens around 55,365 – 55,420, look for a bullish reversal pattern. If seen, you may go long with targets:
→ 55,609 (Opening Support Retest)
→ 55,765 (Previous Close)
• A breakdown below 54,933 with 15-min close opens up shorting opportunities toward:
→ 54,816 (Lower Support Edge)
→ 54,630 or lower if panic unfolds
• Avoid shorting right at open. Let the first 15-min candle show whether demand absorbs the selling or not.
• In case of sharp rejection wicks near support, expect a bounce.
🧠 Educational Tip: Demand zones are battlefields. Watch how price reacts to them — does it pierce through or bounce hard? Let the candle tell the story, not your bias.
🛡 RISK MANAGEMENT TIPS FOR OPTIONS TRADERS:
✅ Always wait for 15-min candle confirmation. It filters noise and reduces emotional triggers.
✅ Use spreads (like Bull Call/Bear Put) on event days or high IV environments. It limits losses and defines risk.
✅ Don't average into a losing trade, especially in options. It leads to poor risk-reward and capital drain.
✅ Stick to 1–2 high-quality trades per day. More trades = more exposure to noise.
✅ Book profits near resistance/support levels and trail SL. Greed kills more trades than fear.
✅ Always define a fixed loss limit per day/week. Walk away when it's hit — protect your mental capital.
📊 SUMMARY & CONCLUSION:
• 🟢 Bullish Scenario: Above 55,974 → Targets: 56,263 / 56,629
• 🔴 Bearish Scenario: Below 54,933 → Targets: 54,816 / 54,630
• 🟧 No Trade Zone: Between 55,609 – 55,974 → Wait for breakout
• 🟩 Support Zones: 55,420 / 55,365 / 54,933 / 54,816
• 🟥 Resistance Zones: 55,974 / 56,263 / 56,629
• 🎯 Strategy Focus: React to structure, respect zones, and enter only on confirmation.
✨ Final Thought: The goal is not to trade every move. The goal is to trade high-probability moves with clarity and discipline.
📢 DISCLAIMER: I am not a SEBI-registered analyst. This trading plan is shared purely for educational purposes. Please consult your financial advisor before making any trading or investment decisions. Trade responsibly. 📉📈💼
BANKNIFTY : Trading levels and plan for 29-May-2025📘 BANK NIFTY – TRADING PLAN for 29-May-2025
📈 Based on 15-min chart structure
📍 Gap Opening Threshold: 200+ points from previous close of 55,447
🔼 GAP-UP OPENING (Above 55,696+):
A gap-up opening above 55,696 places Bank Nifty directly above the Opening Resistance Zone (55,208 – 55,467) and into a breakout territory.
✅ Plan of Action:
• Wait for the first 15-min candle to close above 55,696 for confirmation. If sustained, it may indicate fresh bullish momentum.
• You can initiate long trades (Calls/Futures) with targets at:
→ 55,975 (Last Intraday Resistance)
→ 56,299 (Next Upside Zone)
• Ideal stop-loss would be below the breakout candle or under 55,696 .
• Avoid impulsive entries on the very first 5-min candle – let price stabilize.
• If there’s an early rejection near 55,975, partial profit-booking is advised and trailing SL becomes essential.
🧠 Educational Tip: A gap-up above resistance works well only if volume and momentum sustain. Otherwise, traps may form and fadeouts are common.
⚖️ FLAT OPENING (Between 55,208 – 55,467):
A flat open in this No Trade Zone often leads to choppy movement and wicks on both sides.
✅ Plan of Action:
• Wait for either a clear breakout above 55,467 or breakdown below 55,208 with a 15-min candle close.
• Bullish breakout above 55,467 may lead to movement toward 55,696+ .
• Bearish breakdown below 55,208 may push price toward 54,862 → 54,793 .
• Avoid taking trades within this sideways box; false breakouts are common here.
🧠 Educational Tip: Sideways zones are where most traders lose money. Let market give clarity before taking any action.
🔽 GAP-DOWN OPENING (Below 55,000):
A 200+ point gap-down opening will place Bank Nifty near or below the support zone of 54,862 – 54,793.
✅ Plan of Action:
• If Bank Nifty opens near 54,793 – 54,862 , watch this Last Intraday Support zone closely.
→ If it holds and shows bullish reversal (hammer, bullish engulfing), consider long trades for bounce to 55,208 .
• If price breaks and sustains below 54,793 , downside pressure may increase.
→ Target: 54,415 (Next Key Demand Zone)
• Shorting opportunities arise only below 54,793 with 15-min close confirmation and strict SL above breakdown candle.
• Avoid shorting blindly at open – early volatility is high after gap-downs.
🧠 Educational Tip: Major reversals happen from gap-down openings. Don’t assume trend continuation — react to structure.
🛡 RISK MANAGEMENT TIPS FOR OPTIONS TRADERS:
✅ Follow 15-min candle close for confirmations. This helps reduce false entries and noise.
✅ Avoid overtrading inside No Trade Zones. Burnout and losses often happen due to boredom trades.
✅ Use spreads (Bull Call, Bear Put) on volatile days. They help in limiting risk and optimizing returns.
✅ Keep maximum 1–2 trades/day with predefined SL. Overtrading usually leads to emotional mistakes.
✅ Always trail your profits as key levels hit. Lock-in profits as price progresses in your direction.
✅ Never average your losses in options. Respect your SL. Capital protection is the top priority.
📊 SUMMARY & CONCLUSION:
• 🟢 Bullish Above: 55,696 → Target: 55,975 / 56,299
• 🔴 Bearish Below: 54,793 → Target: 54,415
• 🟧 No Trade Zone: 55,208 – 55,467 → Avoid trading until breakout/breakdown
• 🟩 Support Zone: 54,793 – 54,862
• 🟥 Opening Resistance: 55,696
• 🔻 Major Demand Zone: 54,415
✨ Golden Rule: Trade what you see, not what you feel. Stay objective and wait for confirmations.
📢 DISCLAIMER: I am not a SEBI-registered analyst. This trading plan is shared purely for educational purposes. Please consult your financial advisor before making any trading or investment decisions. Trade at your own risk. 📉📈💼

BANKNIFTY : TRADING LEVELS AND PLAN FOR 28-MAY-2025📘 BANK NIFTY TRADING PLAN – 28 MAY 2025
🕒 Based on 15-minute price structure & major zones
📍 Gap Opening Threshold: 200+ points from previous close of 55,352
🔼 GAP-UP Opening (Above 55,552):
If Bank Nifty opens above 55,552+ , it opens beyond the No Trading Zone (55,206 – 55,459) and heads towards Last Intraday Resistance (55,697) .
✅ Plan of Action:
• Let price settle in the first 15–30 minutes. Avoid jumping in immediately.
• If Bank Nifty sustains above 55,697 on a 15-min candle close, initiate long positions (CEs) with potential targets at 55,993 → 56,299 → 56,426 (Profit Booking Zone) .
• If the price struggles near 55,993 with weak momentum, consider booking partial profits or tightening SL.
• A failed breakout above 55,697 that quickly reverses can be a trap — observe for bearish price action before considering reversal trades.
• Ideal pullback entries can come between 55,552 – 55,697 , if retested with bullish confirmation.
🧠 Educational Insight: After a gap-up into resistance, confirmation through volume and candle strength is essential to validate trend continuation. Don't chase blindly.
⚖️ FLAT Opening (Between 55,206 – 55,459):
In this scenario, Bank Nifty opens inside the NO TRADING ZONE (55206 – 55459) .
✅ Plan of Action:
• This is a tricky and uncertain zone — mark it as a NO TRADE ZONE unless a clear breakout or breakdown occurs.
• Wait for a 15-min candle close above 55,459 and then re-entry over 55,552 for a bullish setup targeting 55,697 – 55,993 .
• If price breaks below 55,206 and sustains, bearish bias activates. You can initiate PE entries with downside targets at 54,943 – 54,825 .
• Avoid placing trades within this zone — options premium decay is likely to kill both sides without direction.
🧠 Educational Insight: Sideways or indecisive zones must be avoided for directional trades. Breakouts and retests offer better reliability and risk/reward setups.
🔽 GAP-DOWN Opening (Below 55,152):
If Bank Nifty opens 200+ points lower (below 55,152 ), it's opening beneath the No Trading Zone and potentially closer to Last Intraday Support: 54,943 – 54,825 .
✅ Plan of Action:
• Let the market stabilize and watch how it reacts to the Support Zone (54,943 – 54,825) .
• If this zone holds and a bullish reversal (like hammer, bullish engulfing) appears, a bounce back toward 55,206+ is likely — ideal for intraday CEs with tight SLs.
• A breakdown and sustained trade below 54,825 will activate downside targets toward 54,411 . In such cases, PEs with SL above 54,943 retest can be considered.
• Reversals are common around support zones; don't be the first to jump in short — let price action lead your decision.
🧠 Educational Insight: Support zones are where bears get trapped if not confirmed with breakdown. Confirmation and patience are keys to catching trend continuation.
🛡 RISK MANAGEMENT TIPS FOR OPTIONS TRADERS:
📌 Use 15-min candle close SL – not random stop-losses.
📌 Avoid trading in the first 5–10 minutes unless it’s a clean breakout/breakdown.
📌 Avoid trading inside the No Trading Zone (55206 – 55459) .
📌 Don’t overtrade. Stick to 1–2 high-conviction trades .
📌 For high IV days, consider spreads (Bull Call/Put Spread) instead of naked options.
📌 Always calculate risk-reward ratio ≥ 1:2 before entering.
📌 Stay away from emotional averaging or revenge trading.
📊 SUMMARY & CONCLUSION:
• 🟢 Bullish Above: 55,697 → Targets: 55,993 / 56,299 / 56,426
• 🔴 Bearish Below: 54,825 → Targets: 54,411
• 🟧 No Trade Zone: 55,206 – 55,459
• 🟩 Support Zone: 54,825 – 54,943
• 🟥 Resistance Zone: 55,697 – 55,993
✨ Be patient — let the market come to your levels instead of chasing. Confirmation through candle patterns and volume will increase your success probability. Focus on capital protection above all.
📢 DISCLAIMER: I am not a SEBI-registered analyst. This trading plan is for educational purposes only. Please consult your financial advisor before making any trading or investment decisions. Trade responsibly. 💼📉📈

BANKNIFTY : Trading levels and Plan for 27-May-2025📘 BANK NIFTY TRADING PLAN – 27 MAY 2025
🕰 Based on 15-min chart structure and key support/resistance zones
📍 Gap opening considered if movement is 200+ points from previous close (55,558)
🔼 GAP-UP Opening (Above 55,777 – 200+ points):
If Bank Nifty opens with a strong gap-up above the Last / Opening Resistance Zone (55,745 – 55,777) , it will enter an extended bullish territory.
✅ Plan of Action:
• Avoid aggressive entries in the first 15–30 minutes as volatility can trap buyers.
• If price sustains above 55,777 on a 15-min candle close, we may see a bullish move toward 55,999+ .
• A pullback to retest 55,745–55,777 zone with a strong bullish candle can offer a good long opportunity (buy CE).
• On failure to hold above 55,777 and signs of rejection, scalpers can attempt PE trades targeting 55,558–55,454.
🧠 Educational Tip: Gap-ups into resistance zones require confirmation. Patience for price action saves traders from emotional entries.
⚖️ FLAT Opening (Between 55,454 – 55,745):
A flat opening within this band means Bank Nifty is trading between Opening Support / Resistance (55,454) and Initial Resistance (55,745) .
✅ Plan of Action:
• This is a NO TRADE ZONE initially. Wait for price to break out above 55,745 or break down below 55,454.
• Avoid option buying here – premiums will decay due to time and volatility crush.
• If price breaks above 55,745 with volume and retests successfully, consider CE buying for 55,777 / 55,999 targets.
• If price breaks down below 55,454, we may move to test 55,136–55,225 Buyer’s Support. This can be a scalp PE opportunity.
🧠 Educational Tip: Sideways opens often trap both sides. Let the market reveal its direction before jumping in.
🔽 GAP-DOWN Opening (Below 55,136 – 200+ points):
A gap-down opening below the Buyer’s Support Zone (55,136 – 55,225) would indicate potential weakness.
✅ Plan of Action:
• Watch how price behaves at or near Last Intraday Support – 54,856 .
• If price bounces strongly from 54,856–55,136 area, look for bullish reversal candles for scalping CE.
• Breakdown and 15-min close below 54,856 can intensify selling pressure – can test lower support zones (not marked on chart).
• Avoid aggressive PE entry immediately on open; wait for retest or sideways consolidation to build position.
🧠 Educational Tip: Support zones are where smart money accumulates. Observe candle wicks and volume reactions to time entries.
🛡 RISK MANAGEMENT TIPS FOR OPTIONS TRADERS:
• Always use Stop Loss on candle close basis ; avoid emotional exits.
• Stick to 1–2 trades max in a day. Overtrading kills discipline and capital.
• Avoid chasing premiums right after the opening bell; IV crush and spread wideness can hit you hard.
• Use Option Spreads (Bull Call / Bear Put) to reduce premium decay and risk.
• Don’t trade without a clear setup – Plan your trade, then trade your plan!
📊 SUMMARY & CONCLUSION:
• 🔼 Bullish Breakout Zone: Above 55,777 → Target: 55,999+
• 🔽 Bearish Breakdown Zone: Below 55,136 → Target: 54,856 / lower
• 🟧 Neutral Zone (No Trade Early): 55,454 – 55,745
• 💚 Buyers’ Support Zone: 55,136 – 55,225
• 🟥 Sellers’ Resistance Zone: 55,745 – 55,777
📌 Be flexible but not reckless. Observe the structure, respond with discipline. Great trades come from waiting, not chasing.
📢 DISCLAIMER: I am not a SEBI-registered analyst. The above plan is purely for educational purposes. Please consult your financial advisor before making any investment decisions. Trade wisely. 💼📉📈
