BANKNIFTY : Detailed Trading plan for 10-Feb-2026📘 BANKNIFTY Trading Plan – 10 Feb 2026
(Timeframe: 15-Min | Instrument: BANKNIFTY | Educational Purpose Only)
🔑 Key Intraday Levels (From Chart)
🟢 61,312 – Last Intraday Resistance
🟢 60,800 – Upper Resistance Band
🟠 60,705 – 60,799 – Opening Support / Resistance Zone
🟢 60,589 – Opening Support
🟢 60,430 – Last Intraday Support
🟢 60,291 – Major Breakdown Support
🧠 Market Structure & Price Psychology
BANKNIFTY has shown a strong recovery from lower levels, forming a short-term higher-low structure.
However, price is now approaching a key supply band near 60,700 – 60,800, where profit booking can emerge.
👉 Direction on 10 Feb will depend on acceptance above supply or rejection back into support.
🚀 Scenario 1: GAP UP Opening (200+ Points)
(Opening near / above 60,750 – 60,850)
🧠 Psychology
A large gap up reflects overnight bullish sentiment + short covering, but institutions often sell near prior resistance.
🟢 Bullish Plan
🔵 Sustaining above 60,800 on 15-min close
🔵 Upside opens towards 61,312
🔵 Break & hold above → Momentum continuation
🔴 Rejection Plan
🔴 Failure to sustain above 60,800
🔴 Pullback towards 60,705 → 60,589
📌 Why this works
True breakouts require price acceptance, not emotional gap-up spikes.
➖ Scenario 2: FLAT Opening
(Opening between 60,550 – 60,700)
🧠 Psychology
Flat opening inside supply indicates indecision & liquidity absorption.
🟠 Decision Zone
🔸 60,705 – 60,799
🔸 Expect whipsaws until breakout
🟢 Upside Plan
🔵 Break & hold above 60,800
🔵 Targets: 61,312
🔴 Downside Plan
🔴 Breakdown below 60,589
🔴 Drift towards 60,430 → 60,291
📌 Why this works
Consolidation resolves with expansion — patience gives clarity.
🔻 Scenario 3: GAP DOWN Opening (200+ Points)
(Opening near / below 60,430)
🧠 Psychology
Gap down signals profit booking or fear selling, but demand zones can trigger relief rallies.
🟢 Bounce Setup
🔵 If 60,430 holds on 15-min basis
🔵 Expect bounce towards 60,589 → 60,705
🔴 Breakdown Setup
🔴 Clean break below 60,291
🔴 Downside momentum may accelerate
📌 Why this works
Strong supports either create sharp reversals or fast continuation breakdowns.
🛡️ Risk Management Tips (Options Traders)
🟢 Trade only after first 15-min candle confirmation
🟢 Prefer defined-risk option spreads
🟢 Avoid aggressive buying near resistance ❌
🟢 Risk maximum 1–2% capital per trade
🟢 Book partial profits at key levels
🟢 Discipline > Prediction 📌
🧾 Summary & Conclusion
📌 BANKNIFTY is in post-recovery consolidation near supply
📌 60,800 & 60,589 are key intraday triggers
📌 Break above 61,312 confirms bullish continuation
📌 Trade price reaction, not bias 📈
⚠️ Disclaimer
This analysis is strictly for educational purposes only.
I am not a SEBI registered analyst.
Please consult your financial advisor before taking any trades.
Market investments are subject to risk.
Bankniftyview

BANKNIFTY : Trading levels and Plan for 05-Feb-2026📘 BANKNIFTY Trading Plan – 5 Feb 2026
(Timeframe: 15-Min | Instrument: BANKNIFTY | Educational Purpose Only)
🔑 Key Intraday Levels (From Chart)
🟢 61,356 – Higher Timeframe Resistance
🟢 60,812 – Last Intraday Resistance
🟠 60,492 – Opening Resistance
🟠 60,120 – Opening Support / Resistance Pivot
🟢 59,754 – 59,826 – Last Intraday Support Zone
🟢 59,130 – Major Breakdown Support
🧠 Market Structure & Price Psychology
BANKNIFTY has shown a strong recovery bounce from lower levels and is now consolidating in a rising structure.
This suggests short covering + gradual fresh buying, but price is still approaching major supply zones above.
👉 Direction on 5 Feb will depend on acceptance or rejection near opening pivot levels, not emotional bias.
🚀 Scenario 1: GAP UP Opening (200+ Points)
(Opening near / above 60,350 – 60,450)
🧠 Psychology
A large gap up reflects bullish overnight sentiment, often driven by short covering. But resistance zones attract institutional selling.
🟢 Bullish Plan
🔵 If price sustains above 60,492 (15-min close)
🔵 Upside opens towards 60,812
🔵 Break & hold above 60,812 → Expansion towards 61,356
🔴 Rejection Plan
🔴 Failure to hold 60,492
🔴 Pullback towards 60,120 pivot
📌 Why this works
True breakouts require price acceptance — not just gap-up spikes.
➖ Scenario 2: FLAT Opening
(Opening between 60,000 – 60,250)
🧠 Psychology
Flat opening inside consolidation reflects indecision. Market seeks liquidity before directional move.
🟢 Upside Plan
🔵 Break & hold above 60,492
🔵 Targets: 60,812 → 61,356
🔴 Downside Plan
🔴 Breakdown below 60,120
🔴 Drift towards 59,826 – 59,754
📌 Key Note
🟠 60,120 acts as intraday pivot — watch price behavior closely.
🔻 Scenario 3: GAP DOWN Opening (200+ Points)
(Opening near / below 59,826)
🧠 Psychology
Gap down indicates profit booking or renewed fear, but strong supports often trigger short covering.
🟢 Bounce Setup
🔵 If 59,754 – 59,826 holds
🔵 Expect pullback towards 60,120 → 60,492
🔴 Breakdown Setup
🔴 Break below 59,754
🔴 Downside opens towards 59,130
📌 Why this works
Demand zones either produce fast reversals or accelerated breakdowns.
🛡️ Risk Management Tips (Options Traders)
🟢 Trade only after first 15-min candle confirmation
🟢 Prefer defined-risk spreads in gap markets
🟢 Avoid aggressive buying near resistance ❌
🟢 Risk max 1–2% capital per trade
🟢 Book partial profits at next levels
🟢 Discipline > Prediction 📌
🧾 Summary & Conclusion
📌 BANKNIFTY is in recovery + consolidation phase
📌 60,492 & 60,120 are key intraday decision levels
📌 Break above 60,812 confirms bullish continuation
📌 Trade price reaction, not assumptions 📈
⚠️ Disclaimer
This analysis is strictly for educational purposes only.
I am not a SEBI registered analyst.
Please consult your financial advisor before taking any trades.
Market investments are subject to risk.

BANKNIFTY : Trading levels and Plan for 03-Feb-2026📘 BANKNIFTY Trading Plan – 3 Feb 2026
(Timeframe: 15-Min | Instrument: BANKNIFTY | Educational Purpose Only)
🔑 Key Intraday Levels (From Chart)
🟢 60,367 – Higher Timeframe Resistance
🟢 59,574 – Last Intraday Resistance
🟠 58,922 – Opening Support / Resistance (Decision Level)
🟢 58,232 – Opening Support (Gap-Down Case)
🟢 57,973 – Last Intraday Support
🧠 Market Structure & Price Psychology
BANKNIFTY witnessed a sharp sell-off followed by a recovery bounce, indicating short covering from lower levels.
However, price is still trading below major resistance, so trend reversal is not confirmed yet.
👉 Tomorrow’s direction will depend on acceptance or rejection at opening levels, not assumptions.
🚀 Scenario 1: GAP UP Opening (200+ Points)
(Opening near / above 58,900)
🧠 Psychology
A big gap up after a fall usually signals short covering, but higher zones still carry institutional selling pressure.
🟢 Bullish Plan
🔵 If price sustains above 58,922 on a 15-min closing basis
🔵 Expect move towards 59,574
🔵 Break & acceptance above 59,574 can open path towards 60,367
🔴 Rejection Plan
🔴 Failure to sustain above 58,922
🔴 Expect pullback or consolidation towards 58,232
📌 Why this works
Only acceptance above resistance confirms fresh buying, not emotional gap-up trades.
➖ Scenario 2: FLAT Opening
(Opening between 58,500 – 58,800)
🧠 Psychology
Flat opens indicate balance between buyers and sellers. Market often expands after testing key levels.
🟢 Upside Plan
🔵 Acceptance above 58,922
🔵 Targets: 59,574 → 60,367
🔴 Downside Plan
🔴 Failure to cross 58,922
🔴 Drift towards 58,232
📌 Key Note
🟠 Expect range-bound movement until breakout or breakdown confirmation.
🔻 Scenario 3: GAP DOWN Opening (200+ Points)
(Opening near / below 58,232)
🧠 Psychology
Gap down reflects renewed fear & panic selling. Strong supports decide whether bounce or continuation happens.
🟢 Bounce Setup
🔵 If 58,232 holds on a 15-min basis
🔵 Expect short-covering bounce towards 58,922
🔴 Breakdown Setup
🔴 Clean break below 57,973
🔴 Downside momentum may accelerate sharply
📌 Why this works
Strong supports either give fast bounces or aggressive breakdowns—confirmation is key.
🛡️ Risk Management Tips (Options Traders)
🟢 Trade only after first 15-min candle confirmation
🟢 Prefer defined-risk option spreads in volatile moves
🟢 Avoid aggressive buying during gap-up opens ❌
🟢 Risk maximum 1–2% of total capital per trade
🟢 Book partial profits at pre-defined resistance/support
🟢 Discipline > Prediction 📌
🧾 Summary & Conclusion
📌 BANKNIFTY remains volatile and reactive
📌 58,922 & 58,232 are the most important intraday decision levels
📌 Break above 59,574 needed for bullish continuation
📌 Trade price reaction, not market noise 📈
⚠️ Disclaimer
This analysis is strictly for educational purposes only.
I am not a SEBI registered analyst.
Please consult your financial advisor before taking any trades.
Market investments are subject to risk.

BANKNIFTY : Intraday Trading levels and Plan for 23-Jan-2026📘 BANK NIFTY Trading Plan – 23 Jan 2026
Timeframe: 15-Minute
Gap Consideration: 100+ points
Market Structure: Short-term pullback within a volatile range, key decision zones clearly defined
🔼 SCENARIO 1: GAP UP OPENING (100+ points) 🚀
If Bank Nifty opens above the previous close with a strong gap-up, price action near resistance becomes crucial.
Opening Resistance / Consolidation Zone: 59,635 – 59,765
This zone may act as supply as it aligns with prior rejection and intraday selling pressure.
Bullish Continuation:
Sustained 15-min close above 59,765 signals strength → upside extension towards 60,000.
Rejection Setup:
Failure to hold above 59,635 may lead to pullback towards the flat opening range.
Options Strategy:
Bull Call Spread (Buy ATM CE + Sell OTM CE) to reduce theta risk.
➡️ SCENARIO 2: FLAT / RANGE OPENING ⚖️
A flat open indicates indecision; patience is key.
No-Trade / Chop Zone: 59,197 – 59,412
Expect whipsaws and option premium decay.
Bullish Bias:
Acceptance above 59,412 → targets 59,635 → 59,765.
Bearish Bias:
Breakdown below 59,197 → drift towards 58,923.
Options Strategy:
Short Strangle / Iron Condor only if price remains inside range with strict SL.
🔽 SCENARIO 3: GAP DOWN OPENING (100+ points) 📉
A gap-down open tests buyer strength immediately.
Opening Support (Gap Down Case): 58,923
First reaction zone for buyers.
Intraday Support Breakdown:
Below 58,923 → increased probability of move towards 58,501 – 58,577.
Pullback Short Setup:
If price retests 59,197 and rejects, short continuation trades are favored.
Options Strategy:
Bear Put Spread (Buy ATM PE + Sell lower strike PE) to cap risk.
🛡️ OPTIONS RISK MANAGEMENT TIPS 🧠
Avoid naked option buying near no-trade zones.
Use spreads to control theta decay.
Risk only 1–2% of capital per trade.
Book partial profits quickly in volatile markets.
No revenge trades after SL hit.
📌 SUMMARY & CONCLUSION ✨
59,197 – 59,412 remains the key decision zone.
Directional trades only after clear acceptance or rejection.
Gap days demand discipline, not aggression.
Let price confirm, then execute with defined risk.
⚠️ DISCLAIMER
This analysis is for educational purposes only. I am not a SEBI registered analyst. Markets are risky, and trades can go wrong. Please consult your financial advisor before trading. 🙏

BANKBARODA Weekly Bullish Flag Breakout | Multiple Targets to 34BANKBARODA (Bank of Baroda Limited) – Weekly Analysis
━━━━━━━━━━━━━━━━━━━━━━━━━━━━━━━━━━━━━━━━━━━
📊 TECHNICAL SETUP
Current Price: 305.05 (+1.43%)
Timeframe: Weekly (1W)
Symbol: BANKBARODA (Bank of Baroda Limited)
Exchange: NSE
Category: Stock / PSU Banking Sector
━━━━━━━━━━━━━━━━━━━━━━━━━━━━━━━━━━━━━━━━━━━
🎯 PATTERN ANALYSIS
BANKBARODA demonstrates a STRONG WEEKLY BULLISH FLAG BREAKOUT pattern:
✅ Flag Structure: Clear flagpole followed by tight consolidation in the 295–305 range
✅ Breakout Confirmation: Price decisively breaking above upper flag boundary on strong weekly candles
✅ Support Levels: Strong support identified at 299.80 with SL at 278.00 for risk management
✅ Volume Profile: Visible volume participation on the breakout confirming institutional interest
✅ Momentum: Sustained bullish momentum with stock now trading above consolidation levels
✅ Risk/Reward: Well-defined multi-target setup with excellent risk-reward ratio and extended upside potential
The stock shows textbook uptrend characteristics with proper support/resistance relationships, confirming the bullish flag breakout is a continuation pattern with multiple profit-taking opportunities.
━━━━━━━━━━━━━━━━━━━━━━━━━━━━━━━━━━━━━━━━━━━
📈 PRICE TARGETS (Progressive Levels)
1st Target: 302.35 (-0.8% from current - immediate resistance)
2nd Target: 308.90 (+1.3% from current)
3rd Target: 312.45 (+2.4% from current)
4th Target: 322.00 (+5.5% from current)
5th Target: 328.55 (+7.7% from current)
6th Target: 335.10 (+9.9% from current)
7th Target: 341.70 (+12.0% from current)
Final Target: 346.75 (+13.6% from current)
These progressive targets represent key resistance zones and profit-taking levels along the uptrend trajectory. Each target should be treated as a potential decision point for scaling profits while maintaining exposure to further upside. The extended target structure suggests strong upside potential with multiple stepping stones for systematic profit realization.
━━━━━━━━━━━━━━━━━━━━━━━━━━━━━━━━━━━━━━━━━━━
🛡️ RISK MANAGEMENT
Entry Zone: 299.80 (Breakout confirmation point - primary entry level after flag breakout)
Stoploss: 278.00 (Weekly support - critical invalidation level marked as "SL on WCB")
Risk/Reward Ratio:
Risk (299.80 to 278.00) = 21.80 points
Reward (299.80 to 346.75) = 46.95 points
R:R Ratio = 1:2.15 (Excellent)
Position Sizing: Risk only 1-2% of capital per trade
Stoploss is placed BELOW major weekly support level to ensure proper risk containment.
Consider scaling in on dips toward the 299.80 entry zone for better average entries.
━━━━━━━━━━━━━━━━━━━━━━━━━━━━━━━━━━━━━━━━━━━
📍 KEY SUPPORT & RESISTANCE
Immediate Support: 299.80 (Breakout/Buy zone - initial entry opportunity)
Secondary Support: 278.00 (Stoploss / Major weekly support - invalidation zone)
Resistance 1: 302.35 (1st Target - immediate resistance)
Resistance 2: 312.45 (3rd Target - mid-term resistance)
Resistance 3: 328.55 (5th Target)
Major Resistance: 346.75 (Final Target / Extended upside potential)
Intermediate Levels: Multiple targets provide stepping stones for profit realization at each resistance level, allowing systematic position management and partial profit booking throughout the uptrend.
━━━━━━━━━━━━━━━━━━━━━━━━━━━━━━━━━━━━━━━━━━━
🔍 FUNDAMENTAL BACKDROP – PSU BANKING STRENGTH
BANKBARODA benefits from strong macro tailwinds in PSU banking:
✅ Deposit Growth: PSU banks showing solid deposit growth momentum with CASA ratios stabilizing and improving
✅ Cost of Deposits: Lower-cost deposit mobilization supporting margin expansion opportunities across the sector
✅ Asset Quality: Improving asset quality metrics with NPA reduction initiatives showing consistent progress
✅ Dividend Support: PSU bank dividend yields provide downside cushion and attractive income support
✅ Policy Tailwinds: Government support for PSU banking system and continued credit expansion initiatives
✅ Valuation Appeal: Trading at attractive valuations relative to private sector banks with strong dividend yield support
✅ Credit Growth: Benefiting from broader credit growth acceleration and economic expansion across industries
This macro backdrop combined with strong technical structure reinforces bullish conviction for trend-following strategies on dips.
━━━━━━━━━━━━━━━━━━━━━━━━━━━━━━━━━━━━━━━━━━━
🎉 TECHNICAL OBSERVATIONS
Weekly uptrend remains intact with clear higher highs and higher lows forming
Flag breakout on volume confirms institutional participation and buying strength
Stock breaking above consolidation levels — a classic sign of strength in PSU banking space
Breakout from a tight consolidation pattern shows disciplined buying entering the stock
Multiple targets (8 levels) suggest strong extended upside with multiple resistance zones ahead
Proper risk/reward of 1:2.15 offers excellent entry/exit structure for positional traders
Support at 278.00 provides good risk management anchor with well-defined stop placement
Stock positions itself well for continued upside exploration across multiple target levels
Volume profile supports the breakout move on the technical structure
Extended target range indicates potential for multi-week uptrend
━━━━━━━━━━━━━━━━━━━━━━━━━━━━━━━━━━━━━━━━━━━
💡 TRADING STRATEGY NOTES
✓ Wait for weekly close above 299.80 before committing to fresh positions (confirmation is key)
✓ Consider scaling entries — don't go all-in at once; build position gradually on any dips
✓ Trail stoploss after each target level is achieved and confirmed on weekly basis
✓ Take partial profits at each resistance level — especially at 2nd, 4th, 6th, and final targets
✓ Preserve capital: Use strict position sizing and risk management (1-2% risk per trade)
✓ Monitor weekly closes carefully — price action at week-end is crucial for momentum confirmation
✓ Watch for gaps and opening levels — sudden reversals or news-driven moves can invalidate pattern
✓ BANKBARODA is a PSU bank with strong dividend yield — suitable for positional traders and value-conscious investors
✓ The extended target range suggests patience may be rewarded with multi-week uptrend potential
━━━━━━━━━━━━━━━━━━━━━━━━━━━━━━━━━━━━━━━━━━━
⚠️ CRITICAL DISCLAIMER
🔴 THIS IS TECHNICAL ANALYSIS FOR EDUCATIONAL PURPOSES ONLY
🔴 THIS IS NOT FINANCIAL ADVICE OR AN INVESTMENT RECOMMENDATION
This analysis:
Is based on historical price patterns and technical indicators
Does NOT constitute investment advice or a buy/sell recommendation
Is a personal observation and technical analysis only
Should NOT be the sole basis for any investment decision
Stock performance depends on multiple macroeconomic factors and banking sector dynamics
━━━━━━━━━━━━━━━━━━━━━━━━━━━━━━━━━━━━━━━━━━━
⚠️ IMPORTANT RISKS TO UNDERSTAND
✓ Past performance does NOT guarantee future results
✓ Technical patterns can FAIL and trends can reverse suddenly
✓ Market conditions can change rapidly without warning
✓ This analysis is based on historical data only
✓ Stock investments carry significant risk of loss
✓ You may lose your ENTIRE investment amount
✓ This is a technical observation, NOT a guaranteed strategy
✓ Consult a qualified financial advisor before trading
✓ Do your own independent research (DYOR) before investing
✓ Use strict position sizing and risk management always
✓ Interest rate changes can impact banking sector sentiment
✓ Regulatory changes affecting PSU banks can affect valuations
✓ Market liquidity and volatility can impact execution and slippage
✓ Economic indicators and quarterly earnings can invalidate technical patterns
✓ Credit growth slowdowns can impact bank profitability
✓ Extended uptrend targets may take longer to achieve or may not be fully realized
━━━━━━━━━━━━━━━━━━━━━━━━━━━━━━━━━━━━━━━━━━━
🔴 FINAL RISK ACKNOWLEDGMENT
TRADING AND INVESTING IN STOCKS INVOLVES SUBSTANTIAL RISK OF LOSS.
I am NOT a financial advisor, fund manager, or investment professional. This analysis is provided for educational purposes and personal trading observation only. Past patterns do not guarantee future performance.
BEFORE MAKING ANY INVESTMENT DECISION:
✓ Conduct your own thorough research and due diligence
✓ Understand macroeconomic factors affecting banking sector
✓ Check interest rate trends and RBI monetary policy outlook
✓ Review latest quarterly earnings and asset quality metrics
✓ Verify your risk appetite and capital availability
✓ Consult with a qualified, SEBI-registered financial advisor
✓ Only invest capital you can afford to lose completely
✓ Never follow this as a guaranteed strategy or signal
✓ Understand leverage implications if using derivatives or F&O
✓ Extended target ranges require patient capital and disciplined risk management
Your investment decisions are YOUR responsibility. Use proper risk management, stop losses, and position sizing always. Only risk capital you can afford to lose.
━━━━━━━━━━━━━━━━━━━━━━━━━━━━━━━━━━━━━━━━━━━
Trade responsibly. Risk management is paramount.

BANKNIFTY : Trading levels and Plan for 30-Dec-2025📘 BANK NIFTY Trading Plan for 30-Dec-2025
(Timeframe: 15-min | Gap criteria considered: 200+ points)
Key Levels to Track (from chart)
Major Upside Resistance: 59,334
Last Intraday Resistance (Supply Zone): 59,179
Opening Resistance: 59,107
Opening Support / Resistance (Pivot): 58,895
Opening Support: 58,800
Last Intraday Support: 58,712
Lower Support (Extreme): 58,459
Deep Support: 58,259
🟢 1. GAP-UP OPENING (200+ Points)
If BANK NIFTY opens above 59,107, price starts near a resistance cluster.
🎓 Educational Explanation:
Large gap-ups often invite early profit booking, especially near supply zones. Sustainable upside needs acceptance above resistance or a pullback-and-hold. Chasing the first candle usually offers poor risk-reward.
Plan of Action:
Avoid the first 10–15 minutes; observe acceptance above 59,107.
If price holds above 59,107, look for pullback-based longs.
Upside hurdles: 59,179; strong acceptance can extend to 59,334.
Rejection near 59,179–59,334 may pull price back toward 59,107.
Options: Prefer ATM / ITM Calls after confirmation; avoid chasing far OTM CE.
🟡 2. FLAT OPENING
A flat open around 58,900–59,000 keeps price near the pivot (58,895).
🎓 Educational Explanation:
Flat opens signal balance. Direction usually emerges after a clean break of the opening range. Trading inside the balance zone often leads to whipsaws and theta decay.
Plan of Action:
Sustaining above 59,107 shifts bias bullish toward 59,179.
Failure to cross 59,107 keeps price range-bound.
Breakdown below 58,895 increases downside risk toward 58,800.
Watch for bullish rejection near 58,895–58,800 for bounce setups.
🔴 3. GAP-DOWN OPENING (200+ Points)
If BANK NIFTY opens below 58,895, early sentiment turns cautious to bearish.
🎓 Educational Explanation:
Gap-downs are often emotion-driven. Strong supports attract short-covering and value buying, so selling blindly into support increases reversal risk.
Plan of Action:
First support to watch: 58,800 — observe candle structure and volume.
Breakdown and acceptance below 58,800 opens downside toward 58,712.
Failure to hold 58,712 exposes 58,459, and then 58,259.
Any pullback toward 58,895 after breakdown can be used as sell-on-rise.
⚙️ Risk Management Tips for Options Trading 🛡️
Avoid trading the first 5–10 minutes on 200+ point gap days.
Don’t buy options at resistance or sell at support without confirmation.
Use a time-based stop-loss (15–20 minutes) if premium doesn’t move.
Risk only 1–2% of total capital per trade.
Prefer ATM options or defined-risk spreads to manage theta decay.
Book partial profits near marked resistance/support levels.
🧾 Summary & Conclusion
Above 59,107: Bulls active; watch 59,179 → 59,334 for continuation/rejection.
Between 58,895–59,107: Market balanced; patience required.
Below 58,895: Sellers gain control unless buyers defend 58,800 / 58,712.
Trade price behaviour at levels, not predictions.
Consistency comes from discipline, confirmation, and risk control.
⚠️ Disclaimer
I am not a SEBI-registered analyst. This trading plan is for educational purposes only and should not be considered financial or investment advice. Please consult your financial advisor before taking any trades.

BANKNIFTY : Trading levels and Plan for 29-Dec-2025📘 BANK NIFTY Trading Plan for 29-Dec-2025
(Timeframe: 15-min | Gap criteria considered: 200+ points)
Key Levels to Track (from chart)
Last Intraday Resistance: 59,364
Opening Resistance (Gap-up case): 59,211
No-Trade / Balance Zone: 58,894 – 59,108
Opening Support (Gap-down case): 58,799
Last Intraday Support: 58,661
🟢 1. GAP-UP OPENING (200+ Points)
If BANK NIFTY opens well above 59,211, price will start near a known supply area.
🎓 Educational Explanation:
A 200+ point gap-up usually reflects strong overnight sentiment. However, when price opens near resistance, early profit booking by smart money is common. Sustainable upside requires acceptance above resistance, not just a spike.
Plan of Action:
Avoid trading the first 10–15 minutes; observe acceptance above 59,211.
If price holds above 59,211, look for pullback-based long entries.
First upside hurdle is 59,364 (last intraday resistance).
Acceptance above 59,364 may open higher targets.
Rejection near 59,364 can trigger a pullback toward 59,211.
🟡 2. FLAT OPENING
A flat open near 58,950–59,050 places price inside the No-Trade / Balance Zone.
🎓 Educational Explanation:
Flat openings indicate equilibrium between buyers and sellers. In such zones, price often whipsaws and option premiums decay quickly. Direction usually emerges only after a clear break from the range.
Plan of Action:
Stay patient while price remains inside 58,894–59,108.
Sustaining above 59,108 shifts bias bullish toward 59,211.
Breakdown below 58,894 increases downside risk toward 58,799.
Trade only after confirmation; avoid overtrading the range.
🔴 3. GAP-DOWN OPENING (200+ Points)
If BANK NIFTY opens below 58,894, early sentiment turns clearly weak.
🎓 Educational Explanation:
Large gap-downs are often driven by panic. However, strong support zones attract short covering and value buying. Selling blindly into support increases the risk of sharp reversals.
Plan of Action:
First support to monitor is 58,799 (gap-down opening support).
Breakdown and acceptance below 58,799 opens downside toward 58,661.
Strong bullish rejection near 58,661 may lead to a sharp intraday bounce.
Any pullback toward 58,894 after breakdown can be used as a selling-on-rise opportunity.
⚙️ Risk Management Tips for Options Trading 🛡️
Avoid trading the first 5–10 minutes on gap days.
Do not buy options at resistance or sell at support without confirmation.
Use a time-based stop-loss (15–20 minutes) if premium does not move.
Risk only 1–2% of total capital per trade.
Prefer ATM options or defined-risk spreads to manage theta decay.
Book partial profits near marked resistance/support levels.
🧾 Summary & Conclusion
Above 59,211: Bulls stay active; watch 59,364 for continuation or rejection.
Between 58,894–59,108: Market remains range-bound; patience is key.
Below 58,894: Sellers gain control unless buyers defend 58,799 / 58,661.
Focus on price behaviour at predefined levels, not predictions.
Consistency comes from discipline, confirmation, and risk control.
⚠️ Disclaimer
I am not a SEBI-registered analyst. This trading plan is for educational purposes only and should not be considered financial or investment advice. Please consult your financial advisor before taking any trades.

BANKNIFTY : Trading levels and Plan for 26-Dec-2025📘 BANK NIFTY Trading Plan for 26-Dec-2025
(Chart reference: 15-min | Gap criteria considered: 200+ points)
Key Levels to Track (from chart)
Major Upside Supply Zone: 59,573 – 59,663
Last Intraday Resistance: 59,401
Opening Resistance: 59,296
Opening Support: 59,107
Last Intraday Support: 58,896
Lower Support (Extreme): 58,645
🟢 1. GAP-UP OPENING (200+ Points)
If BANK NIFTY opens above 59,296, price enters a resistance-heavy zone where supply may appear.
🎓 Educational Explanation:
A 200+ point gap-up usually reflects strong overnight cues. However, opening near resistance often invites profit booking. Healthy continuation typically needs acceptance above resistance or a pullback-and-hold before moving higher.
Plan of Action:
If price sustains above 59,296 for 10–15 minutes, look for pullback-based long entries.
First upside hurdle is 59,401; observe volume and candle acceptance.
Acceptance above 59,401 can extend toward the 59,573–59,663 supply zone.
Rejection near 59,401–59,663 may trigger a pullback toward 59,296.
Option buyers should avoid chasing CE at the open; confirmation improves R:R.
🟡 2. FLAT OPENING
A flat open near 59,200–59,260 keeps BANK NIFTY inside a balance area.
🎓 Educational Explanation:
Flat opens indicate equilibrium between buyers and sellers. Direction usually emerges only after the opening range is broken. Trading inside the range without confirmation often leads to whipsaws.
Plan of Action:
Sustaining above 59,296 shifts momentum bullish, targeting 59,401.
Failure to cross 59,296 keeps price vulnerable to a pullback.
Breakdown below 59,107 signals weakness toward 58,896.
Bullish rejection near 59,107 can offer a low-risk bounce trade.
🔴 3. GAP-DOWN OPENING (200+ Points)
If BANK NIFTY opens below 59,107, early sentiment turns weak.
🎓 Educational Explanation:
Large gap-downs are often emotion-driven. Strong demand zones can attract short-covering and value buying. Selling blindly into support increases the risk of sharp reversals.
Plan of Action:
First support to watch is 58,896 — observe price behaviour and candle structure.
Breakdown below 58,896 opens the downside toward 58,645.
Strong bullish reversal near 58,645 may lead to a sharp intraday bounce.
Any pullback toward 59,107 after a breakdown can be used as a selling-on-rise opportunity.
⚙️ Risk Management Tips for Options Traders 🛡️
Avoid trading the first 5–10 minutes during 200+ point gap days.
Don’t buy options at resistance or sell at support without confirmation.
Use a time-based stop-loss (15–20 minutes) if premium doesn’t move.
Risk only 1–2% of total capital per trade.
Prefer ATM options or defined-risk spreads to manage theta decay.
Book partial profits near marked resistance/support levels.
🧾 Summary & Conclusion
Above 59,296: Bulls stay active; targets 59,401 → 59,573–59,663.
Between 59,107–59,296: Market remains range-bound; patience required.
Below 59,107: Sellers gain control unless buyers defend 58,896 / 58,645.
Trade price behaviour at levels, not predictions.
Consistency comes from discipline, confirmation, and risk control.
⚠️ Disclaimer
I am not a SEBI-registered analyst. This trading plan is for educational purposes only and should not be considered financial or investment advice. Please consult your financial advisor before taking any trades.

BANKNIFTY : Trading levels and Plan for 23-Dec-2025BANK NIFTY Trading Plan for 23-Dec-2025
(Chart reference: 15-min | Gap criteria considered: 200+ points)
Key Levels from Chart
Opening Resistance / Pivot: 59,349
Last Intraday Resistance: 59,632
Major Upside Resistance: 59,746
Opening Support Zone: 59,136 – 59,192
Last Intraday Support: 59,054
Lower Support: 58,857
🟢 1. GAP-UP OPENING (200+ Points)
If BANK NIFTY opens above 59,349, price will immediately face a critical supply and decision zone.
🎓 Educational Explanation:
A 200+ point gap-up usually reflects strong overnight cues, but opening near resistance often invites profit booking by smart money. Sustainable rallies happen only when price accepts above resistance, not just spikes above it.
Plan of Action:
If price sustains above 59,349 for 10–15 minutes, look for pullback-based long entries.
Upside momentum can extend toward 59,632, the last intraday resistance.
Acceptance above 59,632 opens the path toward 59,746 (major supply).
Strong rejection or exhaustion near 59,632–59,746 can trigger a pullback toward 59,349.
Option buyers should avoid chasing CE at the open; confirmation and retest are mandatory.
🟡 2. FLAT OPENING
A flat open near 59,250–59,320 keeps BANK NIFTY inside a consolidation zone.
🎓 Educational Explanation:
Flat openings indicate balanced order flow. In such conditions, institutions wait for liquidity before committing. Direction emerges only after a clear break of the opening range.
Plan of Action:
Sustaining above 59,349 shifts momentum in favour of buyers, targeting 59,632.
Failure to cross 59,349 keeps price vulnerable to pullback moves.
Breakdown below 59,136 signals weakness toward 59,054.
Bullish rejection from 59,136–59,192 can offer low-risk bounce trades.
🔴 3. GAP-DOWN OPENING (200+ Points)
If BANK NIFTY opens below 59,136, early sentiment turns clearly weak.
🎓 Educational Explanation:
Large gap-downs are often emotional. However, strong historical supports attract buyers and short-covering. Selling blindly into support zones increases risk of sharp reversals.
Plan of Action:
First support to observe is 59,054 — watch price behaviour closely.
Breakdown below 59,054 opens the path toward 58,857.
Strong reversal signals near 58,857 may lead to a fast intraday bounce.
Any pullback toward 59,136 after breakdown becomes a selling-on-rise opportunity.
⚙️ Risk Management Tips for Options Traders 🛡️
Avoid trading the first 5–10 minutes during 200+ point gap days.
Never buy options at resistance or sell at support without confirmation.
Use time-based stop loss (15–20 minutes) if premium doesn’t move.
Risk only 1–2% of total capital per trade.
Prefer ATM options or defined-risk spreads to manage theta decay.
Book partial profits near marked resistance/support zones.
🧾 Summary & Conclusion
Above 59,349: Bulls stay active; targets 59,632 → 59,746.
Between 59,136–59,349: Market remains range-bound; patience required.
Below 59,136: Sellers gain control unless buyers defend 59,054 / 58,857.
Focus on price behaviour at levels, not prediction or emotion.
Consistency comes from discipline, not overtrading.
⚠️ Disclaimer
I am not a SEBI-registered analyst. This trading plan is for educational purposes only and should not be considered financial or investment advice. Please consult your financial advisor before taking any trades.

BANKNIFTY : Trading levels and Plan for 17-Dec-2025📘 BANK NIFTY Trading Plan for 17-Dec-2025
Key reference levels (from chart):
Opening Resistance: 59,173
Last Intraday Resistance: 59,257
Major Upside Level: 59,416
Opening Support Zone: 58,958 – 59,043
Last Intraday Support (Buyers Must Try): 58,592 – 58,712
Gap consideration: 200+ points
🟢 1. GAP-UP OPENING (200+ points)
If Bank Nifty opens above 59,173, it directly enters the supply region, where sellers may attempt profit-booking.
🎓 Educational Explanation:
A large gap-up suggests overnight optimism. However, immediate breakout trades are risky because:
Early buyers may exit at resistance
Liquidity is low in the first few minutes
Pullback to retest breakout levels is common
Professional traders always wait for structure confirmation, not emotion-driven entries.
Plan of Action:
Above 59,173, wait for a retest and a bullish candle before considering long entries.
Next target becomes 59,257. Watch for reactions here—this is a key supply zone.
Clear breakout above 59,257 with volume may extend toward 59,416.
Price rejection at 59,257 can create a good pullback trade back toward 59,173.
Option buyers should avoid chasing CE at resistance; wait for dips near retest zones.
🟡 2. FLAT OPENING
A flat open near 59,066 – 59,100 brings Bank Nifty inside the equilibrium zone, where market direction is decided after observing the early order flow.
🎓 Educational Explanation:
In a flat open, price is not influenced by gap sentiment. This is where Opening Range (ORH/ORL) becomes extremely important.
Breakout of ORH = trend strength
Breakdown of ORL = weakness
Avoid guessing direction — let structure form first.
Plan of Action:
If price sustains above 59,100–59,173, buyers may gain control, targeting 59,257.
Rejection from 59,173 can send price back into the Opening Support Zone (58,958–59,043).
If price dips into support and forms bullish rejection (pin bar / engulfing), it becomes a high-probability bounce zone.
Breakdown below 58,958 opens the path to 58,592 – 58,712 support.
🔴 3. GAP-DOWN OPENING (200+ points)
If Bank Nifty opens below 58,900, we enter the fear-zone where sellers may dominate early.
🎓 Educational Explanation:
Gap-downs typically trigger panic selling, but smart traders avoid shorting at the open. Why?
Market often gives a mean reversion bounce
Weak sellers exhaust quickly
Reversal from strong support zones is common
Patience > Speed.
Plan of Action:
First reaction zone: 58,712 – 58,592 (Buyers Must Try) — watch for reversal candles.
If price holds here, expect a recovery back to 58,958–59,043.
Breakdown below 58,592 with strong follow-through = trending bearish session. Avoid catching falling knives.
Any pullback toward 58,712 after breakdown becomes a safe shorting opportunity for option sellers.
⚙️ Risk Management Tips for Option Traders 🛡️
Never buy options within resistance zones—wait for breakout + retest.
For gap openings, avoid trading the first 5–10 minutes; volatility is unnatural.
Keep SL based on structure, not emotions.
Use time-based stop-loss: If your option premium doesn’t move for 15–20 min, exit.
Follow the 1–2% capital rule per trade.
Track IV during gap days—high IV inflates premiums; avoid chasing far OTM options.
🧾 Summary & Conclusion
Gap-Up: Watch 59,173 → 59,257 → 59,416. Avoid chasing; trade break–retest.
Flat Open: Opening Range decides trend; 58,958–59,043 remains the key support.
Gap-Down: Buyers must watch 58,592–58,712 for reversal setups. Breakdown brings deeper weakness.
Successful trading comes from confirmation-based entries, risk control, and not trading emotional spikes.
⚠️ Disclaimer
I am not a SEBI-registered analyst. This analysis is for educational purposes only and should not be considered investment advice. Please consult your financial advisor before taking any market positions.

BANKNIFTY : Trading levels and Plan for 16-Dec-2025📘 BANK NIFTY – Advanced Educational Trading Plan for 16-Dec-2025
(With 200+ points Gap Logic • Market Structure Breakdown • Institutional Trading Concepts)
🧠 Market Structure & Context Before Scenarios
Before trading any opening scenario, understand how Bank Nifty is positioned:
Price is currently inside a compression zone between
59,302 (Opening Support) and 59,590 (Opening Resistance)
This zone acts like a value area, where institutions balance orders before moving the market.
Both Last Intraday Resistance (59,869–59,931) and Last Intraday Support (59,010–59,097) are liquidity pockets where big players previously defended their positions.
A breakout from these zones generally produces faster directional moves because liquidity gets absorbed.
Educational Principle:
📌 When price consolidates, energy is building. When price breaks out, that stored energy is released.
This mindset helps you filter high-probability trades.
🚀 Scenario 1: Gap-Up Opening (200+ Points)
A strong gap-up indicates overnight bullish sentiment and institutional buying interest.
However, not every gap-up sustains — many are “exhaustion gaps.”
🎯 Educational Breakdown of Gap-Ups
1. Understand the First 15-Min Candle Behavior
If the opening candle is strong and closes near its high → buyers are committed.
If it forms a long upper wick → early profit booking or liquidity grab.
Trading Logic:
Don't chase the first candle. Let institutions reveal their hand.
2. Sustaining Above 59,590 = Trend Day Possibility
If price builds higher lows above 59,590, you’re witnessing institutional accumulation.
The market may aim for 59,869–59,931, the next liquidity zone.
Why This Works:
📌 Sustaining above resistance means short sellers are trapped, fueling further upside.
3. Breakout of 59,931 → Explosive Move towards 60,076
This area has thin liquidity; once broken, price tends to move fast.
A retest of 59,900 zone becomes an excellent add-on opportunity.
4. Gap-Up Failure Pattern
If price opens above 59,590 but quickly falls back into the range, it indicates:
Weak buyers
Profit-booking
Liquidity hunt above resistance
Avoid longs immediately — instead, watch for a drop toward 59,302.
(Three-line spacing)
⚖️ Scenario 2: Flat Opening (±100 Points)
Flat opens are the most technical and the most reliable for structured setups.
✨ Educational Breakdown of Flat Openings
1. Why Flat Opens Are Neutral
Market is waiting for data or direction
Overnight positions are balanced
No immediate imbalance between buyers and sellers
This creates a perfect price discovery phase.
2. Opening Range Matters
The first 15-minute candle becomes your guiding structure.
A breakout of the candle’s high/low with retest often creates clean entries.
Key Principle:
📌 Trade the range breakout, not the noise inside the range.
3. Break Above 59,590 → Trend Creation
Wait for a break–retest–continuation pattern, not just a breakout wick.
4. Break Below 59,302 → Weak Structure
If price breaks and sustains below this zone, sellers gain control.
Next key target becomes 59,097, then potentially 58,592.
(Three-line spacing)
📉 Scenario 3: Gap-Down Opening (200+ Points)
Gap-downs reflect overnight bearishness, but also offer the best short-covering opportunities.
🔎 Educational Breakdown of Gap-Downs
1. Identify If It's a ‘Panic Gap’ or ‘News Gap’
Panic gaps reverse quickly.
News-driven gaps (global cues, macro triggers) sustain longer.
2. Support Zone 59,010–59,097 Is Critical
If this zone breaks with volume → expect continuation towards 58,592.
If this zone holds → expect a strong bounce.
Institutional Reasoning:
📌 Big players often accumulate at previous support zones because liquidity is high.
3. Reversal Pattern After Gap-Down = Best Long Setup
Morning star
Bullish engulfing
Higher low formation
Because short sellers close positions, creating a fast upside reaction.
4. Failed Breakdown = Most Powerful Opposite Move
If price breaks below 59,010 but quickly reclaims it, this traps breakout sellers.
This results in:
Rapid short covering
Price targeting 59,302 → 59,444 → 59,590
(Three-line spacing)
🛡️ Risk Management & Option Trader Education
📌 1. Spot Levels Are for Analysis — Premium Levels Are for Trading
Premiums do not move linearly with spot. Always place SL on premiums.
📌 2. Avoid Trading Against Strong Gap Momentum
25–30% of option trader losses come from trying to fade gaps early.
📌 3. Understand Implied Volatility (IV)
Rising IV → inflated premiums → poor risk–reward
Falling IV → better pricing for buyers
📌 4. Never Take Trades Inside the No-Trade Zone
The zone 59,302 – 59,590 is filled with liquidity traps.
📌 5. Use Position Sizing Formula
Risk per trade = 1% of capital
Position size = SL distance × quantity
📌 6. For Selling Options, Use Hedged Positions Only
Especially during gap days to avoid unlimited risk.
🧾 Summary & Professional Conclusion
Above 59,590 → Bias bullish; potential target 60,076.
Between 59,302 – 59,590 → Stay out; allow market to decide.
Below 59,097 → Weakness accelerates toward 58,592.
Best trades come from break–retest–continuation, not impulsive entries.
Read the market structure first — direction is more important than prediction.
⚠️ Disclaimer
I am not a SEBI-registered analyst. This analysis is solely for educational purposes and should not be considered investment advice. Trade using your own risk assessment and consult your financial advisor before making decisions.

BANKNIFTY : Trading levels and Plan for 12-Dec-2025📊 BANKNIFTY TRADING PLAN — 12 DEC 2025
BankNifty closed around 59,204, sitting just above Opening Support (59,179) and below the Opening Resistance Zone (59,526–59,587).
A clean trending opportunity may appear only when price breaks away from these overlapping zones.
Key Levels from Your Chart:
• Opening Support (Flat or Positive Opening Case): 59,179
• Opening Support Zone: 59,018 – 59,047
• Last Intraday Support: 58,931
• Opening Resistance Zone: 59,526 – 59,587
• Profit Booking Zone: 59,752 – 59,815
The next trading session will depend heavily on how price reacts at 59,179 and 59,526 at the open.
🚀 1. GAP-UP OPENING (100+ points)
A gap-up above 59,300–59,350 pushes price into bullish territory with early upside potential.
1. If the market opens above 59,179 and sustains
• Shows immediate buying pressure.
• Watch for a small dip toward 59,179 — if held with bullish wick rejection → Long entry activates.
• Targets: 59,350 → 59,526 → 59,587.
2. If opening is inside the 59,526–59,587 Opening Resistance Zone
• Avoid fresh longs immediately.
• Let price show whether it wants to:
– Break above 59,587 → Long toward 59,752 → 59,815 (Profit Booking Zone).
– Reject the zone → Short entries become valid only when price slips back below 59,526.
• Downside targets after rejection: 59,350 → 59,179.
3. If opening is above 59,587
• Momentum is strong; this could be a trend-day.
• A retest of 59,587 becomes a high-probability long.
• Upside targets: 59,752 → 59,815.
• Trail SL aggressively as volatility rises.
📌 Educational Tip:
Gap-ups inside resistance zones require patience. Trend confirmation happens only after breakout + retest.
⚖ 2. FLAT OPENING (near 59,150–59,220)
Flat openings allow for clean structural setups based on early price action.
1. If price holds 59,179 (Opening Support)
• Early sign of strength.
• Long entries valid upon bullish structure formation (higher-low/CHoCH).
• Targets: 59,350 → 59,526 → 59,587.
2. If price breaks above 59,526 and retests
• Confirms bullish continuation.
• Long setups activate toward 59,752 → 59,815.
3. If price rejects 59,179 and falls below it
• Intraday weakness begins.
• Short entries valid toward 59,047 → 59,018.
• Breakdown below 59,018 opens targets: Once again revisit 58,931.
📌 Educational Tip:
Flat opens reveal market intent in the first 10–15 minutes. Always allow the structure to form before entering.
📉 3. GAP-DOWN OPENING (100+ points)
A gap-down toward 59,050–58,980 brings price closer to strong support zones.
1. If the market opens inside 59,018–59,047 (Opening Support Zone)
• Avoid shorting inside support.
• Look for reversal signals (hammer, engulfing, CHoCH).
• If confirmed → Long toward 59,179 → 59,350.
2. If opening is near 58,931 (Last Intraday Support)
• This is a high-probability reversal region.
• If bullish reaction appears → Long entries can target:
→ 59,047 → 59,179.
3. If price breaks below 58,931 decisively
• Trend flips bearish.
• Wait for retest of 58,931.
• If retest rejects → Short continuation toward 58,780–58,720.
• Avoid bottom fishing until structure confirms reversal.
📌 Educational Tip:
Gap-downs often flush liquidity at major levels. Confirmation is essential — never assume reversal.
🛡 RISK MANAGEMENT TIPS FOR OPTIONS TRADERS
1. Avoid trading the first 5 minutes on gap days — premiums are unstable.
2. Never chase far OTM options — they decay rapidly and are most affected by IV crush.
3. Position stop-loss based on price levels, not option premium.
4. Risk only 1–2% of trading capital per trade.
5. High IV → Prefer option selling;
Low IV → Option buying more effective.
6. Book partial profits at key levels:
59,179 / 59,526 / 59,587 / 59,752 / 59,815
7. Avoid revenge trades — protect capital first.
📌 SUMMARY & CONCLUSION
• Bullish bias above 59,526, with extension toward 59,752 → 59,815.
• Neutral zone: 59,179–59,526 — avoid aggressive trades until a breakout occurs.
• Strong supports for reversal:
– 59,018–59,047
– 58,931
• Always wait for breakout + retest or reversal confirmation before entering.
• Use disciplined risk management because volatility increases near resistance and support clusters.
⚠ DISCLAIMER
I am not a SEBI-registered analyst.
This trading plan is strictly for educational purposes and not investment advice.
Always use your own judgment, market awareness, and strict risk controls.

BANKNIFTY : Trading levels and Plan for 10-Dec-2025📊 BANKNIFTY TRADING PLAN — 10 DEC 2025
BankNifty closed near 59,212, sitting right inside the NO TRADE ZONE (59,122–59,347).
This zone is where price typically consolidates, traps traders, and lacks clean directional momentum.
Key Levels from Chart:
• Upper boundary of No Trade Zone: 59,347
• Lower boundary of No Trade Zone: 59,122
• Last Intraday Resistance: 59,608
• Last Intraday Support: 58,987
• Deep Support: 58,756
Strong trending opportunities will arrive only when price breaks out of the No Trade Zone and gives confirmation.
🚀 1. GAP-UP OPENING (200+ points)
A gap-up above 59,400–59,450 brings price immediately out of the choppy zone and near the resistance cluster.
1. If price opens above 59,347 and retests it successfully
• Avoid chasing the first green candle.
• Wait for a retest of 59,347 showing bullish wick rejection or CHoCH.
• If confirmed → Long trade activates.
• Targets: 59,500 → 59,608 (Last Intraday Resistance).
• Partial booking recommended near 59,500.
2. If price opens directly near 59,608 (Last Intraday Resistance)
• Avoid taking fresh longs at resistance.
• Watch for rejection wicks or bearish patterns.
• Short setups valid ONLY when price comes back below 59,347.
• Downside targets: 59,200 → 59,122.
3. If 59,608 breaks with strong momentum
• Possible trend day on upside.
• Next extension targets: 59,750–59,800.
• Trail stop-loss aggressively as volatility expands.
📌 Educational Note:
Gap-ups must be validated via retests before entering. Breakouts without confirmation often produce false moves.
⚖ 2. FLAT OPENING (around 59,180–59,240)
A flat open places price inside the No Trade Zone — patience is essential.
1. If price stays between 59,122–59,347
• This is a choppy region — avoid taking positions prematurely.
• Only trade once price breaks outside the zone and retests.
2. If price breaks above 59,347
• Bullish continuation begins.
• Look for a clean breakout + retest to go long.
• Targets: 59,500 → 59,608.
3. If price breaks below 59,122
• Bears gain control.
• Retest of 59,122 (from below) becomes ideal short entry.
• Downside targets: 58,987 → 58,756.
📌 Educational Note:
No Trade Zones are designed to neutralize traders emotionally. Breakout + retest ensures momentum and structure are aligned.
📉 3. GAP-DOWN OPENING (200+ points)
A gap-down into 58,950–58,900 puts price near important supports.
1. If price opens near 58,987 (Last Intraday Support)
• Buyers often react strongly here.
• Avoid shorting into support.
• Watch for hammer, bullish engulfing, or CHoCH → If confirmed → Long entries toward 59,122 → 59,200.
2. If price opens near 58,756 (Deep Support)
• This is the strongest demand area on your chart.
• Ideal for high-probability reversal trades.
• Targets on reversal: 58,900 → 59,122.
3. If price opens below 58,756 with strong selling pressure
• Trend flips bearish.
• Avoid catching a falling knife.
• Wait for a retest of 58,756 — if rejected → Short continuation toward 58,600–58,550.
📌 Educational Note:
Gap-downs often sweep liquidity. Smart money enters at support zones when traders panic. Always wait for clear reversal signals.
🛡 RISK MANAGEMENT TIPS FOR OPTIONS TRADERS
1. Avoid trading in first 5 minutes — gap openings cause premium distortion.
2. Do NOT buy far OTM options after a big gap — IV crush leads to rapid loss.
3. Use price-based SL, not premium SL for consistent discipline.
4. Keep risk per trade at 1–2% of capital.
5. High IV → Consider option selling (credit spreads).
Low IV → Option buying becomes more efficient.
6. Book partial profits at key levels:
59,347 / 59,608 / 59,122
7. Avoid revenge trading — protect your capital.
📌 SUMMARY & CONCLUSION
• Bullish bias above 59,347, with targets toward 59,500 → 59,608.
• No Trade Zone: 59,122–59,347 — avoid trading inside until breakout confirms.
• High-probability reversal zones:
– 58,987
– 58,756
• Breakout + retest is the safest structure for entries.
• Risk management is more important than market direction.
⚠ DISCLAIMER
I am not a SEBI-registered analyst.
This plan is purely for educational purposes and should not be considered investment advice.
Market conditions change rapidly — always use your own judgment and proper risk controls.

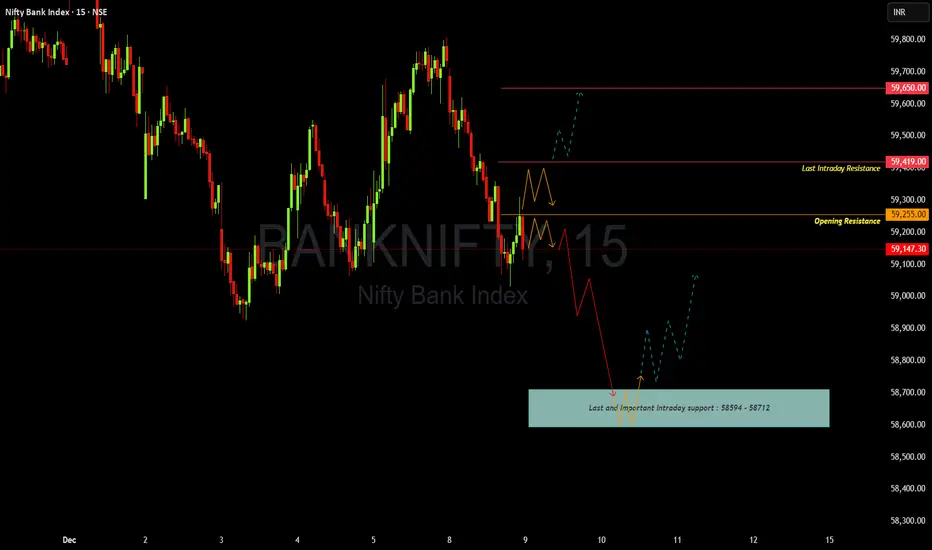
BANKNIFTY : Trading levels and Plan for 09-Dec-2025📊 BANKNIFTY TRADING PLAN — 09 DEC 2025
BankNifty closed around 59,147, sitting just below the Opening Resistance (59,255) and well below Last Intraday Resistance (59,419).
Downside includes a major liquidity pocket:
Last & Important Intraday Support: 58,594 – 58,712
Tomorrow’s opening reaction at these key levels will dictate trend continuation or reversal.
Key Levels from the chart:
• Opening Resistance: 59,255
• Last Intraday Resistance: 59,419
• Major Resistance: 59,650
• Major Support Zone: 58,594 – 58,712
🚀 1. GAP-UP OPENING (200+ points)
A gap-up above 59,350–59,400 puts BankNifty directly near the resistance cluster.
1. If price opens above 59,255 and retests it successfully
• Do NOT chase the gap-up.
• Wait for a retest of 59,255 with bullish reaction (wick rejections, CHoCH, engulfing).
• Once confirmed → Long entry toward 59,419 → 59,650.
• Book partial profits at 59,419 due to historical resistance.
2. If price opens directly inside 59,419 (Last Intraday Resistance)
• High chance of rejection and profit booking.
• Avoid fresh longs here.
• Look for rejection patterns → Short entries valid only if price falls back below 59,255.
• Targets: 59,147 → 59,000.
3. If breakout sustains above 59,650
• Signals strong trending day.
• Next targets open toward 59,800–59,900.
• Trail stop-loss aggressively to protect gains.
📌 Educational Note:
Gap-ups often test nearby resistance first. Retests offer the safest way to enter trending moves.
⚖ 2. FLAT OPENING (±70 pts around 59,150)
Flat openings allow for clean structural setups.
1. If price reclaims 59,255 and sustains
• Buyers show control above this level.
• Long setups activate after breakout + retest.
• Targets: 59,419 → 59,650.
2. If price rejects 59,255
• Bearish rejection = lower-high structure.
• Short setups valid toward 59,147 → 59,000.
3. Break below 59,147 (LTP area)
• Trend pressure shifts bearish.
• Next downside targets: 58,900 → 58,712.
📌 Educational Note:
Flat opens reveal market intent through early candle structure. Let the market show its direction—avoid guessing.
📉 3. GAP-DOWN OPENING (200+ points)
A gap-down near 58,900–58,850 brings price closer to the big buyer zone.
1. If price opens near 58,900 and holds above it
• Expect initial volatility but avoid panic.
• Look for reversal patterns → If confirmed → Long toward 59,000 → 59,147.
2. If price opens inside the Major Support Zone (58,594–58,712)
• This is the strongest demand region on the chart.
• Never short inside this zone.
• Look for reversal signs (hammer, bullish engulfing, CHoCH).
• If reversal confirmed → Long toward 58,900 → 59,147 → 59,255.
3. If price breaks below 58,594 with strong momentum
• Do NOT enter immediately — wait for a retest.
• If retest rejects → Short continuation toward 58,450–58,400.
• Trend becomes bearish for the day.
📌 Educational Note:
Aggressive selling during gap-downs often sweeps liquidity before sharp reversals. Trade based on confirmation, not assumptions.
🛡 RISK MANAGEMENT TIPS FOR OPTIONS TRADERS
1. Avoid trading the first 5 minutes after big gap opens.
Premiums behave erratically.
2. Do NOT buy deep OTM options after a big gap-up or gap-down.
IV crush + theta decay = rapid losses.
3. Always use price-level-based stop losses, not premium-based SL.
4. Follow strict risk-per-trade:
Risk only 1–2% of trading capital.
5. High IV → favour option selling (credit spreads, iron condors).
Low IV → option buying becomes more efficient.
6. Book partial profits near major zones:
59,255 / 59,419 / 59,650
7. Avoid revenge trading.
Protect capital before chasing profits.
📌 SUMMARY & CONCLUSION
• Bullish bias only above 59,255, with targets toward 59,419 → 59,650.
• Choppy zone expected between 59,147–59,255.
• Major downside reversal area: 58,594–58,712 (strong buyer zone).
• Always wait for breakout + retest for clean entries.
• Maintain disciplined risk management—levels are your guide.
⚠ DISCLAIMER
I am not a SEBI-registered analyst.
This plan is for educational purposes only and must not be considered investment advice.
Market behaviour can change rapidly — always use your own judgment and proper risk management.
BANKNIFTY : Trading levels and Plan for 08-Dec-2025📊 BANKNIFTY TRADING PLAN — 08 DEC 2025
BankNifty closed around 59,735, positioned inside a No Trade Zone (59,649–59,857) where price tends to whipsaw.
A decisive move outside this range will determine the trend for the session.
Key Levels from the chart:
• Opening Resistance: 59,857
• Opening Support: 59,649
• Gap-down Support: 59,519
• Last Intraday Support: 59,360
• Deep Support: 59,114
• Last Intraday Resistance: 60,252
Tomorrow’s open will shape directional conviction.
🚀 1. GAP-UP OPENING (200+ points)
A gap-up above 59,950–60,000 indicates strong bullish sentiment and immediate exit from the No-Trade Zone.
1. If price opens above 59,857 and retests the zone
• Avoid chasing the opening candle.
• Wait for a retest of 59,857 (Opening Resistance).
• If retest holds with bullish CHoCH or wick rejection → Long setups activate.
• Targets: 60,000 → 60,252 (major resistance).
• Partial booking near 60,252 advisable.
2. If price opens directly near 60,252 (Last Intraday Resistance)
• High chance of profit booking.
• Avoid fresh longs inside this zone.
• Look for bearish wick rejection → Possible short opportunity back toward 59,950 → 59,857.
3. If 60,252 breaks convincingly
• This becomes a trending session.
• Upside continuation potential beyond 60,300–60,350.
• Trail SL aggressively as volatility increases.
📌 Educational Note:
Gap-ups must be traded using retests, not emotion. Institutions test whether the breakout is genuine before pushing further.
⚖ 2. FLAT OPENING (around 59,700 ± 60 pts)
A flat open inside or near the No-Trade Zone requires patience and clarity.
1. If price stays inside 59,649–59,857 (No Trade Zone)
• Avoid trading the centre of the zone.
• Wait for breakout with retest for clean, high-probability setups.
2. Break above 59,857
• Bullish momentum begins above this level.
• After breakout + retest → Long toward 60,000 → 60,252.
3. Break below 59,649
• Indicates early seller control.
• Short setups valid after retest of 59,649 from below.
• Downside targets: 59,519 → 59,360.
📌 Educational Note:
Flat opens allow the market to reveal intentions through structure. Trading only after breakout + retest avoids chop.
📉 3. GAP-DOWN OPENING (200+ points)
A gap-down near 59,500–59,550 brings price directly into strong liquidity zones.
1. If price opens near 59,519 (Gap-Down Support)
• Do NOT short blindly — buyers often react strongly here.
• Look for bullish reversal signs (hammer, engulfing, CHoCH).
• If reversal confirmed → Long toward 59,649 → 59,735.
2. If price opens near or falls into 59,360 (Last Intraday Support)
• This is a high-probability reversal zone.
• If price forms higher-low → Long back toward 59,519 → 59,649.
• If level breaks → Sellers gain control → Next target 59,114.
3. If price opens at or below 59,114 (Deep Support)
• Avoid catching falling knives.
• Wait for a strong V-shape recovery or retest before entering long.
• If price fails retest → Short continuation possible toward 58,950–58,900.
📌 Educational Note:
Gap-downs often sweep liquidity before reversing sharply. Identify reaction, not direction, before taking trades.
🛡 RISK MANAGEMENT TIPS FOR OPTIONS TRADERS
1. Avoid trading the first 5 minutes after a gap opening.
Premium volatility can trap you instantly.
2. Don’t buy far OTM options after big gaps.
Theta + IV crush = fast loss.
3. Always use price-action-based stop losses.
Premium-based SL triggers unpredictably.
4. Risk only 1–2% of your capital per trade.
5. In high IV → Prefer option selling strategies.
In low IV → Option buying becomes efficient.
6. Book profits near structural levels:
59,649 / 59,857 / 60,252.
7. Avoid averaging losers or revenge trading.
Protect capital first.
📌 SUMMARY & CONCLUSION
• Bullish bias above 59,857, with targets toward 60,000 → 60,252.
• No-Trade Zone: 59,649–59,857 → Avoid trading inside.
• Reversal zones on downside:
– 59,519
– 59,360
– 59,114
• Always wait for breakout + retest confirmation before entering.
• Respect risk management, avoid emotional decisions, and trade level-to-level.
⚠ DISCLAIMER
I am not a SEBI-registered analyst.
This analysis is purely for educational purposes and must not be considered investment advice.
Markets may behave unpredictably — use proper judgment and risk protection.

BANKNIFTY : Trading levels and Plan for 04-Dec-2025📊 BANKNIFTY TRADING PLAN — 04 DEC 2025
Price closed around 59,333, sitting just below the Opening Support/Resistance Zone (59,378–59,517).
Market sentiment is still recovering from the recent selloff, but upside resistance remains heavy near 59,745–59,857.
Tomorrow’s opening will heavily determine whether BankNifty expands upward toward the resistance box or rotates back to the Last Intraday Support (58,792–58,862).
🚀 1. GAP-UP OPENING (200+ points)
Opening likely near/above 59,517 or even inside the resistance zone.
1. If Gap-Up opens above 59,517 → Wait for a Retest
• Avoid chasing the early spike.
• Look for price to retest 59,378–59,517 zone.
• If the retest holds with bullish structure (higher-low, bullish engulfing, CHoCH) → Long entry toward 59,745 → 59,857.
• This is the safest long trade of the day.
2. If Gap-Up opens directly inside the Resistance Zone (59,745–59,857)
• Expect heavy profit booking and intraday selling.
• Avoid long trades in this zone.
• Look for rejection candles, wicks, or bearish CHoCH.
• A short trade is valid only if price falls back below 59,517, confirming rejection.
3. Breakout Above 59,857
• Only trade if a strong candle closes above this level.
• This signals bullish continuation with targets 60,000+ (psychological level).
• Partial booking is advised in such breakouts.
📌 Educational Note:
Gap-ups often trap retail buyers. Market makers usually push price back to retest liquidity zones. Retest entries reduce risk and increase probability.
⚖ 2. FLAT OPENING (Near 59,300 ± 60 points)
This is the cleanest scenario for technical traders.
1. If price breaks above 59,378 and sustains
• Buyers show early strength.
• Long opportunity toward 59,517 → 59,745.
• This is a standard momentum continuation setup.
2. If price rejects 59,517
• Look for bearish candles or deviation.
• First downside target: 59,203 (Opening Support).
• Below 59,203 → Price may trend toward 58,862.
3. If price remains stuck between 59,203–59,517
• Expect a range-bound day.
• Trade only zone extremes:
– Buy near 59,203 (only with confirmation)
– Sell near 59,517 (only with confirmation)
📌 Educational Note:
Flat openings produce normal volatility and allow the market to reveal directional intentions more naturally.
📉 3. GAP-DOWN OPENING (200+ points)
Price likely opens near 59,100 or inside the Last Intraday Support (58,792–58,862).
1. If Gap-Down opens inside 58,792–58,862 (Support Block)
• Never short this zone blindly.
• This area previously held strong buyer interest.
• Look for reversal signs (hammer, bullish engulfing, CHoCH).
• If reversal seen → Long toward 59,203 → 59,378.
2. If Support Breaks Below 58,792
• Do NOT chase.
• Wait for price to retest the broken zone → If rejection appears → Short entry.
• Downside targets: 58,700 → 58,600.
3. Sharp Reversal From Gap-Down (V-Shape)
• If price recovers instantly above 58,862, buyers are absorbing aggressively.
• Above 59,203 → Further upside toward 59,378–59,517.
📌 Educational Note:
Gap-downs sweep liquidity; many times they reverse sharply as smart money collects orders. Always wait for confirmation.
🛡 RISK MANAGEMENT TIPS FOR OPTIONS TRADERS
1. Avoid trading the first 5 minutes on a big gap day.
Volatility crush and fake moves are common.
2. Never buy OTM options after a big gap.
Premiums deflate sharply once IV settles.
3. Always use price-based stop losses, not premium-based SL.
4. Position size rule:
Risk max 1–2% per trade.
5. If IV is high → Prefer selling strategies (Credit spreads, Straddles protection).
If IV is low → Option buying becomes more efficient.
6. Take partial profits at logical zones (like 59,378, 59,517, 59,745).
7. Avoid revenge trading or counter-trend trades without structure confirmation.
📌 SUMMARY & CONCLUSION
• Bullish bias above 59,517, with targets toward 59,745–59,857.
• Range expected if price stays between 59,203–59,517.
• High-probability reversals expected from 58,792–58,862 on gap-down.
• Focus on retests, confirmations, and clean structure before entering.
• Avoid emotional or chase-based trades—stick to the levels only.
⚠ DISCLAIMER
I am not a SEBI-registered analyst.
This plan is purely for educational purposes and should not be considered investment advice.
Market conditions can change rapidly—always trade with proper risk management and your own judgment.

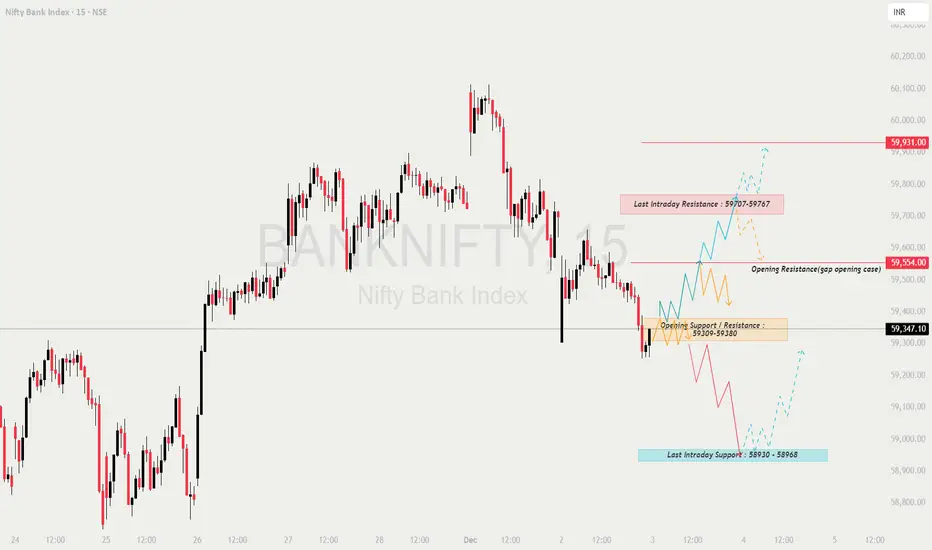
BANKNIFTY : Trading levels and Plan for 03-Dec-3035📊 BANKNIFTY TRADING PLAN — 03 DEC 2025
BankNifty closed near 59,347, sitting inside the Opening Support / Resistance Flip Zone (59,309–59,380).
The index is currently attempting to stabilise after a sharp down-move, with both 59,554 and 58,930 acting as the most important decision zones for 03-Dec.
Market direction will depend on how price reacts around these zones at the open.
🔍 KEY LEVELS TO WATCH
🟥 Opening Resistance (Gap-Up Case): 59,554
🟥 Last Intraday Resistance: 59,707 – 59,767
🟥 Major Upside Target: 59,931
🟩 Opening Support / Resistance Flip Zone: 59,309 – 59,380
🟩 Last Intraday Support: 58,930 – 58,968
🟩 Major Breakdown Target: 58,780 – 58,720
🟢 SCENARIO 1 — GAP-UP OPENING (200+ POINTS)
If BankNifty opens around 59,500–59,600, it directly enters the Opening Resistance zone.
If price sustains above 59,554, buyers will push toward:
➡️ 59,707 → 59,767 → 59,931
Best long entry:
✔️ Breakout above 59,554
✔️ Retest candle with long lower wick
✔️ Entry on strength → Targets above
If price rejects 59,554–59,707 on the first 5–10 min (upper wicks, exhaustion):
Expect pullback to:
➡️ 59,420 → 59,309 zone
Only aggressive traders should attempt fade-shorts near 59,707–59,767.
High risk due to strength in the zone.
📘 Educational Note:
Gap-ups into resistance require confirmation of strength.
Don’t assume continuation — let structure break first.
🟧 SCENARIO 2 — FLAT OPENING (59,250–59,350)
Flat opening puts price directly inside the flip zone (59,309–59,380) — high indecision.
Range-bound movement expected in first 10–15 minutes.
Upside trigger:
✔️ Break above 59,380
Targets → 59,480 → 59,554 → 59,707
Downside trigger:
✔️ Break below 59,309
Targets → 59,200 → 59,120 → 58,968
Avoid trades inside 59,309–59,380 until a clean directional breakout occurs.
Safer setups:
— Retest of 59,380 for long
— Retest of 59,309 break for short
💡 Educational Tip:
Flat opens give the most reliable patterns after the first 3 candles.
Let noise settle, trade clean structure.
🔻 SCENARIO 3 — GAP-DOWN OPENING (200+ POINTS)
A gap-down near 59,000–59,100 brings price close to the Last Intraday Support (58,930–58,968).
If 58,930–58,968 holds, expect a strong reversal toward:
➡️ 59,120 → 59,309 → 59,380
If price breaks 58,930 with momentum, downside opens to:
➡️ 58,820 → 58,780 → 58,720
Only take reversal longs if:
✔️ Support holds for 2–3 candles
✔️ Higher lows form
✔️ Strong bullish rejection wick appears
Breakdown traders should wait for retest of 58,930 after breakdown.
This gives low-risk continuation entries.
📘 Educational Note:
Gap-downs into major support can create high-quality reversal trades, but only after confirmation.
Never pre-empt reversals.
💼 RISK MANAGEMENT TIPS FOR OPTION TRADERS 🔐📘
Avoid trading the first 5 minutes — high trap probability.
Use ITM options for directional trades for better decay protection.
Keep SL based on chart levels, not option premium noise.
Avoid averaging losing positions — re-entry is cheaper than recovery.
Book partial profits at first target and trail stop loss.
During volatile zones, prefer spreads instead of naked options.
Stop trading after 2 consecutive losses — protect capital.
⚠️ Golden Rule:
Strong levels give clean trades.
Avoid trading in the noise zones.
📌 SUMMARY
Bullish Above:
✔️ 59,380 → 59,480 → 59,554 → 59,707 → 59,931
Bearish Below:
✔️ 59,309 → 59,200 → 59,120 → 58,968 → 58,780
Key Zones:
🟩 Strong Support: 58,930–58,968
🟧 Flip Zone (No-Trade until breakout): 59,309–59,380
🟥 Strong Resistance: 59,554–59,707
Major Trend Decider:
🔑 Sustaining above 59,554 → Trend bullish
🔑 Breaking below 58,930 → Trend bearish
🧾 CONCLUSION
BankNifty is positioned at a critical flip zone.
The day’s trend will depend on whether:
✔️ Buyers reclaim 59,380–59,554, or
✔️ Sellers break 59,309 → 58,930
Follow structure, avoid prediction, and trade only after confirmation.
⚠️ DISCLAIMER
I am not a SEBI-registered analyst.
This analysis is for educational purposes only.
Please consult a certified financial advisor before taking trades.
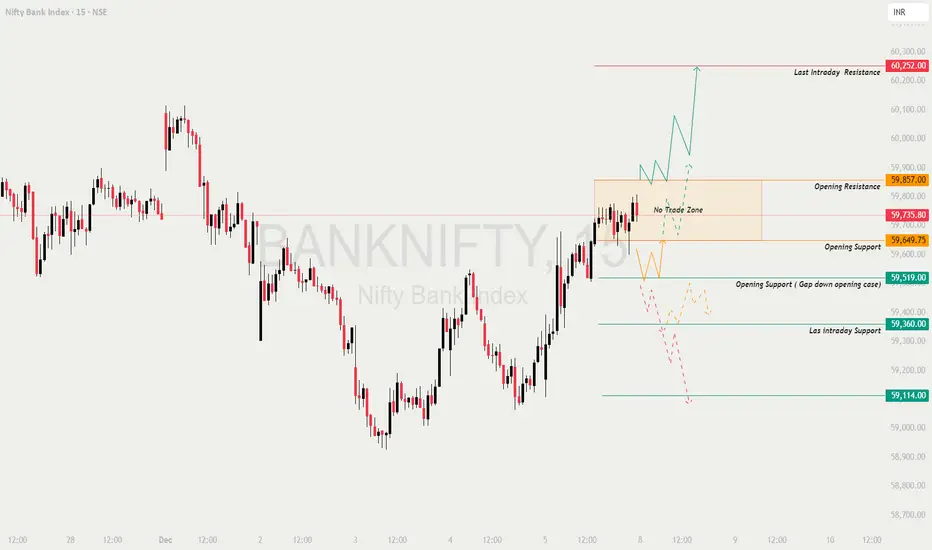
BANKNIFTY : Trading levels and Plan for 02-Dec-2025📊 BANKNIFTY TRADING PLAN — 02 DEC 2025
BankNifty closed around 59,697, sitting right between the Opening Resistance Zone (59,821–59,893) and the Opening Support / Resistance zone (59,485).
This creates a very sensitive region where the market may first trap traders before showing real direction.
The chart shows clear supply above and strong demand zones below, so the opening behavior will dictate whether the day becomes trend-continuation or a reversal session.
🔍 Key Intraday Zones
🟥 Opening Resistance Zone: 59,821 – 59,893
🟥 Last Intraday Resistance: 59,987
🟥 Major Resistance: 60,176
🟩 Opening Support / Resistance Zone: 59,485
🟩 Last Intraday Support Zone: 59,311 – 59,360
🟩 Major Breakdown Level: 58,960
🟢 SCENARIO 1 — GAP-UP OPENING (200+ Points)
If BankNifty opens around 59,900–60,050, price directly enters or opens above the resistance cluster.
If price sustains above 59,893 for 10–15 minutes with strong volume →
⭐ Upside targets → 59,987 → 60,100 → 60,176
This is a classical continuation breakout structure.
If price rejects 59,893–59,987, expect a pullback toward:
➡️ 59,700 → 59,485
Best Long Setup →
Breakout above 59,987 + Retest + Bullish candle.
Avoid aggressive shorts immediately at open during a gap-up —
early supply tests often cause fake breakdowns.
📘 Educational Note:
Gap-ups into resistance are tricky.
Always wait for sustained acceptance above resistance rather than jumping in on the first candle.
🟧 SCENARIO 2 — FLAT OPENING (Near 59,650–59,720)
A flat open places the market between support and resistance → expect indecision.
If price breaks above 59,821, upside targets →
59,893 → 59,987
If price breaks below 59,485, downside opens up toward:
➡️ 59,360 → 59,311
Avoid trading inside 59,650–59,750 until structure becomes clear.
This is a noise zone.
Two high-probability setups:
✔️ Breakout–retest above 59,821
✔️ Breakdown–retest below 59,485
💡 Educational Tip:
Flat openings are where the first 3–4 candles reveal the full day’s trend.
Let the market show its intention before taking the first trade.
🔻 SCENARIO 3 — GAP-DOWN OPENING (200+ Points)
A gap-down near 59,350–59,420 pulls price into the Last Intraday Support Zone (59,311–59,360).
If price holds 59,311–59,360 with long lower wicks →
Upside bounce targets →
59,485 → 59,650 → 59,821
If support breaks →
Next downside → 59,150 → 59,020 → 58,960
A sharp bounce from 58,960 is possible —
this is a major liquidity zone where buyers historically step in.
Aggressive selling only below 58,960 with confirmation.
Targets → 58,820 → 58,700
📘 Educational Note:
Gap-downs into strong demand often give the best reversal trades of the day —
but only after a higher low forms. Avoid revenge trades.
💼 RISK MANAGEMENT TIPS FOR OPTION TRADERS 💡
Avoid trading the first 5 minutes after market opens.
For directional moves, choose ATM or ITM options.
Stop-loss must always be tied to chart structure — not premium price.
Do NOT average losing positions. Cut fast.
Trail your SL once first target hits — protect your gains.
Low VIX → Option buying becomes favorable.
High VIX → Prefer hedged spreads for safety.
⚠️ Golden Rule:
Capital protection is the real edge.
Consistency beats jackpot trades.
📌 SUMMARY
Bullish Above:
59,821 → 59,893 → 59,987 → 60,176
Bearish Below:
59,485 → 59,360 → 59,311 → 58,960
Strong Reversal Zones:
🟩 59,311–59,360
🟩 58,960 (Major Demand Zone)
🟥 59,893–59,987 (Heavy Supply Zone)
No-Trade Zones:
⚠️ Inside 59,650–59,750
⚠️ Direct middle-of-structure price at open
🧾 CONCLUSION
The market will primarily react to the 59,821 resistance and the 59,485 support.
These two levels will decide whether the trend continues upward or transitions to a corrective phase.
✔️ Breakout above 59,821 = Long opportunity
✔️ Breakdown below 59,485 = Short continuation
✔️ Reversal trades possible only at 59,311 or 58,960
Trade only after confirmation — avoid impulsive entries.
⚠️ DISCLAIMER
I am not a SEBI-registered analyst.
This analysis is for educational purposes only.
Consult your financial advisor before making any trading decisions.
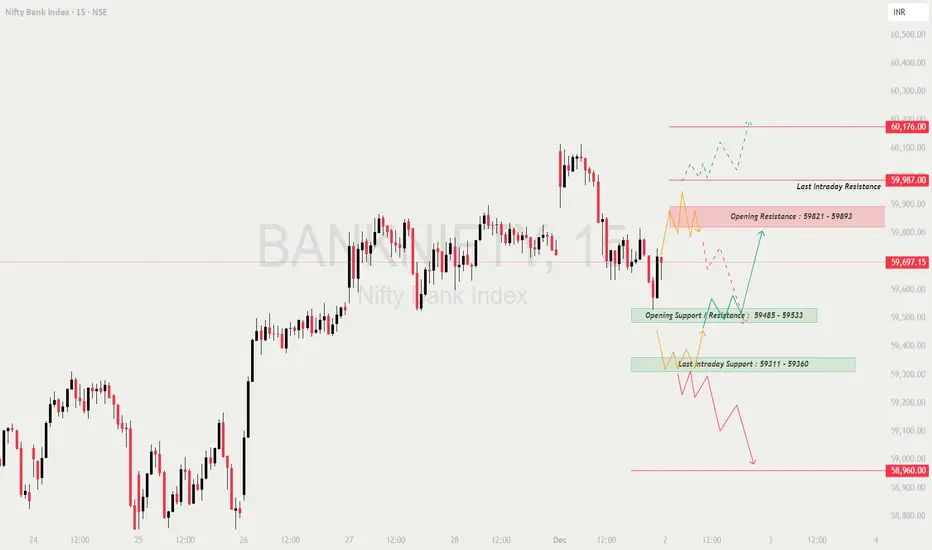
BANKNIFTY : Trading levels and Plan for 01-Dec-2025📊 BANKNIFTY TRADING PLAN — 01 DEC 2025
BankNifty closed near 59,722, sitting just below a key Opening Resistance (59,945) and above a crucial Opening & Last Intraday Support area (59,582–59,610).
Price is compressing between a strong seller zone above and a strong buyer zone below — making the opening structure very important.
🔍 Key Intraday Levels
🟥 Opening Resistance: 59,945
🟥 Last Intraday Resistance: 60,176
🟩 Opening & Last Intraday Support Zone: 59,582 – 59,610
🟩 Last Intraday Support Zone: 59,452 – 59,500
🟢 SCENARIO 1 — GAP-UP OPENING (200+ Points)
If the market opens around 59,900–60,050, it moves directly into resistance zones.
A sustained breakout above 59,945 for 10–15 mins →
⭐ Targets → 60,060 → 60,120 → 60,176
If price rejects from 59,945, expect pullback toward 59,800 → 59,720.
Avoid aggressive buying near 60,000 — sellers usually defend this psychological mark.
Best long trade →
Breakout above 59,945 → Retest → Strong green candle → Entry.
📘 Educational Note:
Gap-ups near resistance often trap breakout buyers. Wait for confirmation through retest or strong candle formations.
🟧 SCENARIO 2 — FLAT OPENING (Near 59,690–59,750)
A flat open places price between resistance and support — expect early indecision.
Breakout above 59,800–59,820 →
Upside levels → 59,945 → 60,060 → 60,176
If price fails to cross 59,800 and reverses →
Expect a slide towards 59,610 (support).
Breakdown below 59,610 →
Targets → 59,500 → 59,452
Avoid trading in the chop zone between 59,690–59,780 unless market shows clear structure.
💡 Educational Tip:
Flat openings offer the best trend identification. First 15-min candle tells the true direction — don’t pre-commit to a bias.
🔻 SCENARIO 3 — GAP-DOWN OPENING (200+ Points)
A gap-down around 59,480–59,550 drops price directly into support.
If 59,452–59,500 holds with strong wick rejection →
Upside bounce targets → 59,582 → 59,720 → 59,820
If support breaks decisively →
Next downside → 59,360 → 59,280
A strong bounce from 59,452 is ideal for low-risk long setups — only with confirmation.
Avoid immediate option buying if volatility spikes after gap-down — wait for price stability.
📘 Educational Note:
Gap-down into support zones gives some of the strongest reversal trades — but only once a clear higher low is formed.
💼 RISK MANAGEMENT TIPS FOR OPTION TRADERS 💡
Avoid trading first 5 minutes — especially on gap-ups/gap-downs.
Use ATM or ITM options for directional trades; avoid deep OTM decay.
Always define SL based on chart levels, not on premium.
Don’t average losing trades — structure invalidation = exit.
Partial profit booking helps secure gains in fast markets.
When VIX is low → Prefer buying.
When VIX is high → Prefer hedged selling strategies.
⚠️ Golden Rule:
Protect your capital first — the best setups come only 2–3 times a day.
📌 SUMMARY
Bullish above → 59,945
Targets → 60,060 → 60,120 → 60,176
Bearish below → 59,610
Targets → 59,500 → 59,452 → 59,360
Strong Reversal Zones:
🟩 59,452–59,500 — Deep buyer zone
🟥 59,945–60,176 — Seller zone
Avoid trading inside:
⚠️ 59,690–59,780 (Flat opening chop zone)
🧾 CONCLUSION
BankNifty’s trend for 01-Dec will depend on whether price:
✔️ Breaks out above 59,945
✔️ Rejects from 60,000
✔️ Holds support at 59,582–59,610
✔️ Breaks below 59,452 for deeper downside
Wait for structure confirmation and avoid trades inside choppy regions. Follow price, not predictions.
⚠️ DISCLAIMER
I am not a SEBI-registered analyst.
This analysis is strictly for educational purposes.
Please consult a certified financial advisor before taking any trading decisions.

BANKNIFTY : Trading levels and Plan for 28-Nov-2025📊 BANKNIFTY TRADING PLAN — 28 NOV 2025
BankNifty closed near 59,764, sitting just below a very important Opening Support / Resistance Zone (59,694 – 59,792), which is also marked as a No-Trade Zone due to expected volatility.
Price is currently between a major overhead resistance (59,997) and a strong downside support zone (59,428 – 59,461).
This makes the opening candle extremely important.
🔍 Key Intraday Levels
🟧 Opening Support / Resistance Zone (No Trade Zone): 59,694 – 59,792
🟥 Last Intraday Resistance: 59,997
🟥 Profit Booking Zone: 60,254
🟩 Opening & Last Intraday Support: 59,428 – 59,461
🟩 Major Downside Support: 59,306
🟢 SCENARIO 1 — GAP-UP OPENING (200+ Points)
If BankNifty opens around 59,900–60,000, price enters directly into strong resistance.
A sustained breakout above 59,997 for 10–15 minutes →
⭐ Upside continuation targets → 60,120 → 60,180 → 60,254
(Profit booking zone — avoid fresh longs here)
If price rejects from 59,997 with long upper wicks →
Expect a pullback towards → 59,792 → 59,694
Avoid immediate buying — gap-up at resistance often causes sharp reversals.
Best long trade setup →
Breakout above 59,997 → Retest → Strong bullish candle → Long.
📘 Educational Note:
Gap-ups into resistance must be treated with caution. Volume confirmation is essential before taking continuation trades.
🟧 SCENARIO 2 — FLAT OPENING (Near 59,700–59,780)
A flat open places price inside the No-Trade Zone (59,694–59,792) — a choppy area.
Avoid taking positions inside this zone — unreliable signals and fake breakouts are common.
Breakout above 59,792 →
Upside targets → 59,900 → 59,997
Breakdown below 59,694 →
Downside targets → 59,550 → 59,461
Best trades occur OUTSIDE the zone:
✔️ Breakout above 59,792
✔️ Breakdown below 59,694
✔️ Support bounce from 59,428–59,461 (strong reversal zone)
💡 Educational Tip:
Flat openings are perfect for identifying trend. Let the first 15-min candle decide the direction — patience pays.
🔻 SCENARIO 3 — GAP-DOWN OPENING (200+ Points)
A gap-down opening around 59,450–59,500 brings price directly into the Opening Support Zone (59,428–59,461).
If support at 59,428–59,461 holds with bullish wick rejection →
Reversal targets → 59,550 → 59,694 → 59,792
If price breaks below 59,428, expect fast downside:
➡️ 59,360 → 59,306
A sharp bounce from 59,306 can offer a low-risk long opportunity.
If all supports fail with momentum →
Extends toward → 59,200 → 59,140
📘 Educational Note:
Gap-down openings into strong support zones often give powerful reversal trades — but only after confirmation of higher lows or bullish structure.
💼 RISK MANAGEMENT TIPS FOR OPTION TRADERS 💡
Avoid trading in the first 5 minutes — especially on gap openings.
Prefer ATM or ITM options for directional trades.
Never average a losing trade — theta decay punishes weak decisions.
Use structure-based SLs, not random premium SLs.
Book partial profits near key zones like 59,997 & 60,254.
When VIX is low → Option buying works better.
When VIX is high → Use hedged selling strategies.
⚠️ Golden Rule:
Your first job is to protect capital. The second job is to catch trends. No capital = no trading.
📌 SUMMARY
Bullish Above → 59,792
Targets → 59,900 → 59,997 → 60,120 → 60,254
Bearish Below → 59,694
Targets → 59,550 → 59,461 → 59,428 → 59,306
Strong Reversal Zones:
🟩 59,428–59,461 (Buyers’ defense zone)
🟥 59,997–60,254 (Profit booking & seller zone)
Highest-Risk Zone:
🟧 59,694–59,792 (No-Trade Zone) — avoid entries here.
🧾 CONCLUSION
BankNifty is positioned between important support and resistance clusters.
The market direction for 28-Nov will strongly depend on whether price:
✔️ Breaks out above 59,792
✔️ Rejects from 59,997
✔️ Reverses from 59,428
✔️ Breaks below 59,428 for deeper downside
Trade clean levels, avoid the No-Trade Zone, and let the structure guide your entries — not emotions.
⚠️ DISCLAIMER
I am not a SEBI-registered analyst.
This analysis is for educational purposes only.
Please consult a certified financial advisor before trading or investing.
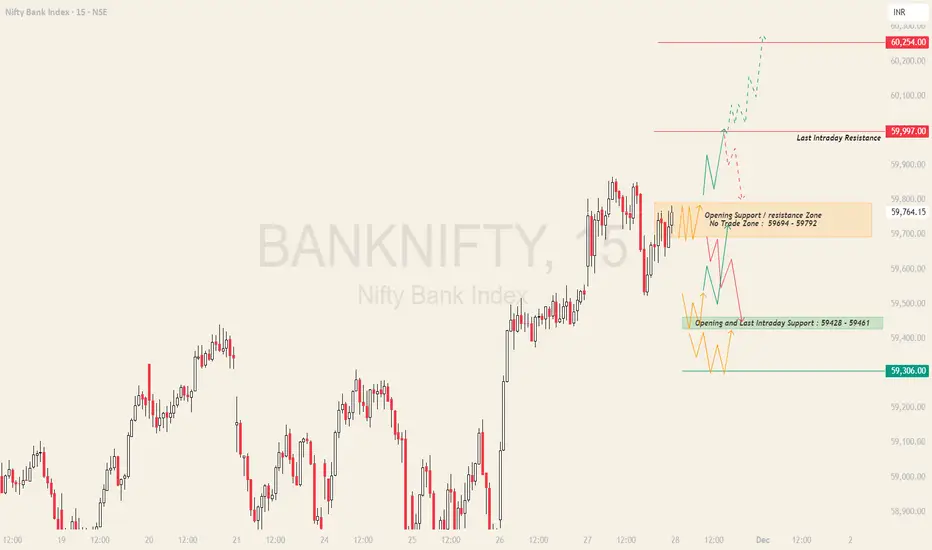
BANKNIFTY : Trading levels and Plan for 27-Nov-2025📊 BANKNIFTY TRADING PLAN — 27 NOV 2025
BankNifty closed around 59,527, sitting right under the Opening Resistance Zone (59,537–59,654) and above immediate supports 59,392 and 59,245.
The structure is bullish, but price is entering a supply region, which makes the opening reaction extremely important.
Important Levels to Track:
🟧 Opening Resistance Zone: 59,537 – 59,654
🟥 Last Intraday Resistance: 59,945
🟩 Opening Support: 59,392
🟩 Last Intraday Support: 59,245
🟩 Major Downside Level: 59,054
🟢 SCENARIO 1 — GAP-UP OPENING (200+ Points)
If BankNifty opens around 59,700–59,800, it opens directly into the resistance zone.
If price sustains ABOVE 59,654 for 10–15 minutes →
⭐ Upside targets → 59,780 → 59,860 → 59,945
If price fails to hold above 59,654 and shows rejection wicks →
Expect a correction → 59,600 → 59,537 → 59,392
Avoid chasing long immediately on gap-up — this resistance zone is used frequently for profit booking.
Best long entry = Breakout → Retest → Re-entry above 59,654.
📘 Educational Note:
Gap-ups near previous supply zones often trap retail buyers. Look for follow-through candles and rising volume before initiating long trades.
🟧 SCENARIO 2 — FLAT OPENING (Near 59,450–59,550)
A flat open keeps BankNifty inside the Opening Resistance Zone (59,537–59,654) — a tricky zone.
If BankNifty breaks above 59,654 with strength →
Upside → 59,720 → 59,780 → 59,945
If price stays inside 59,450–59,550 →
This becomes a no-trade zone; wait for breakout or breakdown.
Breakdown below 59,392 →
Targets → 59,300 → 59,245 (Major support)
Support retest at 59,392 with bullish wick can give a safe intraday long.
💡 Educational Tip:
Flat openings are the most reliable for identifying trend.
Let the first 15-min candle close — this candle usually sets direction.
🔻 SCENARIO 3 — GAP-DOWN OPENING (200+ Points)
A gap-down below 59,200 pushes price into Last Intraday Support (59,245).
If 59,245 holds strongly with long lower wicks →
Upside targets → 59,350 → 59,392 → 59,537
If price breaks 59,245 with momentum →
Next support → 59,120 → 59,054
A high-quality reversal trade may form near 59,054, but ONLY after confirmation.
If BankNifty stays BELOW 59,245, expect a trending bearish session.
📘 Educational Note:
Gap-downs into strong supports can create large reversal moves — but only after absorption candles + higher lows.
💼 RISK MANAGEMENT TIPS FOR OPTION TRADERS 💡
Avoid entering trades in the first 5–10 minutes, especially on gap openings.
Prefer ITM or ATM options for directional trades to reduce premium decay.
Use structure-based stop loss; DO NOT widen SL emotionally.
Avoid averaging losers — protect capital at all costs.
When VIX is low → option buying works better.
When VIX is high → prefer spreads or hedged selling.
Always book partial profits at major levels.
⚠️ Golden Rule:
Your survival matters more than catching every move. Capital protection = long-term profitability.
📌 SUMMARY
Bullish above → 59,654
Targets → 59,720 → 59,780 → 59,945
Bearish below → 59,392
Targets → 59,300 → 59,245 → 59,120 → 59,054
Avoid Trading Zones:
— 59,450–59,550 (Flat choppy zone)
— 59,537–59,654 (Supply zone until breakout)
🧾 CONCLUSION
BankNifty sits just under a crucial resistance band.
The cleanest and safest trades will come from:
✔️ Breakout + Retest above 59,654
✔️ Reversal setups near 59,245
✔️ Continuation short below 59,392
Avoid trading inside noisy zones — wait for strong structure.
⚠️ DISCLAIMER
I am NOT a SEBI-registered analyst.
This write-up is for educational purposes only.
Please consult a certified financial advisor before trading.
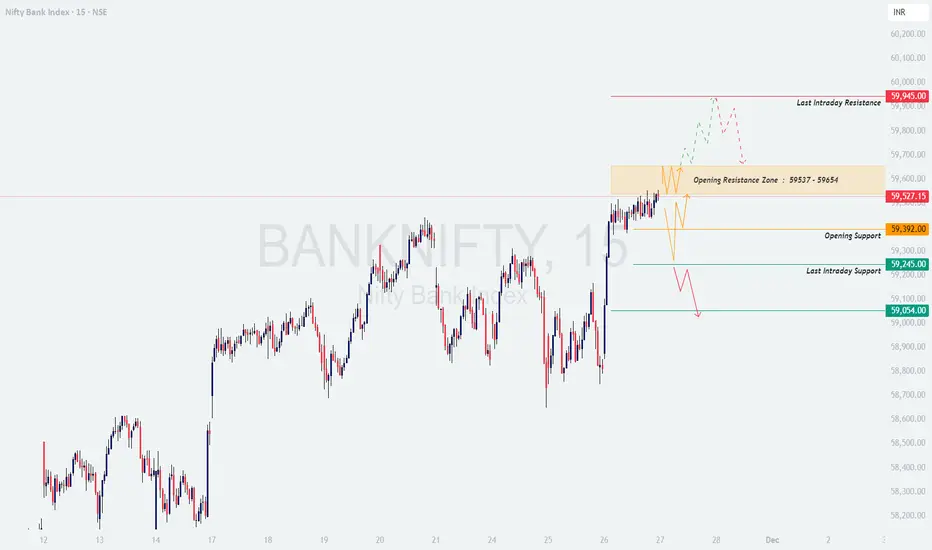
BANKNIFTY Looks Bearish Please check how banknifty is setting up bearish move for a month or after a month to come, it does not look bullish from here atleast and view gets invalid if banknifty closes above 60,000.
can look for short positions if your setup shows too !
