BANKNIFTY : Trading levels and plan for 10-July-2025📊 BANK NIFTY INTRADAY PLAN – 10 JULY 2025 (15min TF)
An educational, level-based strategy plan based on key price zones and expected market behavior
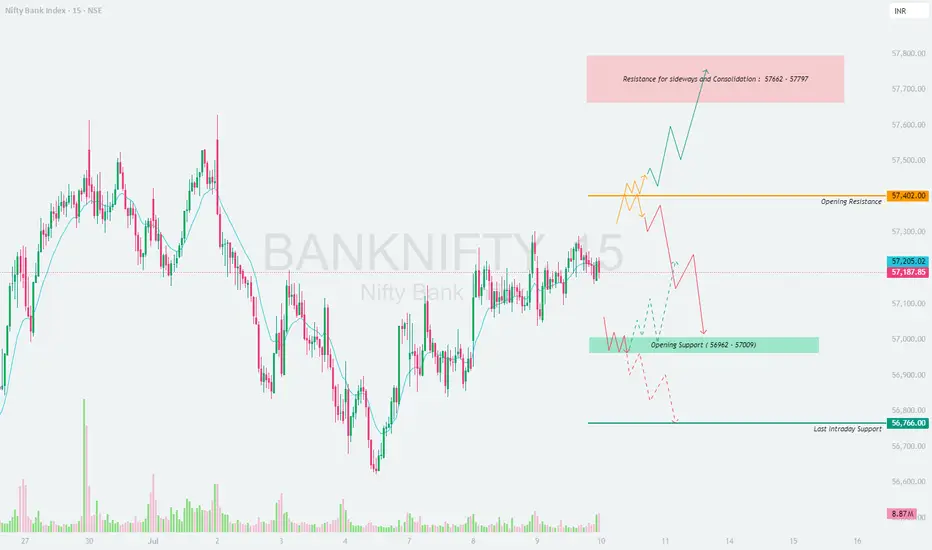
📍 Reference Close: 57,187.85
📈 Gap Opening Threshold: 200+ points
⏱️ Tip: Wait for the first 15–30 minutes post-opening before confirming breakout/breakdown setups
🔍 IMPORTANT LEVELS TO WATCH
Opening Resistance: 57,402
Resistance for Sideways & Consolidation: 57,662 – 57,797
Opening Support Zone: 57,009 – 56,962
Last Intraday Support: 56,766
📈 SCENARIO 1: GAP-UP OPENING (Above 57,402)
Bias: Bullish with potential consolidation at upper zones
A gap-up above 57,402 would signal early bullish strength.
Upside targets could stretch to 57,662–57,797 – a known resistance for consolidation.
If price shows rejection candles or wicks in this zone, consider partial profit booking or reversal setups.
Only continue bullish trades if 15-min candle closes above 57,797 with strong volume.
📊 SCENARIO 2: FLAT OPENING (Between 57,009 – 57,402)
Bias: Neutral to breakout – depends on price reaction
This zone is a battle ground. Price may test both support and resistance.
If Nifty Bank sustains above 57,205 and reclaims 57,402 , a breakout trade may evolve.
On the flip side, if it slips below 57,009 , sellers may try to push it toward 56,766 .
Avoid early trades. Wait for either a breakout above resistance or breakdown below support.
📉 SCENARIO 3: GAP-DOWN OPENING (Below 56,962)
Bias: Bearish to bounce watch
A gap-down below 56,962 will likely push price towards 56,766 – a key level for intraday reversal or panic selling.
If 56,766 holds, we may see short covering. Look for bullish reversal patterns in this zone.
If it fails, next leg of decline may start and one can ride the downside using puts or short futures with tight SL.
Reversal trades must be confirmed by bullish structure; avoid bottom fishing without confirmation.
💡 OPTIONS RISK MANAGEMENT TIPS
Trade near support/resistance, not inside indecision zones
For uncertain sessions, favor spreads (Bull Call/Bear Put) to limit risk
Avoid averaging down losing options – instead, re-analyze your thesis
Stick to 15-min candle close-based stop-loss to avoid fake moves
Protect capital during sideways zones like 57,009–57,205 – stay nimble
Time decay impacts premium heavily post-2PM – be cautious in scalping late trades
📌 SUMMARY & CONCLUSION
Bullish above 57,402 with upside resistance at 57,797
Sideways zone between 57,009 – 57,402 ; breakout to decide direction
Bearish bias below 56,962 , with last support at 56,766
Use patience and discipline – let the levels guide your trades
⚠️ DISCLAIMER: This is not investment advice. I am not a SEBI-registered analyst. The analysis is purely for educational purposes. Please consult your financial advisor before taking any trading decisions.
Banknify
BANKNIFTY : Trading levels and plan for 27-Jun-2025
\ 📊 BANK NIFTY TRADING PLAN – 27-Jun-2025\
📍 \ Previous Close:\ 57,174
📏 \ Gap Reference:\ ±200 points
🕓 \ Timeframe:\ 15-Min
🎯 \ Focus:\ Structured trading based on volatility zones with breakout/breakdown follow-through setups
---
\
\ \ 🚀 GAP-UP OPENING (Above 57,297):\
If Bank Nifty opens above \ 57,297\ , it will breach the \ Opening Resistance Zone\ and move into the \ Intraday Resistance area (57,513)\ . Momentum-driven traders must stay alert for quick profit-taking near \ 57,700+\ — marked as a \ Sharp Profit Booking Zone\ .
✅ \ Plan of Action:\
• Watch early 5–15 minute candle behaviour
• If strong green candle above 57,297 with follow-through → go long
• Avoid aggressive longs near 57,513 – 57,700 zone unless volume breakout seen
🎯 \ Trade Setup:\
– \ Buy\ above 57,297
– \ Target:\ 57,513 → 57,700
– \ Stop-loss:\ Below 57,180 (spot closing basis)
📘 \ Tip:\ Don't chase the opening spike. Let price stabilize and confirm with retest of 57,297 zone for lower-risk entry.
\ \ ⚖️ FLAT OPENING (Between 57,047 – 57,297):\
Flat opening inside the \ No Trade Zone\ (highlighted range) signals indecision. Price may oscillate between support and resistance — breakout trades only after the range is broken on either side.
✅ \ Plan of Action:\
• If price breaks above 57,297 with strong candle → bullish continuation
• If price breaks below 57,047 → look for quick short setups
• Avoid trading within 57,047–57,297 until clarity emerges
🎯 \ Trade Setup Options:\
– Long: Only above 57,297 with candle close
– Short: Below 57,047 with momentum
– \ Target:\ 57,513 (upside) or 56,822 (downside)
– \ Stop-loss:\ Based on opposite zone breakout
📘 \ Tip:\ Let market show direction post 9:30 AM. Trade with candle confirmation to reduce fake breakout risk.
\ \ 📉 GAP-DOWN OPENING (Below 56,822):\
Gap-downs below \ 56,822\ place Bank Nifty near the \ Last Intraday Support zone\ . If this level is breached, the next watch area is around \ 56,626\ — expect potential bounce or sharp fall from here based on sentiment.
✅ \ Plan of Action:\
• If first candle sustains below 56,822 → short on pullback
• Avoid longs until 56,822 is reclaimed
• Watch price action closely near 56,626 for buyer reaction
🎯 \ Trade Setup:\
– \ Sell\ below 56,822
– \ Target:\ 56,626
– \ SL:\ Above 56,900 or candle close back inside support
📘 \ Tip:\ Avoid fresh longs in a falling gap-down market. Always wait for signs of reversal before considering bullish trades.
---
\ 📌 KEY ZONES TO WATCH:\
🔴 \ Sharp Profit Booking:\ 57,700
🔴 \ Intraday Resistance:\ 57,513
🟧 \ Opening Resistance:\ 57,297
🟨 \ No Trade Zone:\ 57,297 – 57,047
🟩 \ Opening Support:\ 57,047
🟦 \ Intraday Support:\ 56,822
🟫 \ Deep Support:\ 56,626
---
\ 💡 OPTIONS TRADING TIPS & RISK MANAGEMENT:\
✅ Use \ spread strategies\ like Bull Call or Bear Put to reduce premium decay
✅ Avoid \ buying deep OTM options\ without clear momentum
✅ \ Protect capital:\ Risk max 1.5%–2% per trade
✅ \ Never average losers\ ; re-enter with better structure
✅ \ Exit on time:\ Don’t hold trades beyond trend invalidation — follow candle structure
✅ Keep eye on \ Open Interest buildup\ near key zones
---
\ 🧾 SUMMARY:\
• 🔼 \ Bullish above:\ 57,297 → potential breakout toward 57,513 / 57,700
• ⚠️ \ Sideways inside:\ 57,297 – 57,047 → no trade zone
• 🔽 \ Bearish below:\ 56,822 → fall may extend till 56,626
• 🧠 \ Key Message:\ Let price show the path. React to confirmation, not assumptions.
---
\ ⚠️ DISCLAIMER:\
I am not a SEBI-registered advisor. This trading plan is solely for educational purposes. Please consult your financial advisor before taking any trades. Always use proper risk management, stop-loss, and position sizing strategies.

Price Action Trading Price action trading is based on analyzing the raw movement of price over time without relying heavily on indicators. It involves picking out key levels, reviewing candlestick patterns, and recognizing reversal and continuation setups to capitalize on market opportunities.

BOROSIL RENEWABLES LTDintraday trade
stock: @bororenew
buy above: ₹562
target: ₹565, ₹568+++
#bororenew

Advanced Trading part 1Advanced trading encompasses sophisticated strategies, tools, and techniques used by experienced traders to navigate financial markets effectively. It often involves a deeper understanding of market dynamics, technical analysis, and the use of advanced instruments like options and futures. Traders who embrace advanced trading seek to improve their performance and potentially increase profits by leveraging a broader range of tools and strategies.

Bajaj finserv break out.Bajaj finserv trading as per Elliott wave, It was given break out of triangle pattern at1700, As per chart Possible target would be 1836, 1932 and 2431 soon.

Bank Nifty 24-06-2024 AnalysisHello Traders, Welcome to SriTrader5121
______________________________________
Overall view for the day
Buy - with the support of Important_level
Sell - with the rejection of Important_level
Major Support - Around 5100#
Major Resistance - Around 5200#
See the price action at our zones, take the trade according to your Risk - Reward.
Happy Learning and Trading – SriTrader5121
_______________________________________
Rules to follow...
1) Wait for confirmation.
2) See the price action at our zones.
3) Trade with Strict Stop Loss.
4) Trade with Small Quantity.
5) Take entries based on Support & Resistance Zones.
_____________________________________________________
Please take the trade according to the zones marked, with Risk-Reward.
This is not a Buy or Sell recommendation to anyone.
Take entries based on your own analysis and risk.
This is for education purposes and a helping hand to learn trading in the live market.
NOTE: Trade with Strict Stop Loss. It may or may not hit all levels / Zones. So one can book profit / loss based on your risk-reward or considering price action at the respective zone and how it works near that zone.
I hope you all like my analysis. Follow me to get regular updates.
Please do share your thoughts in the comment section.
Please Hit a LIKE, it motivates me to do analysis and share with your trading friends.

Bullish Bank NiftyAs Per data And Chart Market Bullish
We said that yesterday market have big resistance 44500 and today market open Gap-up above this levels then market fall 44330 Market Took Support and break again 44500 and close above this .
Tomorrow we may see a good bullish move in the market
in Downside To Many Support Zone If Market Again Act like Bearish Then Don't Trade until break 44300.
For Upside If Market Trade Above 44700 then Buying Side Move Possible.
WE Don't Know Where Market open But For Upside 44700 is a resistance if market open above this then market took support or immediate rejection in downside then 44500/44600 Act Like a Support and market Move Upside

Will NIfty break 18200?Nifty 50 continuously trading in bullish momentum from the past week after getting the breakout of the parallel channel now moving toward the 18200 level.
18200 Level is a very important resistance zone 18200-18250 thus if this level breaks out we can see a very high probability to reach up to previous high.
17600 is acting as a great support for nifty.

BANKNIFTY HI all
"we can see some buying in BankNifty around 39000 level, there is a support level at 39000 in the BankNifty index, which could cause buying interest and make it easier for the index to bounce back up from that level.
It is important to note that technical analysis is not a guaranteed predictor of future market behavior, and it is always advisable to do your research and consult with a financial advisor before making any investment decisions.

#BANKNIFY may go to 42657 if sustain above this level in next weAs per Harmonic PRZ pattern, BANKNIFY may go to 42657 if sustain above 42051 in next week


Bank Nifty: Friday - 02/12/22Levels:
Support: 43000, 42775, 42500, 42350
Resistance: 43350, 43630, 44000
OI Data:
---------------------------------------------------------------------|
Bank Nifty => Price: 43260.65
ATM: 43300 , ITM: 43200, 43100, 43000 , OTM: 43400, 43500, 43600
---------------------------------------------------------------------|
Highest OI Call in Bank Nifty per OI data: 43300
Highest OI Put in Bank Nifty per IO data: 43200
Nearest Major Resistance in Bank Nifty per OI data: 43700
Nearest Major Support in Bank Nifty per IO data: 42800
---------------------------------------------------------------------|
Trade setup:
1. For any buy trade, follow the N pattern (let the price run above the level, let it retraces back to the level and let it hold the level as support)
2. For any sell trade, follow the mirror-N pattern (let the price fall below the level, let it pull back to the level and unable to pass through the level as resistance).
+++++++++++++++++++++++++++++++++++++++++
Trade | Level | SL | T1 | T2
-----------------------------------------
BUY | > 43350 | 43250 | 43500 | 43650
-----------------------------------------
SELL | < 43200 | 43300 | 43000 | 42800
+++++++++++++++++++++++++++++++++++++++++
Point to be noted: Unlike Nifty, BN RSI is pretty comfortable region.

Bank Nifty: Thursday - 01/12/22Levels:
Support: 43000, 42775, 42500, 42350
Resistance: 43350, 43630, 44000
OI Data:
---------------------------------------------------------------------|
Bank Nifty => Price: 43231
ATM: 43200 , ITM: 43100, 43000, 42900 , OTM: 43300, 43400, 43500
---------------------------------------------------------------------|
Highest OI Call in Bank Nifty per OI data: 44000
Highest OI Put in Bank Nifty per IO data: 43000
Nearest Major Resistance in Bank Nifty per OI data: 43600
Nearest Major Support in Bank Nifty per IO data: 42800
---------------------------------------------------------------------|
Trade setup:
1. For any buy trade, follow the N pattern (let the price run above the level, let it retraces back to the level and let it hold the level as support)
2. For any sell trade, follow the mirror-N pattern (let the price fall below the level, let it pull back to the level and unable to pass through the level as resistance).
+++++++++++++++++++++++++++++++++++++++++
Trade | Level | SL | T1 | T2
-----------------------------------------
BUY | > 43400 | 43300 | 43500 | 43600
-----------------------------------------
SELL | < 42950 | 43050 | 42750 | 42600
+++++++++++++++++++++++++++++++++++++++++

BANKNIFY may go down below 42895As per Harmonic PRZ, BANKNIFY may reached at Potential reversal zone of 42895. BANKNIFY may correct more from this level.

HDFC Bank Daily Timeframe AnalysisHDFC Bank getting ready for Breakout
It has formed Narrow range of last 8 sessions and Inside bar candles in last 3 sessions
Making LH - LH structure
Consolidating above last 88 days support zone and sustaining after dynamic resistance (trendline) breakout and formed NR7
If Breakout above 1468 and sustained can go long with SL 1445 and momentum targets of 1487,1513,1540

Banknift in buy on dip 16-3-2020Banknifty until fill the Island gab, it is buy trend only.
Disclaimer: Im not tip provider and this chart is not indented to take trade in my levels. It is all your own risk.

BANKNIFTY IMPORTANT LEVEL FOR TOMORROWWe have seen a gap down opening followed by a good rally onward. Many Shorter and PUTS holder were trapped today. Sentiment remain sideways to little bearish. Important level to watch is 37774 and 37926 for Upper Side, Support at 37500, Probably we can see a gap up opening. Profit booking zone will be near 38000 plus level. As tomorrow is expiry stay lite. :)

KOTAK BANK LOOKS STRONG AFTER LONG CONSOLIDATIONSelf explanatory chart:
After long consolidation KOTAK started showing some momentum and if sustain above 1830 can give targets of 944 and 2000.

Bank Nifty important Levels for August 31Bank Nifty important Levels for August 31.................. May be Choppy tomorrow

Bank nifty getting Ready fo a ballastic moveNSE:BANKNIFTY
Banknfty is on the verge of a breakout on 4h chart. Ballistic move expected on the upside if it breaks and retests the trendline successfully.
All banking stocks look good on the upside.


Bank-Nifty SPOT Trade-plan for 20th Aug 2021Bank-Nifty SPOT Trade-plan for 20th Aug 2021
High 35821 - Resistances
Low 35450 34914 34401 33531 - Supports
Today Trend:
Fast fall....Closing will be around Today's Low
