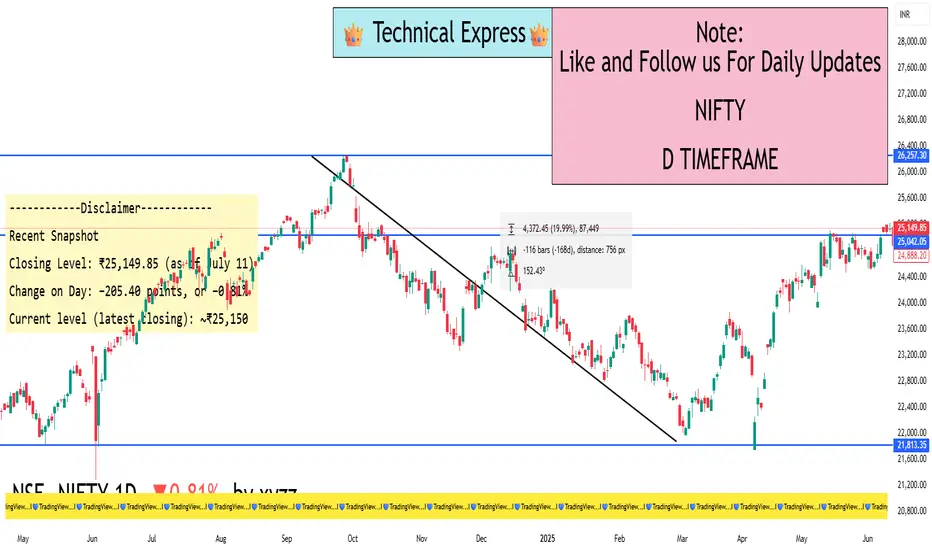
NIFTY Slips Below 25,200 The Nifty closed today at 25,149, down by around 205 points.
It has broken an important support level near 25,330, which could be a warning sign for traders and investors.
The market is showing signs of weakness – key technical indicators like RSI and MACD are also turning negative.
If Nifty slips below 25,000, we might see more downside movement in the coming days.
👉 For now, it’s better to stay cautious.
Long-term investors should wait for stability.
Short-term traders should manage risk and avoid over-trading.
Keep an eye on upcoming Q1 earnings and global market trends.
This is not the time to panic – it’s the time to stay informed and plan smartly.
Caption Highlights (optional for post tags or image text):
Nifty breaks 25,330 support
Watch 25,000 as next key level
Bearish signals on technical charts
Caution advised for traders
Market waiting for fresh cues
Bankstocks
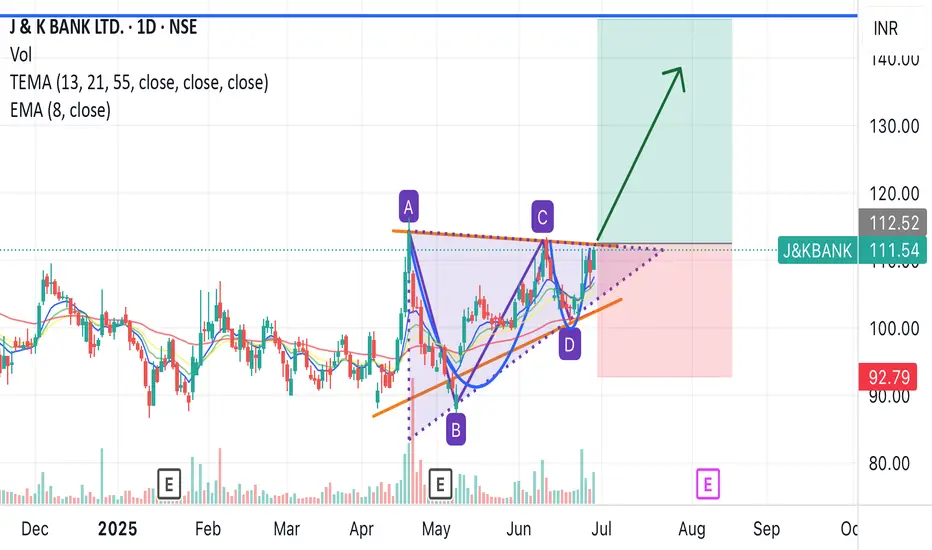
J&k Bank nearing breakout with triangle, and also. Up and handleJ&k bank nearing breakout according to triangle, and cup and handle pattern.
Entry - around 111
Target - 145
Duration- 2-3 months
With good fundamentals
NIFTY BANK Intraday levels (Educational purpose only)📈 Upside Trade Setup (Long Entry):
Buy Above: 55,850
Entry Confirmation: 1-minute candle close above 55,850 with volume
Targets:
🎯 Target 1: 55,950
🎯 Target 2: 56,050
🎯 Target 3: 56,160
Stop Loss: 55,780
📉 Downside Trade Setup (Short Entry):
Sell Below: 55,700
Entry Confirmation: Strong red candle close below 55,700
Targets:
🎯 Target 1: 55,600
🎯 Target 2: 55,500
🎯 Target 3: 55,400
Stop Loss: 55,780

Karnataka Bank Long Idea#KTKBANK Broke out now. Need to wait for Friday closing to confirm.
It has done Long term breakout retest in Monthly Chart.
I have attached Weekly Chart for breakout as image.
Risk Reward is good. Tarde as per risk management.

SOUTHBANK By KRS Charts2nd Jan 2025 / 1:05 PM
Why SOUTHBANK ❓
1. Fundamentally Stable Company ✅
2. Wave Count seems like 4th Wave is about to Finish. 👍
3. Currently taking support on 100 EMA 1W Timeframe with Bullish Doji candle.
4. Descending Flag Pattern Breakout with Retest with bullish trait 📈
Initial Target - ~34 Rs.
SL 1W Closing below 100 EMA

Union Bank Charts: Time to Buy or sell?After closely analyzing the Union Bank chart we have observed that
1) On weekly Tf, Union bank is trading with a bullish bias and currently its trading on a retracement move.
For any buying opportunity we look for any change in Trend on lower Tf usually in 1Day or 4 HR chart.
2) On Daily Tf, Union bank is following the market structure of LH & LL, and looking at the very recent move the trend has been shifted to bullish.
We can see on the chart that the previous LH is getting liquidated & market has formed a ned HH, indicating a switch in Market structure.
We will look for only Buy opportunity when the price comes down to the FVG & OB on the daily tf. Entry on FVG or OB will help us to follow the smart money inflow.
This is for educational purposes only. Please have your own research before investing.

Bank nifty Long term viewI analyzed this few months ago and its valid...so let's see If it crosses ATH and sustains then get ready for new ATH. Just look at the chart you'll understand if you're a trader or an investor in Indian stock market. But it must make 55k as good consolidation area or level for another bull run. Only my personal view does not consider this as advice.

RBL BANK FOR 300% UPSIDEtechnically RBL bank is a buy call for upside seen more than 300% to it's lifetime high and is retraced even 45% from its 52 week high.
This Private bank major is below RSI and generating a buy signal on the charts.
Fundamentals are looking good for long term.
Note: Having a notable holding in the entity at various price levels.

SCB X PCL, Triangle Pattern Target & Gain +33% PROFITIn SCB X PCL, a Triangle Pattern has formed, and the market is expecting a breakout above the pattern. If the market breaks out above the Triangle Pattern, it is likely to reach the pattern target or the 0.618 Fibonacci retracement level at 146 THB. Take advantage of this Great Opportunity to Earn a Potential Profit of +33% ROI.
I want to help People to Make Profit all over the "World".

AU BANK - This Range is No Joke !Please pay attention to the range 695 to 755
If there is reakout or breakdown then consider trading that side, also keep boosting or liking this so that I am reminded to trade the same too !
Honestly, In my opinion there is a great accumulation or distribution happening (I cant figure out between the two) but I surely know that this is the preparation for a trending move 100%.
Keep watching this script and believe me, I've seen these a lot of times.

SURYODAY SMALL FIN BANK BY KRS ChartsDate:23rd Aug 2024
Time: 9:26 AM
WHY SURYODAY❓❓
1. All overview, Stock was in Consolidation for long time since listed and in Jun 22 it made lowest low , after that it is in continues HH HL pattern.
2. Wave Count is visible perfectly and it is in 3rd leg of 5th wave as we can see in above chart.
3. 100 Ema is right underneath in Hourly and Daily TFs
4. Today it has broken the resistance of Flag pattern and likely to sustain above it.
5. In bigger picture, Suryoday is making Upside channeling

Bank Nifty Levels and Technical Analysis- Bank Nifty is currently trading at 53,043 as of today and is down by 1.5%
- Bank nifty took out buy-side liquidity and trapped many buyers but at the same time the market structure looks intact and bullish
- Bank has a huge displacement around 52,000-54,000
- Bank Nifty might move after filling the Bullish Fair Value gap which is lying around 52,300-52,600
- Bank Nifty can make another higher high post that so be cautious and wait for the price delivery to purge your point of interest

AXIS BANK Swing Long Update - Axis Bank is currently trading at 1232
- Axis Bank swing long was posted a week back and now all my expected targets have been purged
- If you are holding Axis try locking in a major chunk of your gains
- I am anticipating that Axis Bank can soon start retracing now
- Watch out if you are holding aggressive longs

SBIN Swing Long Setup - State Bank Of India is currently Trading at 790.85
- We are currently in a good zone if you are looking to build longs
- All PSU banks moved up except for State Bank of India
- Peers are performing quite nicely hence we might see SBIN following and doing the same
- Invalidation of this swing will be below 765

ICICI Prudential Life Insurance Company Limited (ICICIPRULI) Overview
ICICI Prudential Life Insurance Company Limited (NSE: ICICIPRULI) is currently navigating through an ascending channel, as shown in the 3-hour chart. It’s like watching a circus performer carefully walk a tightrope – thrilling, but you never know which way it will go!
Technical Pattern: Ascending Channel
The price action of ICICIPRULI has been steadily climbing within the confines of an ascending channel. This pattern is characterized by higher highs and higher lows, creating a channel where the price is currently dancing near the upper boundary.
Channel Resistance: The upper boundary, currently acting as resistance, is approximately near ₹770-₹775.
Channel Support: The lower boundary, providing support, is hovering around ₹735-₹740.
Current Price: ₹768.00 (as of the last candle close)
Volume: 97.709K – indicating moderate trading activity, almost like the audience holding their breath as they watch the performer’s next move.
Price Action Analysis
ICICIPRULI’s price has recently tested the upper boundary of the ascending channel, but couldn’t muster the strength to break out. This is like trying to reach the top shelf without a stool – so close, yet so far! The price has pulled back slightly, hinting at a potential consolidation before the next big move.
What to Watch For
Breakout or Breakdown?: The key question is whether ICICIPRULI will break above the channel's resistance or succumb to the support line. A breakout could lead to a bullish run, while a breakdown might see the stock tumble towards lower levels.
Volume Confirmation: Watch the volume closely. A breakout with strong volume could confirm the move. On the other hand, if the price breaks down with increased volume, it could signal a bearish shift.
RSI and Other Indicators: Keep an eye on RSI and other momentum indicators to gauge the strength of the current trend.
Possible Scenarios
Bullish Scenario: If ICICIPRULI breaks above the channel resistance with significant volume, it could head towards the next resistance levels around ₹800-₹810.
Bearish Scenario: If the stock fails to hold the channel support and breaks down, we could see a pullback towards ₹735 or even lower.
Conclusion
ICICI Prudential Life Insurance Company Limited is at a critical juncture, much like that tightrope walker deciding whether to step forward or retreat. While the ascending channel provides a structured path, the real question is – will the stock perform a grand finale with a breakout, or take a cautious step back? Stay tuned, and remember to enjoy the show while keeping an eye on those risk management strategies!

CUB City Union Bank Compression Swing Long Setup - CUB is currently trading at 170.6 and is showing signs of a huge expansionary move on a 4H TF
- CUB is currently compressing and trying to take more and more Liquidity out
- Make a note of a liquidity grab or deviation possibility before this shoots up
- 166-168 can be a good area to look for longs

Canara Bank 113.86 - Best Swing Trade 5 to 10%Stock will trade between 106.50 to 122.
By looking at recent data stock has split and has given dividend.
looking at volumes and deliverable quantity is around 40-50% stock might trade between 106 to 122.
once stock breaks 124 we might see stock move up to RS.141

Results goodStock give best results
Stock at supply zone
Must sustain 140 level
Can hits 200-220
No recommendation for buy and sell

HDFCBANK AnalysisHDFC Bank's Q4 performance has been applauded by many.
The amazing improvements in the deposit growth of the bank and improved fundamentals makes the stock look good for a medium to long term investment.
Here are the details-
CMP- 1524
Targets- 1580 (Short to Mid Term), 1600 (Mid to Long term)
Trailing Stoploss- 1465
Duration- Atleast 2-3 weeks, scope for long term investment.
Let me know what you think.

YESBANK (Weekly BO)YesBank is back from the dead and gave a weekly breakout. Add some qty once it retraces the support area.
NOTE: I'm not a SEBI REG. Study before investing.

Banknifty weekly expiry analysis for 07/02/24.Banknifty is consolidating in a range for last two trading session and chances are of a trending market on the expiry.
Vix is trading around 15, if it increases there will be another sideways market, else there can be a trend market if the Vix cools off.
Still, it is taking rejection from the 20 ema on the hourly charts, even the closing is below it.
In case of a gap down opening, bearish trend can be capture upto the support zone.
If there is a gap up opening, there will be confusion in the market and the expiry may remain silent.
Major bearish targets :- 45300, 4500
Enter the bearish move only when the market sustains below 45560 and shows some negative price action.
It has been respecting a trend line and taking rejection from it. Bullish entries should be avoided until markets start trading above 46500 level.
Resistance :- 46040, 46550
Wait for the price action near the levels before entering the market.

J&KBANK - Reverse Head and Shoulders PatternJammu and Kashmir Bank (J&K Bank) is a Scheduled Commercial Bank and one of the oldest private sector Bank in India, incorporated in 1938. The Jammu & Kashmir Bank Limited offers a range of products and services such as loans, insurance, tax products/planning, savings and deposits, cards, mutual funds and non-resident banking.
Financials:
TTM EPS: 13.10
TTM PE: 5.16
P/B: 1.01
Face Value: 1
Mkt Cap (Rs. Cr.): 6,977
Sector PE: 24.03
Book Value Per Share: 66.86
Positives:
Company with high TTM EPS Growth
Strong Annual EPS Growth
Good quarterly growth in the recent results
Efficient in managing Assets to generate Profits - ROA improving since last 2 year
Growth in Quarterly Net Profit with increasing Profit Margin (YoY)
Company with Low Debt
Increasing Revenue every Quarter for the past 4 Quarters
Annual Net Profits improving for last 2 years
Company with Zero Promoter Pledge
Negatives:
Red Flag: High Interest Payments Compared to Earnings
Decline in Net Profit with falling Profit Margin (QoQ)
My Opinion: Just like my conviction in PSU Banks, I believe J&K Bank will also give good returns in the coming years.
NOT A RECOMMENDATION. JUST FOR EDUCATION. Thanks.

08 Jan ’24 — BankNifty breaks the 47539 support - stance bearishBankNifty Analysis - Stance Bearish ⬇️
The chart of BankNifty was more dramatic and powerful. The total swing range was 765pts ~ 1.59%. The support of 47539 was broken only at 14.31 and there was not much time left for the next leg of fall today.
4mts chart link
What BankNifty and Nifty have done in January was to take out the stop loss twice. Last week we saw some strong fight back and they managed to get the stance changed from bearish to neutral. And today the tables have turned and the chart looks bearish. BankNifty has walked ahead of Nifty because it has already broken the ascending channel - so the break of support today should give it some more thrust.
63mts chart link
The support is only broken on the lower TF, we ran out of time for further action today. This means that the forenoon session will be quite critical tomorrow. If the bears can hold the banks below the 47539 levels - we could see some action picking up. The options flow also indicated an immense short buildup for the CALLS - which may be indicating tiredness in the uptrend. Our stance for tomorrow is bearish.
