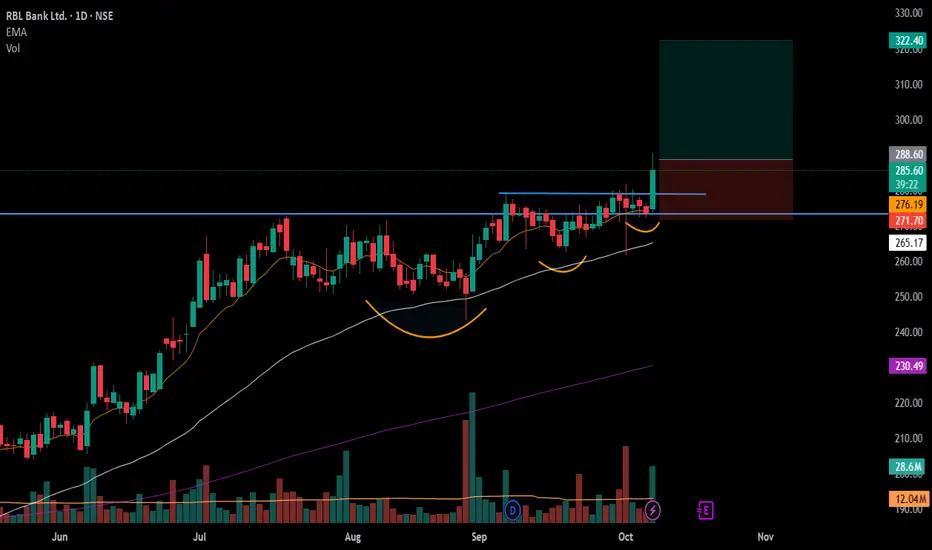
#RBLBANK - VCP BreakOut in Daily Time FrameScript: RBLBANK
Key highlights: 💡⚡
📈 VCP BreakOut in Daily Time Frame
📈 Volume spike during Breakout
📈 Large Base BreakOut – Zoom Out
📈 Private Bank Sector showing strength
📈 Can go for a swing trade
BUY ONLY ABOVE 288 DCB
⏱️ C.M.P 📑💰- 286.90
🟢 Target 🎯🏆 – 12%
⚠️ Stoploss ☠️🚫 – 6%
⚠️ Important: Market conditions are Bad, Position size 25% per Trade. Protect Capital Always
⚠️ Important: Always Exit the trade before any Event.
⚠️ Important: Always maintain your Risk:Reward Ratio as 1:2, with this RR, you only need a 33% win rate to Breakeven.
✅Like and follow to never miss a new idea!✅
Disclaimer: I am not SEBI Registered Advisor. My posts are purely for training and educational purposes.
Eat🍜 Sleep😴 TradingView📈 Repeat 🔁
Happy learning with MMT. Cheers!🥂
Basebreakout
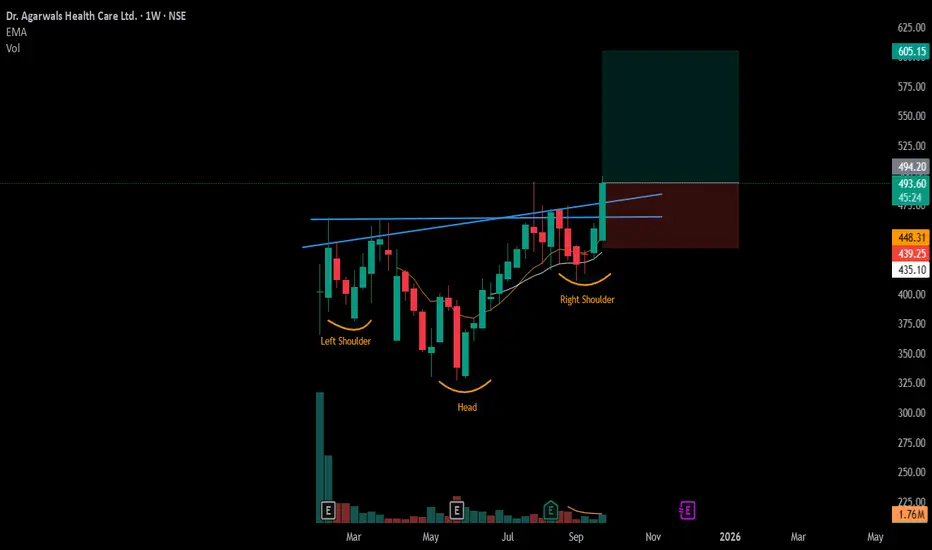
#AGARWALEYE - IPO Base BreakOut Script: AGARWALEYE
Key highlights: 💡⚡
📈 Inverse Head & Shoulders BreakOut in Weekly Time Frame
📈 Volume Okish during Breakout
📈 IPO Base BreakOut
📈 Can go for a swing trade
BUY ONLY ABOVE 495 DCB
⏱️ C.M.P 📑💰- 493
🟢 Target 🎯🏆 – 22%
⚠️ Stoploss ☠️🚫 – 11%
⚠️ Important: Market conditions are Bad, Position size 25% per Trade. Protect Capital Always
⚠️ Important: Always Exit the trade before any Event.
⚠️ Important: Always maintain your Risk:Reward Ratio as 1:2, with this RR, you only need a 33% win rate to Breakeven.
✅Like and follow to never miss a new idea!✅
Disclaimer: I am not SEBI Registered Advisor. My posts are purely for training and educational purposes.
Eat🍜 Sleep😴 TradingView📈 Repeat 🔁
Happy learning with MMT. Cheers!🥂
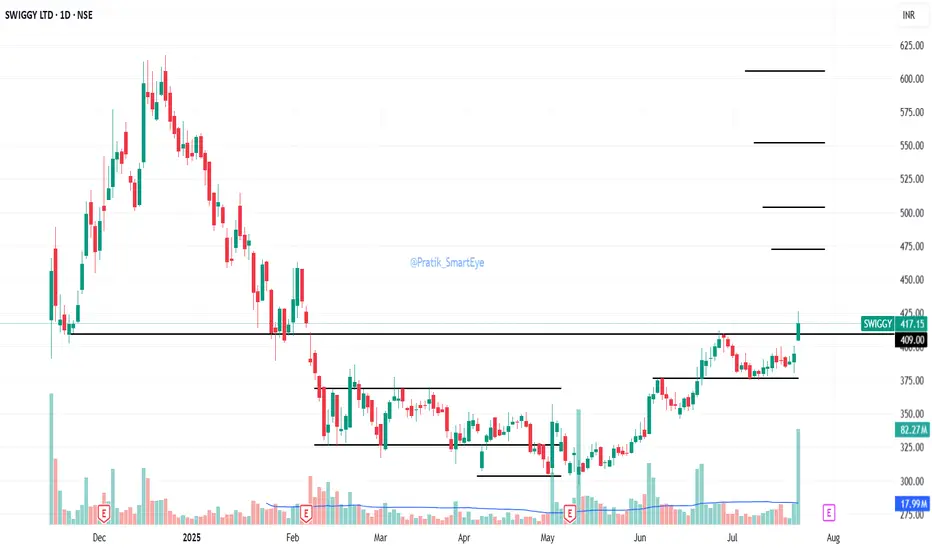
Swiggy: Base BreakoutSwiggy: up 5.67% today CMP 417, tested the resistance of 409 on 27June25 as indicated previously followed by retracement & bounce.
Breakout above 409 supported with good volumes today.
Resistance 472/504/551/605
Support 409/376
Earnings expected on 31July25
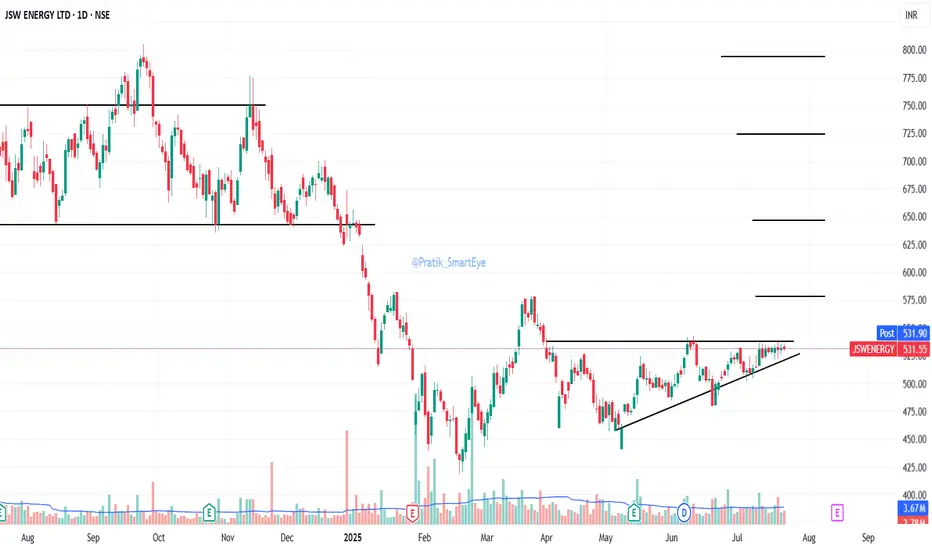
JSW Energy: forming a ascending triangleJSW Energy: forming a ascending triangle. CMP 531.
Breakout at sustained close above 540.
Resistance 578/646/724/794
Support 515/508
Earnings expected on 14Aug25
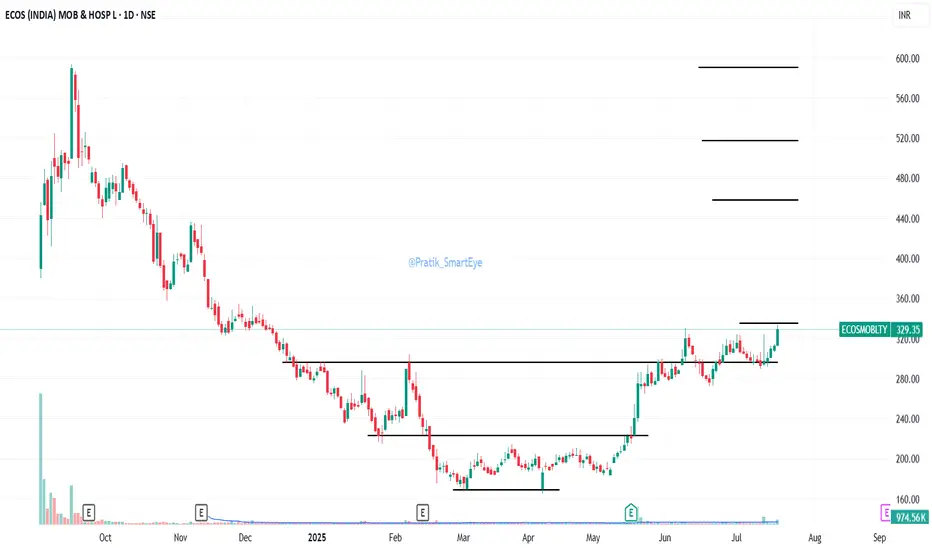
ECOSMOBLTY: IPO Stock Base BreakoutECOSMOBLTY: IPO Stock Base Breakout with volumes. CMP 329.
Resistance at 335/458/517/590
Support at 300
Breakout vs Fakeout: Master this logic to become a better TraderBreakouts can be deceiving. In this video, I dive deep into the psychology and structure behind breakouts vs fakeouts, how to spot the traps, and how to trade them with precision.

PNGJL: Forming IPO Base with Cup & HandlePNGJL: Forming IPO Base with Cup & Handle pattern,
breakout closing above 621. CMP 609.95
Resistance 663/723/780/830
Support 575
Strong Q1 FY26 Quarterly update.

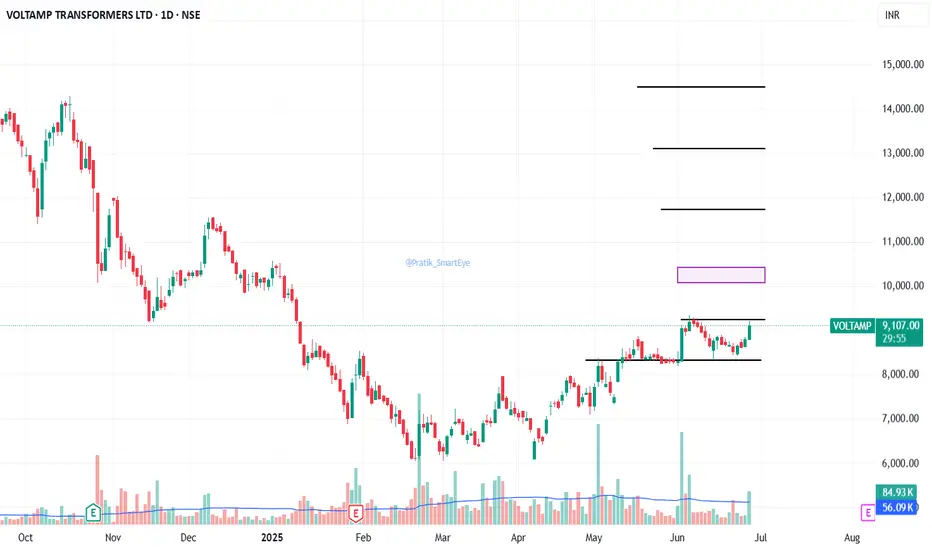
Voltamp Transformers: Base BreakoutVoltamp Transformers: Base Breakout at 9250. CMP 9100.
Resistance & Support marked on charts.
MANINFRA : Base BreakoutMANINFRA : Base Breakout supported with volumes in past 2 trading days.
CMP 181.
Resistance marked on chart.

Electrosteel Castings: at Base Breakout levels.Electrosteel Castings: at Base Breakout levels. CMP 132.
Resistance marked on charts.

Fino Payments Bank: at Base BreakoutFino Payments Bank: at Base Breakout. CMP 299.
Resistance at 318/386/413

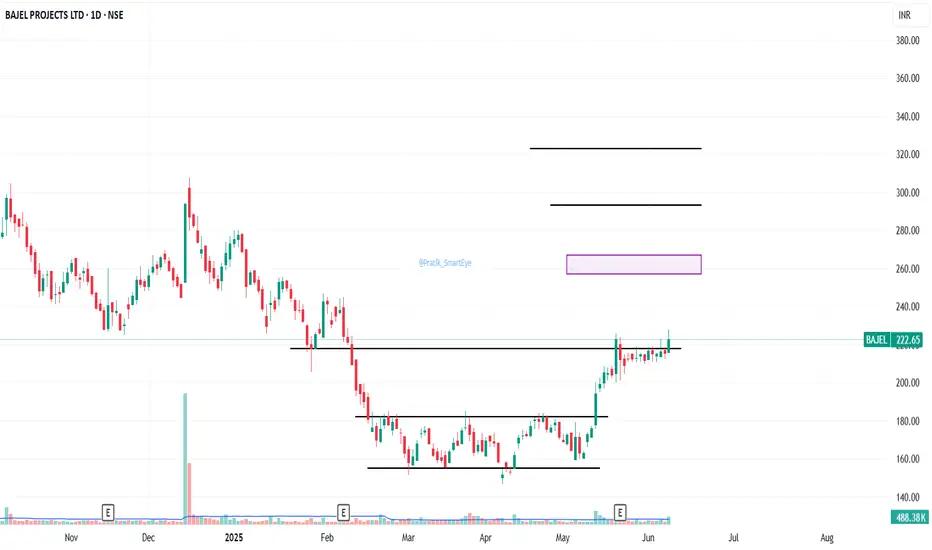
Bajel Projects : at Base BreakoutBajel Projects : at Base Breakout. CMP 222
Resistance 267/293/323
Support 204

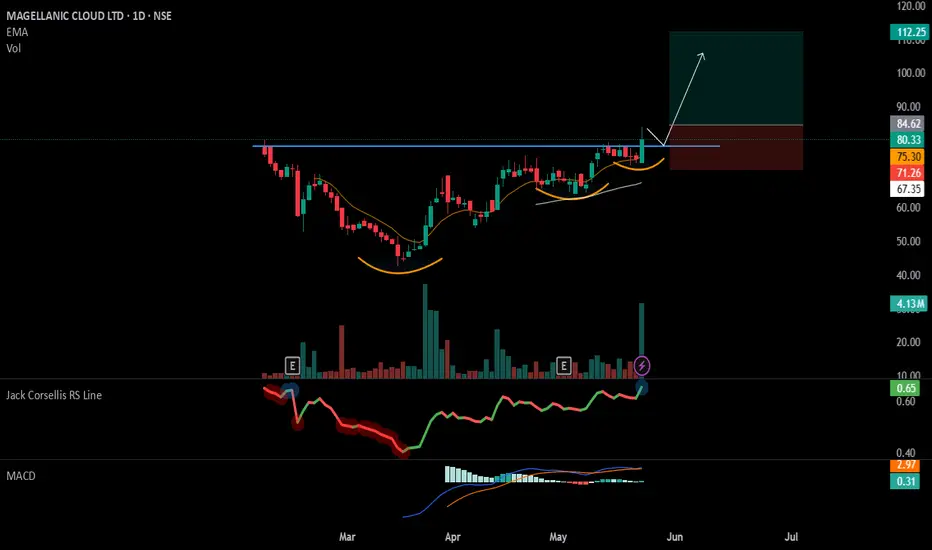
#MCLOUD - VCP + IPO Base Break Out📊 Script: MCLOUD
Key highlights: 💡⚡
📈 VCP + IPO Base BreakOut in Daily Time Frame.
📈 Price consolidated near Resistance.
📈 Volume spike seen
📈 MACD Crossover
📈 Can go for a swing trade
BUY ONLY ABOVE 85 DCB
⏱️ C.M.P 📑💰- 80.33
🟢 Target 🎯🏆 – 31%
⚠️ Stoploss ☠️🚫 – 15%
️⚠️ Important: Market conditions are Okish, Position size 50% per Trade. Protect Capital Always
⚠️ Important: Always Exit the trade before any Event.
⚠️ Important: Always maintain your Risk:Reward Ratio as 1:2, with this RR, you only need a 33% win rate to Breakeven.
✅Like and follow to never miss a new idea!✅
Disclaimer: I am not SEBI Registered Advisor. My posts are purely for training and educational purposes.
Eat🍜 Sleep😴 TradingView📈 Repeat 🔁
Happy learning with MMT. Cheers!🥂
Gabriel India -Double Bottom Breakout!📊 Gabriel India - Positional Breakout Trade
🔍 Technical Overview:
✅ Trend: Strong uptrend, followed by a 32% correction and a double bottom formation .
✅ Breakout Confirmation: Cleared ₹565 resistance with strong volume.
✅ Key Levels:
Entry: Above ₹600 (Earlier breakout was at ₹565)
Stop Loss: ₹475 (Closing basis) 🔻
Positional Target: ₹824 (Tentative) 🎯
✅ Moving Averages: Trading above key DMAs, indicating strength.
✅ Market Condition: Stock is breaking out early as markets show signs of recovery.
⚠ Risk Management & Position Sizing:
Risk per trade: More than 20%, so position sizing is 🔑.
Recommended Approach:
Enter 25% now and accumulate on retest.
Do NOT go all-in – respect SL at all costs! 🚨
Current market structure: Still in LL-LH (Lower Low - Lower High). This could be a counter-trend pullback or a bull trap—stay cautious.
📈 Fundamental Overview:
Market Cap: ₹8,463 Cr
Current Price: ₹589
52W High/Low: ₹598 / ₹326
P/E Ratio: 40.2
Book Value: ₹74.9
Dividend Yield: 0.68%
ROCE: 26.7%
ROE: 19.6%
Debt-Free Company 💰
Sales, EPS, and Profits improving YoY 📈
🛑 Final Thoughts:
Market concerns still exist—we don’t know if this is the bottom or a reversal yet.
Control FOMO! Watch for market confirmation before adding aggressively.
If you struggle with risk management, sit on the sidelines—waiting is also a trade.
⚠ Disclaimer:
This is NOT financial advice. Trade at your own risk and follow your own risk management rules. 📉📈

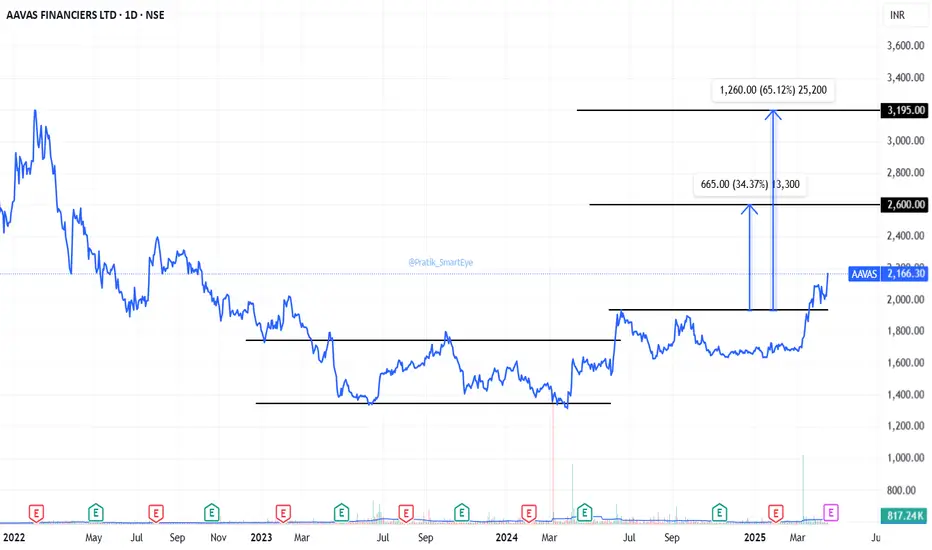
Aavas Finance: Base BreakoutAavas Finance: Base Breakout at 1935. CMP 2166.
Resistance at 2600, Rounding Bottom target of 3195.
Results expected on 24Apr2025.
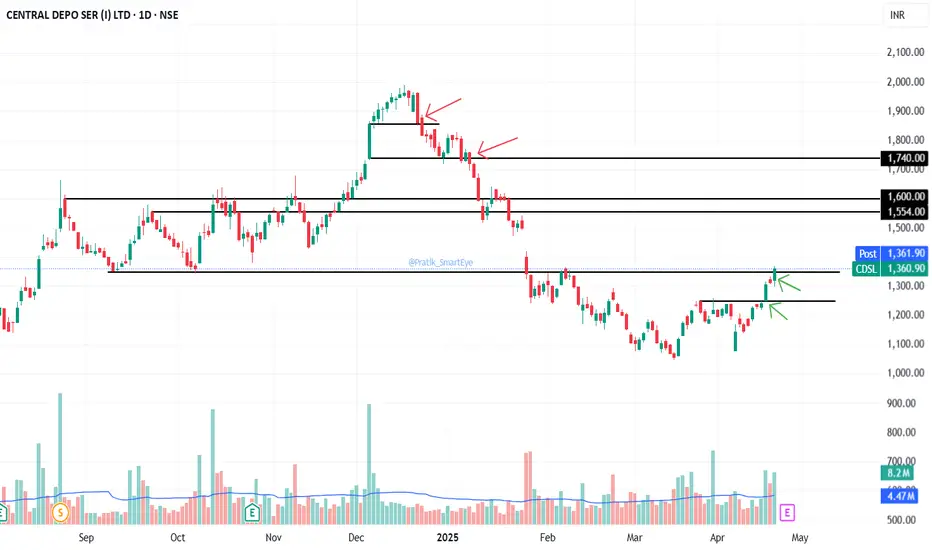
CDSL: at Base Breakout Levels of 1350CDSL: at Base Breakout Levels of 1350. CMP 1360.
Momentum is strong supported with volumes. Sustaining the levels is important.
Results expected on 28Apr2025.
Levels Marked on chart.
IDBI Bank: Base BreakoutIDBI Bank: Base Breakout supported with volumes. CMP 89.64
Resistance at 95.65/100/105
Support at 82.20

SARDAEN - Breakout WatchlistWhy This Stock?
✅ Base Breakout – Breaking above ₹526.2 with strong volume confirmation (4-5x past trading sessions).
✅ Trading Above Key DMAs – Strong price structure with good RSI.
✅ No Left-Side Resistance – Clean chart structure with potential for an uptrend.
✅ Formation of W Pattern + VCP – Classic bullish continuation setup.
✅ Resisted Market Fall – Showcasing relative strength despite overall weakness.
Safe traders wait for a weekly close above the break-out level ₹526.2.
Key Levels
📌 Entry: ₹538.50
📌 SL (Closing Basis): ₹423.10
📌 Breakout Level: ₹526.2
Fundamentals (Key Metrics)
Market Cap: ₹18,979 Cr.
Stock P/E: 27.9
ROCE: 15.3%
ROE: 14.1%
Sales Growth (YoY): Improving
OPM % YoY Improving
EPS YoY: Improving.
What Could Go Wrong?
⚠️ Overall Market Trend is Bearish – Any weakness in broader indices can drag the stock down.
⚠️ Sectoral Index is Weak – Lack of sectoral strength may limit upside potential.
⚠️ High SL Probability – Strong pullbacks can invalidate the breakout; hence, buy test quantities only.
⚠️ Deep SL
Why This is Worth Watching?
📈 Stocks that Fell Less in Correction – Often become early movers when the market stabilizes.
📈 Volume Picking Up – A good sign that institutional interest might be present.
🚨 Disclaimer: This is not a trade recommendation but a watchlist alert. Do your own research before making any trading decisions. 🚨

BEL – Sector Strength + Double Bottom + Volume Thrust 📈 BEL – Sector Strength + Double Bottom + Volume Thrust = A Setup Worth Tracking
The India Defence Index just broke into new all-time highs, possibly driven by rising geopolitical tensions — but beyond the headlines, the sector remains structurally strong.
BEL (Bharat Electronics Ltd) is showing powerful confluence:
A double bottom breakout
Sectoral support
Rising volumes
Key moving averages reclaimed
All of this sets up a technically sound positional opportunity.
🧠 Technical Highlights
✅ Stock trading above key DMAs
✅ Volume picking up — watch for 4x–5x surge to confirm strength
✅ ATH at ₹339.90 may act as resistance; clean breakout above it = add/fresh entry
✅ Defence sector index at ATH – macro tailwind active
🧮 Setup Overview
Entry Zone ₹32.7
Stop Loss (SL) ₹287.65
ATH Resistance ₹339.90
Target (Positional) ₹399.10
SL % -10.09%
Target % +24.72%
Risk : Reward 1 : 2.45
🧭 Suggested Strategy
🔄 Add 30–40% at breakout
🧘 Wait for pullback or retest to add more
🚫 Avoid chasing — shakeouts are very likely
🧠 Gradual accumulation + disciplined risk management > FOMO
📊 Volumes should confirm — clean candle with strong demand = green signal
⚠️ Final Note:
We are not entirely out of danger — markets can throw brutal pullbacks and false breakouts. Defensive positioning, proper sizing, and exit planning are essential.
📉 Disclaimer:
This is not a buy/sell recommendation. For educational purposes only. Do your own research and manage risk as per your trading style.

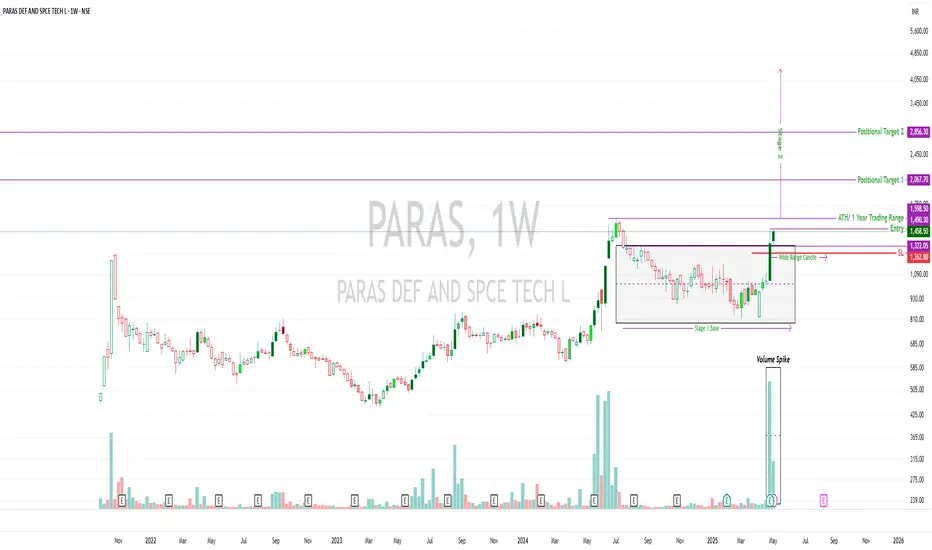
PARAS | Stage 2 Setup in Motion | ATH Watch🚀 PARAS | Stage 2 Setup in Motion | ATH Watch
Paras Defence & Space Tech Ltd | Weekly Chart
🔍 Technical Overview:
Stock has broken out of a Stage 1 base spanning nearly a year 📦
Printed a wide-range breakout candle with a massive volume spike – signs of institutional accumulation
Currently trading above all key DMAs, including the 50D, 200D, and 30W averages
Cleared the ₹1,490–₹1,598 zone (1-year range high), but...
⚠️ ATH Not Yet Broken
₹1,598.5 remains the all-time high (ATH)
A clean breakout + retest + continuation beyond this ATH will offer stronger confirmation for positional targets
Until then, it’s a high-potential but early breakout — watch follow-through closely
📊 Trade Levels
Entry: ₹1,458.5
SL (Closing Basis): ₹1,262.8
Positional Target 1: ₹2,067.7
Positional Target 2: ₹2,856.3
📐 Risk:Reward
Risk = ₹195.7
Reward to T1 = ₹609.2 → R:R = 1 : 3
Reward to T2 = ₹1,397.8 → R:R = 1 : 7
🧠 Notes for Traders:
This is a technically strong breakout from a deep base
But ATH is a major psychological level — wait for confirmation or follow-up strength
No early entries without defined risk, especially in a high-volume breakout
Retests can offer better entries with lower risk exposure
🛡️ Risk Management First
No matter how clean the chart looks, position sizing and stop-loss discipline are non-negotiable.
Trade only what aligns with your system and tolerance. Protect capital first, chase profits second.
📜 Disclaimer: This is a personal technical view. Not investment advice. Always do your own research or consult a SEBI-registered advisor before taking any trade.
ICICI Bank-Aiming for Double Bottom Breakout?ICICI Bank – Technical Analysis & Trade Plan
📈 Trend Analysis:
Stock is in a strong uptrend with a higher high, higher low (HH-HL) structure intact.
Consolidating since September 2024, forming a base.
Double bottom formation visible, with a potential VCP (Volatility Contraction Pattern) at play.
Trading above key DMAs, confirming strength.
Sectoral strength: Finance & banking showing momentum and could lead the next market move.
📊 Market Context:
Broader market is showing slight improvement but still in a lower low, lower high (LL-LH) structure.
Index closed above 50 DMA, gaining some momentum, but another round of correction cannot be ruled out.
The main reason for selecting this stock is strong sector movement.
🔍 Trade Plan:
✅ Entry: Above ₹1,328
🚨 Immediate Resistance: ₹1,363
📌 Add more: If ₹1,363 is broken with strong volume
🎯 Positional Target: ₹1,555
❌ Stop Loss (SL - Closing Basis): ₹1,180.45
📉 Risk & Reward Calculation:
Risk (SL to Entry): ₹1,328 - ₹1,180.45 = ₹147.55 (~ 11.11% downside risk)
Reward (Entry to Target): ₹1,555 - ₹1,328 = ₹227 (~ 17.1% upside reward)
Risk-to-Reward Ratio (R:R): 1:1.54 (Moderate reward vs. risk)
⚠️ Risk Considerations:
Overall market still in LL-LH structure → Could just be a pullback within a broader downtrend.
Position Sizing Key:
Consider entering only 30% of the usual position size.
Gradual accumulation near ATH (All-Time High) levels is a wise approach.
📢 Disclaimer: This is not financial advice. Trading involves risk, and past performance does not guarantee future results. Always do your own research and use proper risk management .

LIC Housing in consolidating, Base Breakout above 618.LIC Housing: in consolidation. Base breakout above 618 sustained closing basis.
Support/SL at 590/551.
Resistance at 658/717/808.
