Bearish Bat - InfratelBearish bat formed, and looks like reversal has started. Short position can be added on further pullback. ** Trade only for educational purposes. Do your own risk management and enter **IEducationby Market-ThalaivaaUpdated 1
NIFTY50 - Bullish Bat - 2H TFBullish Bat pattern forming on 2 Hours Chart of NIFTY INDEX. BUY 9765-9770, SL 9700, Target(s) - 9840, 9870.Longby c0dchefUpdated 0
Bullish Harmonic Half Bat and Crab confluence - UltraCemCoBullish Harmonic Half Bat and Crab confluence - UltraCemCoLongby HarmonicsInAction11
Bullish Harmonic Half and Full Bat - #MarutiBullish Harmonic Half and Full Bat - #Maruti Maruti has formed a half bat and full bat confluence around same PRZ. Once it reaches the PRZ, we might get a divergence on RSI as well. One can go long with 5100 as SL.Longby HarmonicsInAction10
BankNifty Long Bullish BatI hope you can now see how the BANKNIFTY represents an excellent Bullish Bat low risk profit entry setup allowing you to trade in the market.Take positions so that the risk/reward is in your favour. Knowing why, where & when a strong reversal signal is being generated will be the only way to capitalize on your technical analysis . Disclaimer: It should not be assumed that the methods, techniques, or indicators presented in these chart will be profitable or that they will not result in losses. There is no assurance that the strategies and methods presented will be successful for you. Past results are not necessarily indicative of future results. You should not trade with money that you cannot afford to lose. Examples presented in these products are for educational purposes only and it should not be assumed that these are indicative of ordinary trades. These setups are not solicitations of any order to buy or sell. The publisher assume no responsibility for your trading results. There is a high degree of risk in trading.Longby EntryandExitUpdated 336
Vodafone Idea - Harmonic Bullish Bat Pattern - LongVodafone Idea Script will retrace to 0.50 - 7.65. Once the Script reaches - 7.65 go for Long.... target - 12 SL - 3.80 Disclaimer: Kindly do your own analysis before executing the tradeLongby Caapinves339
Cormandel International - Bearish Harmonic Bat Pattern - ShortCormandel International has formed Bearish Harmonic Bat Pattern .... If the script falls below 605 - go for Short SL - 660 Target 1 - 575 Target 2 - 550 Target 3 - 500 Target 4 - 450 Disclaimer: Kindly do your own analysis before executing the tradeShortby CaapinvesUpdated 3
RECLTD MONDAY JUNE 8, 2020 INTRADAY SETUPDisclaimer: All charts are purely for educational and information purpose only. Invest or Trade at your own risk. This Chart idea is on Basis of Volume Breakout that doesn't mean the stock price can go up but yes has high probability to do so.. Longby NIFTYTRADERSPITUpdated 1
Auropharma - Bearish Alternate Bat - Sell below 775 Disclaimer ----------------------------- All investments involve risk, and the past performance of a security, industry, sector, market, financial product, trading strategy, or individual’s trading does not guarantee future results or returns. Investors are fully responsible for any investment decisions they make. Such decisions should be based solely on an evaluation of their financial circumstances, investment objectives, risk tolerance, and liquidity needs. --------------------------------------------------------------------------------------------------------------------- This is a correction happening in Auropharma. It will be choppy & confusing as suggested earlier once we get the correction - going above 810 -This stock is getting ready for big moves later if holds strictly above 810 & crosses 840 as well. Trading Strategy -------------------------------- Sell Strictly Below 775 - with stops above 780 Once it falls below 770 then kindly trail stops to cost price of 775 Downside Target - 750 / Below 750 for 730 Shortby WaveTalksUpdated 131357
ONGC - The Next Portfolio Stock Pick @ 60 Disclaimer ----------------------------- All investments involve risk, and the past performance of a security, industry, sector, market, financial product, trading strategy, or individual’s trading does not guarantee future results or returns. Investors are fully responsible for any investment decisions they make. Such decisions should be based solely on an evaluation of their financial circumstances, investment objectives, risk tolerance, and liquidity needs. ----------------------------- Trading Strategy ----------------------------- Plan A (Short Term Trading) - Selling Strictly Below 82-83 Zone for Downside Target - 75/72 / Below 70 for 60 levels Plan B (Long term Trading) - Portfolio Stock Pick if holds strictly between 55-60 zone/watch 72-75 zone also as picking zone for targets 200+ / 300 + in months & years ahead. No Trading if falls below 55 levels ------------------------------The Danger Level------------------------- ---------------------------------------------------------------------------------------------------------------------- TradingView Profile Page to check previous ideas in.tradingview.com ----------------------------------------------------------------------------------------------------------------------- Thanks for your precious time & have a lovely Sunday & lovely week ahead. 12:32by WaveTalksUpdated 151592
SP500 Index- Nifty / Stock-ITC/Hindalco/Auropharma- Weekly CheckDisclaimer ----------------------------- All investments involve risk, and the past performance of a security, industry, sector, market, financial product, trading strategy, or individual’s trading does not guarantee future results or returns. Investors are fully responsible for any investment decisions they make. Such decisions should be based solely on an evaluation of their financial circumstances, investment objectives, risk tolerance, and liquidity needs. ----------------------------- SP500 Index - A possible top close to 3200 levels - Reasons for Top or Halting close to 3200 Wave Y = 61.8% of Wave -W Middle Line of Parallel Channel is close to 3200 levels Support / Hero turning their roles into Resistance / Villain - Polarity Reversal Concept close to 3200 levels Index- Nifty Nifty May Halt with Double Top at 10175 / Below 10175 for 10050 / Below 10050 for 9950 / More below 9950 Stock -ITC Sell Below below 200 (strictly) for 195-196 / Below 195 for 190 / Below 190 for 185-186 Stock - Hindalco Selling below 150-151 (Strict Stops above 151) Target -148 / 145.50 / 143 / 138 / 130-132 Stock - Auropharma Selling next below 721 for Target 700 & Below 700 for 650-660 zone 19:32by WaveTalksUpdated 424293
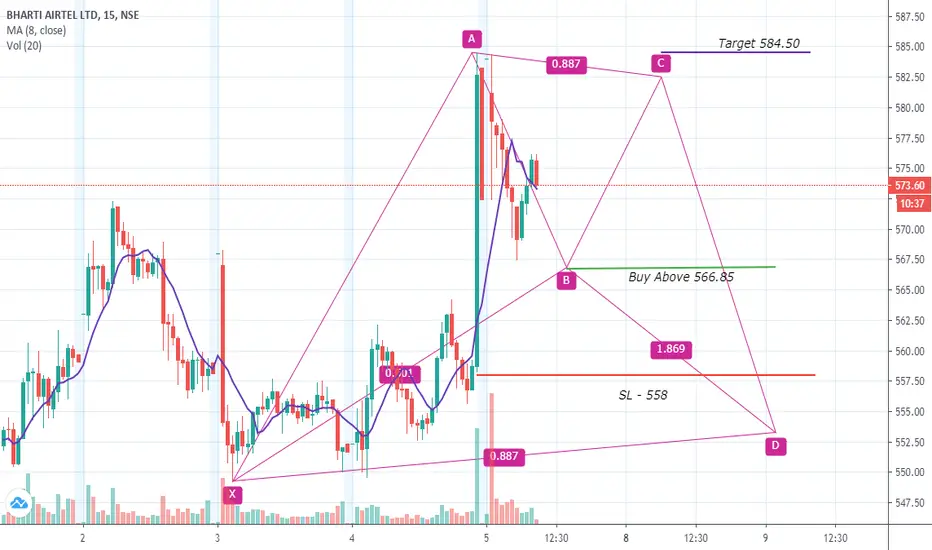
Bharti Airtel - Intraday - Harmonic Bullish Bat Pattern - LongAirtel has formed intraday bullish harmonic bat pattern. Go for Long at 566.85 Target - 584.50 SL - 558Longby Caapinves336
Intraday Trade - Tata Consumer - LongTata consumer Product - Intraday Call. Go Long - 371.50 Target - 380 SL - 366 Disclaimer - Kindly do your own analysis before executing the tradeLongby CaapinvesUpdated 1
bearish bat on 3rd June 2020Next target should be 10800 on 15tf for 3rd JUNE 2020. Shortby gurudevmaneUpdated 1
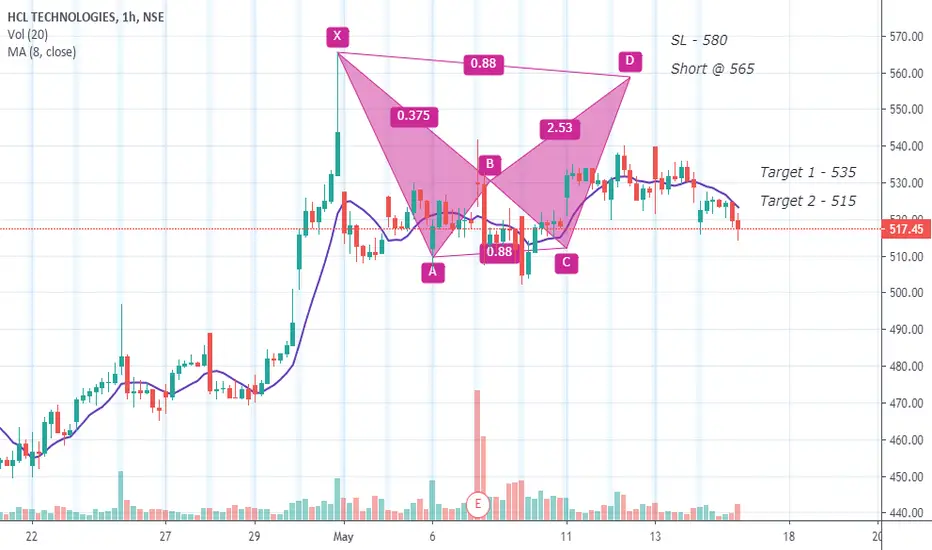
HCL - Harmonic Bat Pattern - ShortHCL has harmonic Bat Pattern in 1hr Chart. Hence, if the script reaches 565 we can short SL - 580 target 1- 535 target 2 - 515 Disclaimer: Kindly do your own analysis before executing the tradeShortby CaapinvesUpdated 3
Nifty - H&S Pattern or Hide & Seek Sell Below 9450/9375Disclaimer ----------------------------- All investments involve risk, and the past performance of a security, industry, sector, market, financial product, trading strategy, or individual’s trading does not guarantee future results or returns. Investors are fully responsible for any investment decisions they make. Such decisions should be based solely on an evaluation of their financial circumstances, investment objectives, risk tolerance, and liquidity needs. ---------------------------------------------------------------------------------------------------------------------------- Hide & Seek = In Hindi called "Luka Chipi" - This Video Starts with a lovely musical piece from Bollywood Movie - "Do Anjane" - "Luk Chip Jao Na" lead role played by Senior Bachchan- Bollywood Super Hero. ------------------------------------------------------------------------------------------------------------------------------ Trading Strategy ----------------------------------- Plan A ----------------- Sell Strictly below 9450 for 9375 / Continue Sell later only below 9375 for Target 1 - 9175-9161 Target 2 - Below 9175 for 8980-9000 Target 3 - Below 8950 for 8800 & 8700 Plan B ----------------- Selling The Alternate Bat Pattern in the zone 9650-9700 ( If Stops) with strict Stops above 9735 for Target - 9450 / Below 9450 for 9375 / Below 9375 for 9175-9161 ------------------------------------------------------------------------------------------------------------------------- Previous Ideas can be checked from TradingView Profile Page in.tradingview.com ------------------------------------------------------------------------------------------------------------------------- Thanks for watching this video & Thanks for your precious time. Have a wonderful week ahead. Short20:00by WaveTalksUpdated 6262125
Nifty IT - Harmonic Bearish Bat Pattern - ShortNifty IT has formed Harmonic Bearish Bat Pattern... If Nifty IT falls below 14000 go for Short. Target 1 - 13200 Target 2 - 12500 Target 3 - 11400 SL - 15000 Disclaimer: Kindly do your own analysis before executing the trade.Shortby Caapinves1
Nifty - Harmonic Bearish Bat Pattern - Weekly Chart - ShortNifty has formed Harmonic Bearish Bat Pattern. Nifty was in resistance Zone of 9650 and 10000 So as per the Pattern the nifty must fall from 9600. Short Nifty @ 9600 1. Target 1 - 9400 2. Target 2 - 9000 3. Target 3 - 8800 SL - 9700 Disclaimer : Kindly do your own analysis before executing the trade. Shortby CaapinvesUpdated 1
WILL A BAT RESCUE TATAMOTORS ?I hope you can now see how the TATAMOTORS represents an excellent BULLISH BAT low risk profit entry setup allowing you to trade in the market.Take positions so that the risk/reward is in your favour. Knowing why, where & when a strong reversal signal is being generated will be the only way to capitalize on your technical analysis . Disclaimer: It should not be assumed that the methods, techniques, or indicators presented in these chart will be profitable or that they will not result in losses. There is no assurance that the strategies and methods presented will be successful for you. Past results are not necessarily indicative of future results. You should not trade with money that you cannot afford to lose. Examples presented in these products are for educational purposes only and it should not be assumed that these are indicative of ordinary trades. These setups are not solicitations of any order to buy or sell. The publisher assume no responsibility for your trading results. There is a high degree of risk in trading. Longby EntryandExit3
LONG ICICIBANKI hope you can now see how the ICICIBANK represents an excellent low risk profit entry setup allowing you to trade in the market.Take positions so that the risk/reward is in your favour. Disclaimer: It should not be assumed that the methods, techniques, or indicators presented in these chart will be profitable or that they will not result in losses. There is no assurance that the strategies and methods presented will be successful for you. Past results are not necessarily indicative of future results. You should not trade with money that you cannot afford to lose. Examples presented in these CHART are for educational purposes only and it should not be assumed that these are indicative of ordinary trades. These setups are not solicitations of any order to buy or sell. The publisher assume no responsibility for your trading results. There is a high degree of risk in trading. Longby EntryandExit2