DIVISLAB - Bullish Momentum + RSI & MACD Breakout📈 Divis Laboratories Ltd | Bullish Momentum + RSI & MACD Breakout 🚀
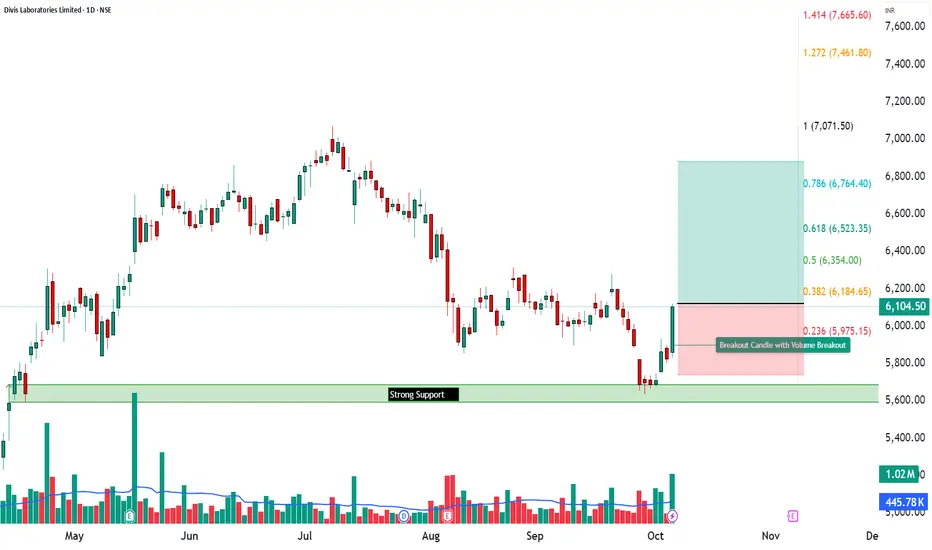
🔹 Entry Zone: ₹6,100 – ₹6,120
🔹 Stop Loss: ₹5,739.80 (Risk ~₹380 pts)
🔹 Supports: 5,917.33 / 5,730.17 / 5,628.83
🔹 Resistances: 6,205.83 / 6,307.17 / 6,494.33
________________________________________
🔑 Key Highlights
✅ Strong Bullish Candle – powerful reversal from key support zone
✅ RSI Breakout – momentum confirmation after prolonged base
✅ MACD Crossover – positive trend shift visible
✅ Bullish SuperTrend + VWAP Alignment – institutional momentum confirmation
✅ BB Squeeze-Off → volatility expansion expected
________________________________________
🎯 STWP Trade View
📊 Momentum suggests a short-term bullish rally is in play.
A close above ₹6,200 may open further upside toward ₹6,307 – ₹6,494.
⚠️ Supports at ₹5,917 & ₹5,730 act as crucial protection zones.
Volume spike confirms fresh long build-up — a classic “Buy Today, Sell Tomorrow” setup.
________________________________________
💡 Learning Note
This setup beautifully showcases how combining RSI Breakout + MACD Crossover + VWAP alignment strengthens a momentum-based reversal.
When such signals converge near Fibonacci supports, they offer high-probability swing setups with strong follow-through potential.
________________________________________
⚠️ Disclosure & Disclaimer – Please Read Carefully
The information shared here is purely for learning and awareness purposes.
It is not a buy or sell recommendation and should not be treated as investment advice.
I am not a SEBI-registered investment adviser — all observations are based on personal chart study and publicly available data.
Trading involves risk — markets can move unexpectedly, and losses can exceed invested amounts.
Past setups or patterns do not guarantee future outcomes.
If you’re a beginner, treat this content as a learning reference and start with paper trades.
If you’re experienced, align setups with your own risk and position sizing strategy.
Always consult a SEBI-registered advisor before executing any trades.
By engaging with this content, you accept full responsibility for your actions.
________________________________________
💬 Found this useful?
🔼 Give this post a Boost to help more traders learn structured setups
💬 Drop your thoughts or chart views below — let’s grow together
🔁 Share with fellow traders who love clean, data-backed analysis
👉 “If you liked this breakdown, follow for more disciplined, structured setups.”
🚀 Stay Calm. Stay Clean. Trade With Patience.
Trade Smart | Learn Zones | Be Self-Reliant 📊
Bbsqueeze
BRITANNIA - Cup & Handle Breakout Attempt📊 BRITANNIA – Technical & Fundamental Educational Snapshot
Ticker: NSE: BRITANNIA | Sector: FMCG – Packaged Foods & Biscuits
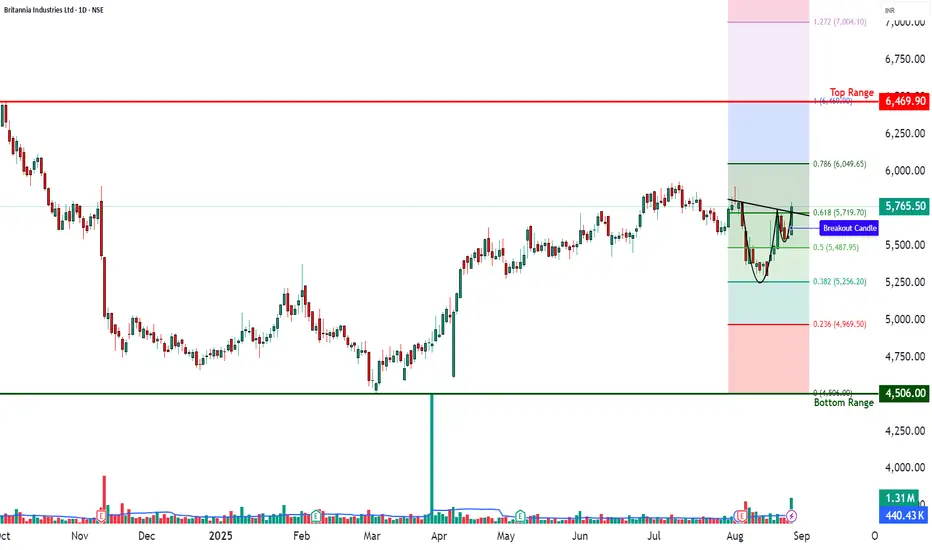
CMP: ₹5,765.50
Rating: ⭐⭐⭐⭐ (Bullish Setup – For Educational Purposes Only)
Pattern Observed: ☕📈 Cup & Handle Breakout Attempt
📊 Technical Observations
BRITANNIA (CMP: ₹5,765.5) is exhibiting a Cup & Handle breakout formation, confirmed by a strong bullish candle on heavy volumes. The stock has moved up from a recent bottom zone near ₹5,256–₹5,487 towards the neckline at ₹5,794, with key resistances placed at ₹5,848, ₹5,931, and ₹6,068, while supports are noted at ₹5,628, ₹5,491, and ₹5,408.
Technical indicators show RSI at 59 (breakout zone), a bullish MACD crossover, CCI at 76, and Stochastic at 94, highlighting strong upward momentum. The price action is supported by VWAP strength, and a Bollinger Band squeeze-off breakout, suggesting a possible trend continuation.
Volume surged to ~1.31M shares, significantly higher than the 20-day average of ~0.44M, indicating institutional participation. Based on the current momentum and technical structure, there is a strong possibility of breakout continuation; however, traders should carefully monitor the ₹5,628 and ₹5,518 levels as critical supports for risk management.
Britannia Industries has been in focus after analysts at PL Capital named it among their top stock picks, citing its strong positioning to benefit from India’s consumption revival. In its Q1 FY26 results, the company reported a consolidated net profit of ₹521 crore, up ~3% YoY, with revenues rising ~9% to ₹4,622 crore, though profitability fell short of street expectations due to higher input costs. Standalone performance was softer, with net profit down 0.8% YoY to ₹498 crore despite an 8.8% increase in revenue, reflecting margin pressure from raw material cost inflation. On the positive side, Britannia highlighted broad-based demand growth across both rural and urban markets and announced steps to boost the nutritional profile of its products by increasing whole grain content while reducing sugar and sodium, aligning with health-conscious consumer trends.
From a sentiment standpoint, the stock currently reflects a neutral to slightly positive bias. Bullish triggers include the ongoing consumption recovery, strong rural demand, analyst endorsements, product innovation, and sequential revenue growth. On the bearish side, rising input costs, weak standalone profitability, and rich valuations (P/E ~60) pose risks to near-term upside.
From an investment perspective, the outlook for Britannia remains mixed but constructive. On the bullish case, volume-led demand growth, health-focused innovation, and strong brand positioning could support further upside. On the bearish case, margin pressure and stretched valuations may limit near-term gains. In the short term (next few sessions), price action appears momentum-driven, supported by a bullish cup-and-handle breakout setup and strong institutional participation, making a continuation move possible in the next 1–2 days. Over the longer term (6–12 months), Britannia’s growth story remains intact provided cost pressures ease and the company sustains its demand momentum, aligning with PL Capital’s positive stance on the FMCG leader.
📊 STWP Trade Analysis – Under the STWP trade framework, one illustrative breakout scenario could involve a long entry near ₹5,794.50, with a protective stop at ₹5,518.40. In comparable past structures, price has tended to extend towards zones such as ₹5,848–₹5,880 (approx. 1:1 risk–reward), ₹5,931 (around 1:1.5 R:R), and ₹6,049–₹6,071 (approx. 1:2 R:R). If momentum accelerates, a stretch target may open towards ₹6,068 → ₹6,347.
An alternative, more conservative illustration could be a pullback entry in the ₹5,545–₹5,525 zone, with a tight invalidation stop at ₹5,518. A quick reaction pullback may also occur around the Fibonacci level of ₹5,719.70, before attempting a continuation higher. Upside zones remain aligned with the same resistance ladder (₹5,848–₹5,880 → ₹5,931 → ₹6,049–₹6,071 → ₹6,347).
Possible Demand Zone (Illustrative): ₹5,608.50 – ₹5,545
Stop Loss (tight): ₹5,537.90
Approximate Risk: ~₹70 per lot
⚠️ Risk Reminder:
Price momentum is strong but Stochastic readings are elevated, which may lead to volatility or shakeouts. Traders should trail stops actively (e.g., move SL to breakeven after T1, and under higher lows after T2). Market volatility, raw material cost changes, and broader FMCG index sentiment can influence outcomes. Past price behavior and backtests are illustrative only and do not guarantee future performance.
⚠️ Disclaimer – Please Read Carefully
The information shared here is meant purely for learning and awareness. It is not a buy or sell recommendation and should not be taken as investment advice. I am not a SEBI-registered investment advisor, and all views expressed are based on personal study, chart patterns, and publicly available market data.
Trading — whether in stocks or options — carries risk. Markets can move unexpectedly, and losses can sometimes exceed the money you have invested. Past performance or past setups do not guarantee future results.
If you are a beginner, treat this as a guide to understand how the market works — practice on paper trades before risking real money. If you are experienced, always assess your own risk, position sizing, and strategy suitability before entering trades.
Consult a SEBI-registered financial advisor before making any real trading decision. By engaging with this content, you acknowledge full responsibility for your trades and investments.
💬 Found this useful?
🔼 Give this post a Boost to help more traders discover clean, structured learning.
✍️ Drop your thoughts, questions, or setups in the comments — let’s grow together!
🔁 Share with fellow traders and beginners to spread awareness.
👉 “If you liked this breakdown, follow for more clean, structured setups with discipline at the core.”
🚀 Stay Calm. Stay Clean. Trade With Patience.
Trade Smart | Learn Zones | Be Self-Reliant 📊
KSCL – Technical & Educational Snapshot📊 KSCL – Technical & Educational Snapshot
Ticker: NSE: KSCL | Sector: 🌱 Seeds & Agro
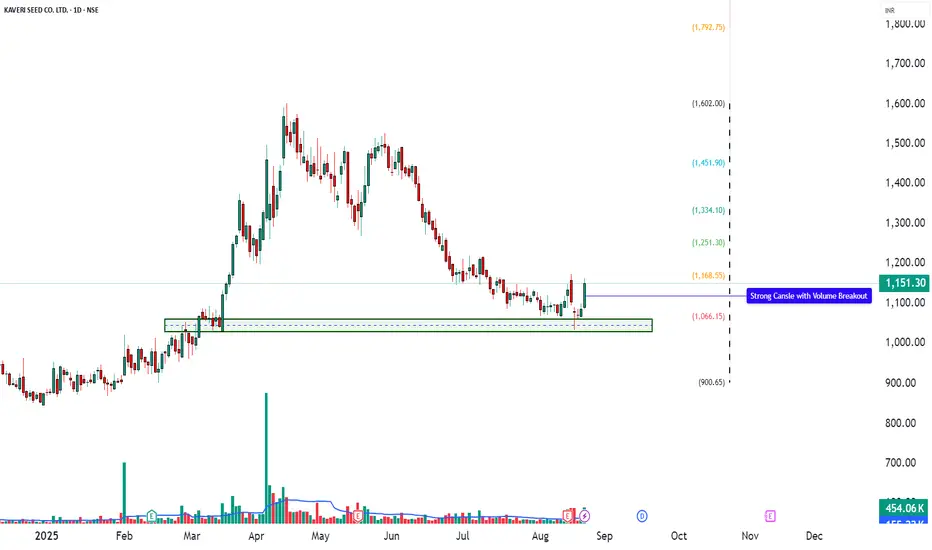
CMP: ₹1,151.30 ▲ (as of 21 Aug 2025)
Rating (for learning purpose): ⭐⭐⭐⭐
Pattern Observed: 📉 Double Top + Descending Wedge (target near ₹1,000 completed)
KSCL earlier formed a Double Top followed by a Descending Wedge breakdown, with the projected bearish reference zone being successfully achieved. With that completion, the stock has now entered a new phase, displaying fresh bullish momentum. A strong bullish candle, RSI breakout, and Bollinger Band expansion from a squeeze highlight renewed buying strength.
This technical shift points towards a possible trend reversal or at least a medium-term bounce, provided the price sustains above key resistance levels. Supporting indicators (MACD, CCI, Stochastic) are aligned in favor of momentum continuation, adding weight to the bullish case.
📊 Momentum Snapshot:
Momentum indicators are tilting to the bullish side. While Stochastic (84) is moderately elevated, the confluence of RSI breakout, MACD bullish crossover, and strong CCI indicates that momentum could sustain until higher resistance levels are tested.
📊 Volume Check
🔹 Current Volume: 454.06K
🔹 20 SMA Volume: 155.22K ✅
💥 Nearly 3x average volume – confirms strong institutional / broad-based buying interest!
💡 Interpretation:
When volume is well above the 20-period average, it strengthens the reliability of a breakout.
This shows the move is not just retail-driven but likely backed by larger participants.
High-volume breakouts tend to sustain better compared to low-volume moves.
💡 Learnings:
Breakouts emerging from a Bollinger Band Squeeze often lead to strong trending moves as volatility expands. When supported by confirmations such as RSI and MACD turning positive together, the reliability of the breakout improves significantly.
Elevated CCI values reflect strong buying momentum, though traders should remain mindful of possible pullbacks. Above all, defining clear stop-loss and invalidation levels ensures disciplined trade management.
📌 Fresh bullish signals are emerging → but confirmation only comes on sustained move above ₹1,180–1,209. Failure to hold above ₹1,100 may keep it in sideways consolidation or trigger further downward pressure.
🔑 Key Levels
Resistance: 1180 | 1209 | 1256
Support: 1104 | 1057 | 1028
Fibonacci Levels: 900.65 | 1066.15 | 1168.55 | 1251.30 | 1334.10 | 1451.90 | 1602
Pullback Level: Around 1104–1110 zone (first support & prior base)
Invalidation Level: Close below 1057 (would negate the bullish setup)
📝 STWP Trade Setup
📌 Entry (Long): Above 1,162
🛡 Stop Loss: 1,059 or below
🎯 Reference Levels: 1264 | 1366
⚠️ Disclaimer – Please Read Carefully
The information shared here is meant purely for learning and awareness. It is not a buy or sell recommendation and should not be taken as investment advice. I am not a SEBI-registered investment advisor, and all views expressed are based on personal study, chart patterns, and publicly available market data.
Trading — whether in stocks or options — carries risk. Markets can move unexpectedly, and losses can sometimes exceed the money you have invested. Past performance or past setups do not guarantee future results.
If you are a beginner, treat this as a guide to understand how the market works — practice on paper trades before risking real money. If you are experienced, always assess your own risk, position sizing, and strategy suitability before entering trades.
Consult a SEBI-registered financial advisor before making any real trading decision. By engaging with this content, you acknowledge full responsibility for your trades and investments.
💬 Found this useful?
🔼 Give this post a Boost to help more traders discover clean, structured learning.
✍️ Drop your thoughts, questions, or setups in the comments — let’s grow together!
🔁 Share with fellow traders and beginners to spread awareness.
✅ Follow simpletradewithpatience for beginner-friendly setups, price action insights & disciplined trading content.
🚀 Stay Calm. Stay Clean. Trade With Patience.
Trade Smart | Learn Zones | Be Self-Reliant 📊
TIINDIA – Technical & Educational Snapshot📊 TIINDIA – Technical & Educational Snapshot
Ticker: NSE: TIINDIA | Sector: 🏭 Industrial Manufacturing
CMP: ₹ ▲ (as of 20 Aug 2025)
Rating (for learning purpose): ⭐⭐⭐⭐
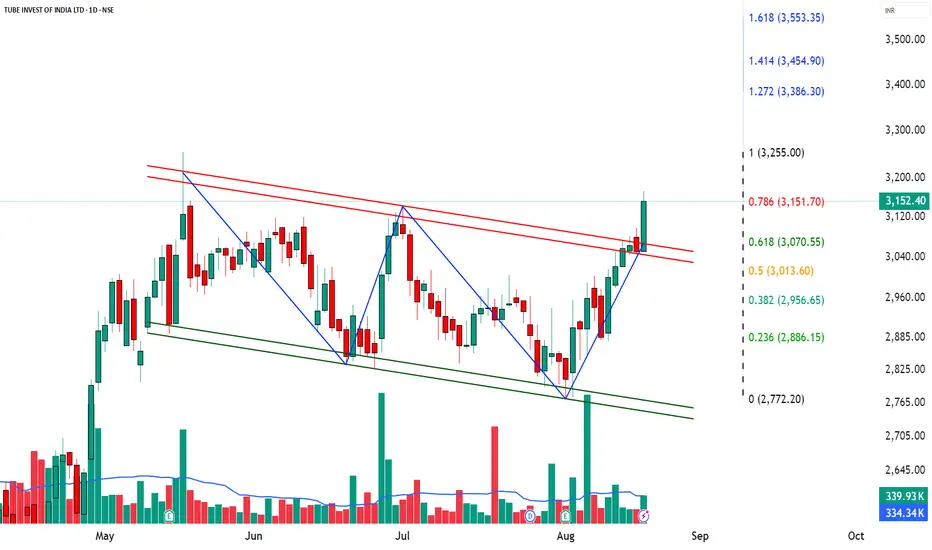
Pattern Observed: 📈 Channel Breakout
TIINDIA is showing strong bullish momentum across multiple technical indicators. The presence of a strong bullish candle, combined with an RSI breakout at 68, indicates significant buying pressure. The Bollinger Band breakout and BB Squeeze-Off suggest increased volatility and the potential for a strong upward move. Bullish VWAP confirms the trend is supported by average price strength, while MACD bullish, CCI at 178, and Stochastic at 95 all point to strong near-term momentum, signaling a likely continuation of the upward trend.
📊 Volume Check:
🔹 Current Volume: 339.93k
🔹 20SMA Volume: 334.34k ✅
💥 Slightly above average – confirming possible buying interest!
💡 Learnings:
Breakouts with above-average volume are more reliable as they indicate real buying interest.
RSI, MACD, CCI, and Stochastic together provide a strong confirmation of momentum.
Bollinger Band squeeze-offs often precede strong directional moves – a good cue for potential entry. Identifying pullback areas and invalidation levels helps manage risk effectively.
Key Levels:
Resistance: 3200 | 3248 | 3323
Support: 3077 | 3002 | 2954
Pullback Area: 3013–3070
Invalidation Level: Close below 2956
STWP Trade Setup:
Entry (Long): Above 3172.90
Stop Loss: 3039.80 or below
Reference Levels: 3306 | 3439
⚠️ Disclaimer – Please Read Carefully
The information shared here is meant purely for learning and awareness. It is not a buy or sell recommendation and should not be taken as investment advice. I am not a SEBI-registered investment advisor, and all views expressed are based on personal study, chart patterns, and publicly available market data.
Trading — whether in stocks or options — carries risk. Markets can move unexpectedly, and losses can sometimes be larger than the money you have invested. Past performance or past setups do not guarantee future results.
If you are a beginner, treat this as a guide to understand how the market works — practice on paper trades before risking real money. If you are an experienced trader, remember to assess your own risk, position sizing, and strategy suitability before entering any trade.
Consult a SEBI-registered financial advisor before making any real trading decision.
By reading, watching, or engaging with this content, you acknowledge that you take full responsibility for your own trades and investments.
💬 Found this useful?
🔼 Give this post a Boost to help more traders discover clean, structured learning.
✍️ Drop your thoughts, questions, or setups in the comments — let’s grow together!
🔁 Share with fellow traders and beginners to spread awareness.
✅ Follow simpletradewithpatience for beginner-friendly setups, price action insights & disciplined trading content.
🚀 Stay Calm. Stay Clean. Trade With Patience.
Trade Smart | Learn Zones | Be Self-Reliant 📊
TATA MOTORS – Technical & Educational Snapshot📊 TATA MOTORS – Technical & Educational Snapshot
Ticker: NSE: TATAMOTORS | Sector: 🚗 Automobiles
CMP: ₹ ▲ (as of 20 Aug 2025)
Rating (for learning purpose): ⭐⭐⭐⭐
Pattern Observed: 📈 Channel Breakout
Tata Motors is showing strong bullish signals across multiple technical indicators. The RSI has broken out to 62, reflecting healthy buying momentum without being overbought, while the MACD remains bullish, confirming upward momentum. The SuperTrend and VWAP are both bullish, supporting the upward trend, and the CCI at 98 along with a Stochastic of 96 indicate strong near-term strength. Additionally, the Bollinger Band squeeze has released, suggesting increased volatility and a likely breakout. Altogether, these signals point toward a potential continuation of the bullish move in the near term.
Key Levels:
Resistance: 711 | 722 | 742
Support: 681 | 662 | 651
Pullback Area: 671–685
Invalidation level: 654
STWP Trade Analysis:
Entry (Long): Above 703.35
Stop Loss: 656 or below
Reference Levels: 750 | 796
⚠️ Disclaimer – Please Read Carefully
The information shared here is meant purely for learning and awareness. It is not a buy or sell recommendation and should not be taken as investment advice. I am not a SEBI-registered investment advisor, and all views expressed are based on personal study, chart patterns, and publicly available market data.
Trading — whether in stocks or options — carries risk. Markets can move unexpectedly, and losses can sometimes be larger than the money you have invested. Past performance or past setups do not guarantee future results.
If you are a beginner, treat this as a guide to understand how the market works — practice on paper trades before risking real money. If you are an experienced trader, remember to assess your own risk, position sizing, and strategy suitability before entering any trade.
Consult a SEBI-registered financial advisor before making any real trading decision.
By reading, watching, or engaging with this content, you acknowledge that you take full responsibility for your own trades and investments.
💬 Found this useful?
🔼 Give this post a Boost to help more traders discover clean, structured learning.
✍️ Drop your thoughts, questions, or setups in the comments — let’s grow together!
🔁 Share with fellow traders and beginners to spread awareness.
✅ Follow simpletradewithpatience for beginner-friendly setups, price action insights & disciplined trading content.
🚀 Stay Calm. Stay Clean. Trade With Patience.
Trade Smart | Learn Zones | Be Self-Reliant 📊

USHAMART READY FOR FRESH BREAKOUTBuy above 77 stop loss 67 on
daily closing basis with 5% buffer
on low TGT Open
Trail SL Middle Band on daily closing basis

ITI - symmetrical triangle formation going on,watch for breakoutsymmetrical triangle formation going on in daily and weekly
volatility decreasing and BB is squeezing, breakout to be followed soon.
since it was in an strong uptrend, upside breakout expected here.
safe traders should wait for breakout. Risky traders may enter with a sl - 91.
we ll discuss on tgt after the breakout.
