BDL - Breakdown With Reactive Oversold Conditions💹 Bharat Dynamics Ltd (NSE: BDL)
Sector: Defence | CMP: 1324.3
View: Bearish — Breakdown With Reactive Oversold Conditions
BDL has decisively broken below its recent consolidation structure near the 1350–1380 zone, confirming a bearish continuation phase rather than a routine pullback. The breakdown candle is wide-ranged and supported by above-average volume, signalling active supply dominance and institutional distribution. This move has pushed price into lower demand territory, invalidating earlier stabilization attempts and keeping the broader structure tilted to the downside.
From a structural standpoint, the stock remains firmly in a lower-high, lower-low sequence, with price trading well below its short- and medium-term moving averages. RSI has slipped to around 29.8, placing the stock in an oversold zone, but this should be read as exhaustion within a downtrend, not as a reversal signal. Stochastic is deeply oversold, while MACD remains negative with expanding bearish momentum, indicating sellers continue to control price discovery. ADX suggests the trend phase is still active, though volatility is beginning to rise as price approaches nearby demand.
Volume behaviour adds important context. While participation is above average (Vol-X ~1.06), it is not climactic, implying that selling pressure is orderly and controlled, not panic-driven. This keeps the door open for short-term reactive bounces, but does not yet support a structural trend change.
Key Support & Resistance Zones (Chart-Aligned)
Resistance Zones:
• 1348–1373 (broken base, now supply)
• 1387 (upper supply / rejection zone)
Support Zones:
• Support 1: 1309.93 (minor demand, reaction-level support)
• Support 2: 1295.57 (intermediate demand)
• Support 3: 1271.03 (next structural support)
Support 1 at 1309.93 is expected to act as a pause or bounce zone, not a reversal base. A sustained breakdown below this level increases downside probability toward 1295.57 and 1271.03, while any bounce into the 1348–1373 region is likely to face renewed supply unless accompanied by clear structural improvement.
On the derivatives side, the 1320 PUT is referenced purely for analytical insight. The option shows an LTP near 25 with a delta of about -0.45, offering balanced directional sensitivity. A sharp OI contraction of over 30 percent alongside a strong volume expansion highlights short-covering-led activity, not aggressive fresh bearish positioning. IV remains in a mid-range band, consistent with reactive price behaviour rather than sustained trend acceleration.
Overall, BDL remains in a bearish structural phase with weak momentum and elevated risk. Short-term oversold bounces are possible near Support 1, but the larger framework continues to favour sell-on-rise behaviour unless price reclaims resistance with strong follow-through and volume confirmation.
Final Outlook (Educational Snapshot):
Momentum: Weak | Trend: Down | Risk: Low| Volume: Normal
⚠️ STWP Legal Disclaimer
This document is strictly for educational and informational purposes. All examples, charts, levels, and option structures discussed are illustrative and are not intended as buy, sell, or hold recommendations. STWP does not provide investment advice, trading tips, signals, or personalized financial guidance of any kind, nor is it a SEBI-registered intermediary or research analyst. The analyses, illustrations, and risk–reward structures included here are generic in nature and based on publicly available data and observed market behaviour, which may change without notice. Financial markets involve significant risk; derivatives in particular carry the potential for substantial losses. Option premiums, implied volatility, open interest, delta, and other market variables can fluctuate rapidly and unpredictably.
Readers are solely responsible for their trading decisions, capital management, and risk assessment. Before making any investment or trading decision, please consult a SEBI-registered investment advisor. STWP, its representatives, and affiliates shall not be liable for any direct or indirect loss arising from the use of this material. Historical patterns or past market behaviour do not guarantee future outcomes, nor should any part of this document be interpreted as a promise of performance, accuracy, or returns.
Position Status: No active position in this instrument at the time of analysis.
Data Source: TradingView & NSE India.
💬 Found this useful?
🔼 Boost this post to support structured learning
✍️ Share your thoughts or questions in the comments
🔁 Forward this to traders who value clean technical studies
👉 Follow for disciplined, structured, STWP-style analysis
🚀 Stay Calm. Stay Clean. Trade With Patience.
Trade Smart | Learn Zones | Be Self-Reliant 📊
BDL

STWP Breakout Watchlist – [14.09] | Key Stocks for Swing TradersSTWP Breakout Watchlist – | Key Stocks for Swing Traders 📊🚀
Markets are buzzing with momentum as multiple stocks show strong breakout signals backed by volumes and clean chart structures 🚀. Today’s watchlist highlights finance heavyweights and defence leaders that are attracting trader attention with fresh swing setups. Let’s decode the key levels, supports, and resistances to track for the coming sessions 🔑.
________________________________________________________________________________
________________________________________________________________________________
BAJFINANCE – 1003.25 (3.41%)
📊 Technical Indicators Explained
Bajaj Finance has given a powerful breakout 🚀 as it clears a long consolidation zone with a strong bullish Marubozu candle backed by heavy volume. The stock posted volumes almost 2 times its 20-day average, reflecting active trading and stronger-than-usual participation. Elevated volumes like this often support the sustainability of the underlying trend.
The chart highlights multiple bullish signals — strong momentum, a 52-week breakout, RSI breakout ⚡ confirming strength, and a Bollinger Band squeeze-off 📊 hinting at fresh volatility expansion. With VWAP support and intraday swing confirmation, the setup looks robust.
As long as key supports at 981 / 959 / 947 are protected, the stock can eye resistances at 1015 / 1026 / 1048 and possibly move towards higher upside levels of 1062 and 1120 in the coming sessions, with a possible demand zone at 975.90 – 965.60.
Bajaj Finance recently touched a 52-week high, driven by strong trading volumes (as per MarketWatch).
The company has set an ambitious goal to grow its loan book to ₹10 lakh crore by FY29, while also working on internal succession planning for senior leadership roles (as per Economic Times).
________________________________________
📈 Investment Outlook & Conclusion
📈 Bullish Case – Momentum with volume support may extend gains towards resistances.
📉 Bearish Case – Breach below 970 can attract selling pressure.
⚡ Momentum Case – Well-aligned for short swing trades.
📅 Perspective – Short-term momentum positive; long-term depends on loan book growth and asset quality.
________________________________________
📊 STWP Trade Analysis – BAJFINANCE
Bajaj Finance has given a strong breakout with momentum and volume confirmation 🚀
👉 For me, my entry zone is around 1004.60, aligned with the breakout structure considering 946.70 as my stop loss.
👉 If the stock dips towards 975.90 – 965.60 (Pullback zone), I will see that as a conservative re-entry with tighter risk.
🔑 Key Levels I’m Watching
Invalidation Level: A sustained move below 945 will negate my bullish view.
My Levels (if momentum continues): 1048 → 1062 → 1120
This is my swing trading approach as long as supports hold and is not a buy/sell recommendation.
________________________________________________________________________________
________________________________________________________________________________
BDL – 1566.50 (▲ +5.73%)
📊 Technical Indicators Explained
Bharat Dynamics (BDL) has delivered a strong breakout candle 🔥 after a prolonged downtrend, backed by extremely high volume 🚀. BDL stood out with an impressive 3.7x surge in volumes over its 20-day average, showcasing aggressive market involvement. Such strong accumulation signals heightened attention from traders and investors, often aligned with significant moves.
The chart highlights multiple bullish signals — RSI breakout, Bullish Engulfing candle, Buy Today Sell Tomorrow (BTST) setup, VWAP support, and SuperTrend reversal confirmation. The BB squeeze-off 📊 indicates a fresh trending move is likely to unfold.
As long as supports at 1506 / 1446 / 1410 are protected, and with a demand zone between 1513 – 1470, the stock looks well positioned to sustain momentum. On the upside, resistances are placed at 1602 / 1637 / 1697, with Fibonacci-based higher levels stretching to 1734 → 1886 → 2041 and beyond.
________________________________________
📰 Recent Updates
Institutional interest in BDL is rising, with the HDFC Defence Fund increasing its stake in the company along with other defence stocks (Economic Times).
BDL has also been highlighted among defence counters that recently surged up to 19%, supported by a strong order book and export prospects (Mint).
________________________________________
📈 Investment Outlook & Conclusion
📈 Bullish Case – Strong breakout with heavy volumes may extend towards higher resistances.
📉 Bearish Case – Slip below 1479 can open downside risk.
⚡ Momentum Case – High-risk, high-reward setup for aggressive short-term swings.
📅 Perspective – Short-term breakout play; long-term outlook tied to defence orders and exports.
________________________________________
📊 STWP Trade Analysis – BDL
Bharat Dynamics has delivered a breakout with volume confirmation and multiple bullish signals 🚀
👉 For me, my entry zone is around 1577, aligned with the breakout structure with my stop being at 1422.60
👉 If the stock dips towards the 1513 – 1470 demand zone, I will treat it as a conservative re-entry with tighter risk.
🔑 Key Levels I’m Watching
Invalidation Level: Invalidation level of below 1422 will negate my bullish view.
My Levels (if momentum continues): 1602 → 1637 → 1697 → 1734 → 1886 → 2041
This is my swing trading approach as long as supports hold and is not a buy/sell recommendation.
________________________________________________________________________________
________________________________________________________________________________
BAJAJFINSV – 2081.50 (▲ +2.14%)
📊 Technical Indicators Explained
Bajaj Finserv (BAJAJFINSV) has given a breakout candle with volume confirmation 🔥 after a long consolidation phase.
The stock displays strong signals — possible breakout setup, bullish engulfing candle, RSI breakout ⚡, swing trade confirmation, and Bollinger Band breakout 📊. The stock is also supported by VWAP demand and a BB squeeze-off, indicating potential for fresh momentum expansion. BAJAJFINSV recorded volumes about 1.8 times its recent 20-day average, suggesting above-normal market activity. This indicates healthy interest and participation, though the intensity is moderate compared to high-volume breakouts.
With strong supports at 2047 / 2013 / 1992, the stock looks well-positioned to sustain its move. On the upside, resistances are placed at 2102 / 2122 / 2156, with higher Fibonacci levels seen at 2135 → 2217 → 2236 if momentum holds.
________________________________________
📰 Recent Updates
Bajaj Finserv has set a target to achieve carbon neutrality for Scope 1 & 2 emissions by 2032, following a decarbonisation study in FY25 (Times of India).
In Q1 FY26, the company reported a 30.4% YoY rise in consolidated net profit to ₹2,789 crore, with revenues growing by ~12–13% (Economic Times).
________________________________________
📈 Investment Outlook & Conclusion
📈 Bullish Case – Gradual momentum with volume support could lift towards resistances.
📉 Bearish Case – A fall below 2032 can trigger near-term weakness.
⚡ Momentum Case – Suitable for cautious swing setups.
📅 Perspective – Short-term bias positive; long-term backed by financial services expansion.
________________________________________
📊 STWP Trade Analysis – BAJAJFINSV
Bajaj Finserv has delivered a breakout candle with momentum and above-average volume 🚀
👉 For me, my entry zone is around 2089, aligned with the breakout structure and a stop loss level of 2024.95.
👉 If the stock dips towards the level of 2041, I will treat it as a conservative re-entry with tighter risk.
🔑 Key Levels I’m Watching
Invalidation Level: A sustained move below 2012 will negate my bullish view.
My Levels (if momentum continues): 2102 → 2122 → 2156 → 2135 → 2217 → 2236
This is my swing trading approach as long as supports hold and is not a buy/sell recommendation.
________________________________________________________________________________
________________________________________________________________________________
HAL – 4745.60 (▼ –3.59%)
📊 Technical Indicators Explained
Hindustan Aeronautics (HAL) has given a breakout candle with strong volume confirmation 🚀 after a corrective downtrend. HAL witnessed trading volumes nearly 2.6x higher than its 20-day average, reflecting strong participation in the stock. Such elevated volumes often highlight rising institutional or retail activity, adding credibility to the ongoing price momentum.
The stock shows powerful bullish signals — Bullish Marubozu candle, RSI breakout ⚡, Bullish Engulfing setup, VWAP support, backed by a SuperTrend reversal and Bollinger Band breakout 📊. The BB squeeze-off suggests a potential trending move is just beginning.
With supports at 4634 / 4523 / 4465, the stock looks cushioned for momentum continuation. On the upside, immediate resistances lie at 4803 / 4861 / 4972, with higher Fibonacci-based levels stretching towards 5074 → 5399 → 5723 if momentum sustains. There is a possible demand zone around 4634 – 4544.30
________________________________________
📰 Recent Updates
HAL has received its third GE-404 engine from the US for the LCA Tejas Mark-1A programme, with a fourth expected later this month (Economic Times).
The company also signed a technology transfer agreement with IN-SPACe, ISRO, and NSIL for the Small Satellite Launch Vehicle (Economic Times).
HAL’s HJT-36 trainer jet is being evaluated for conversion into a light-attack fighter aircraft, with basic weapon trials already completed (Navbharat Times).
________________________________________
📈 Investment Outlook & Conclusion
📈 Bullish Case – Strong momentum with volume support may push towards higher resistances.
📉 Bearish Case – A drop below 4576 can attract downside pressure.
⚡ Momentum Case – Aligned with momentum; good for short-term swings.
📅 Perspective – Short-term breakout play; long-term supported by defence growth.
________________________________________
📊 STWP Trade Analysis – HAL
Hindustan Aeronautics has delivered a breakout candle with strong volume and momentum 🚀
👉 For me, my entry zone is around 4750, aligned with the breakout setup and my stop loss level at 4425.35.
👉 If the stock dips towards the 4634 – 4544.30, I will consider it as a conservative re-entry with tighter risk.
🔑 Key Levels I’m Watching
Invalidation Level: A sustained move below 4425 will negate my bullish view.
My Levels (if momentum continues): 4803 → 4861 → 4972 → 5074 → 5399 → 5723
This is my swing trading approach as long as supports hold and is not a buy/sell recommendation.
________________________________________________________________________________
________________________________________________________________________________
⚠️ Disclaimer – Please Read Carefully
The information shared here is meant purely for learning and awareness. It is not a buy or sell recommendation and should not be taken as investment advice. I am not a SEBI-registered investment advisor, and all views expressed are based on personal study, chart patterns, and publicly available market data.
Trading — whether in stocks or options — carries risk. Markets can move unexpectedly, and losses can sometimes exceed the money you have invested. Past performance or past setups do not guarantee future results.
If you are a beginner, treat this as a guide to understand how the market works — practice on paper trades before risking real money. If you are experienced, always assess your own risk, position sizing, and strategy suitability before entering trades.
Consult a SEBI-registered financial advisor before making any real trading decision. By engaging with this content, you acknowledge full responsibility for your trades and investments.
💬 Found this useful?
🔼 Give this post a Boost to help more traders discover clean, structured learning.
✍️ Drop your thoughts, questions, or setups in the comments — let’s grow together!
🔁 Share with fellow traders and beginners to spread awareness.
👉 “If you liked this breakdown, follow for more clean, structured setups with discipline at the core.”
🚀 Stay Calm. Stay Clean. Trade With Patience.
Trade Smart | Learn Zones | Be Self-Reliant 📊
Defence Sector Showing Signs of RevivalNifty Defence vs CNX500 bouncing from support with bullish RSI divergence. Bharat Dynamics (BDL) stabilizing near 1500 zone with RSI uptick and MACD flattening. Sector & stock both hinting at reversal, but need volume confirmation above 1520–1550.
BDL: RSI BOBDL is in base formation and RSI gave a fresh Breakout today. Keep it in watchlist or enter with a small SL 1400 with some buffer.
Targets that we can see in 2-3 months: 1700-1800-1900-2000
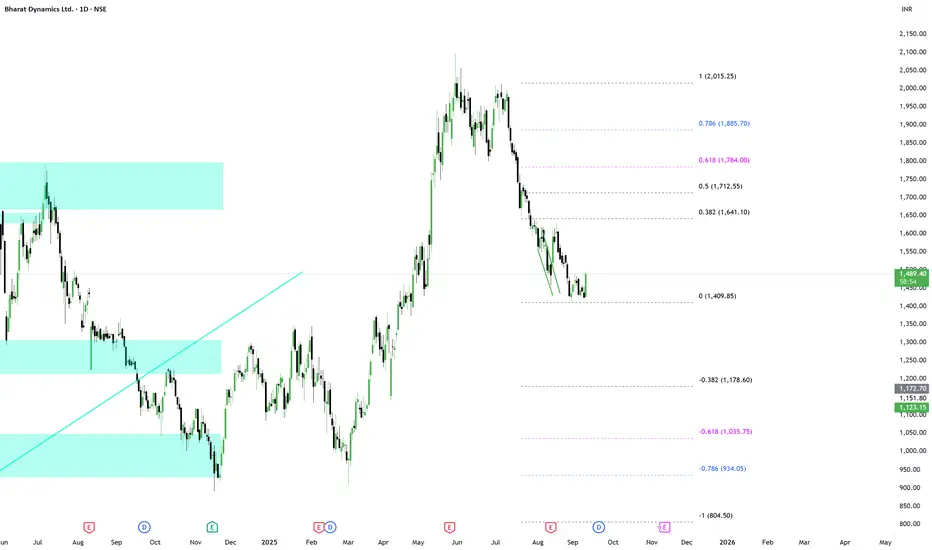
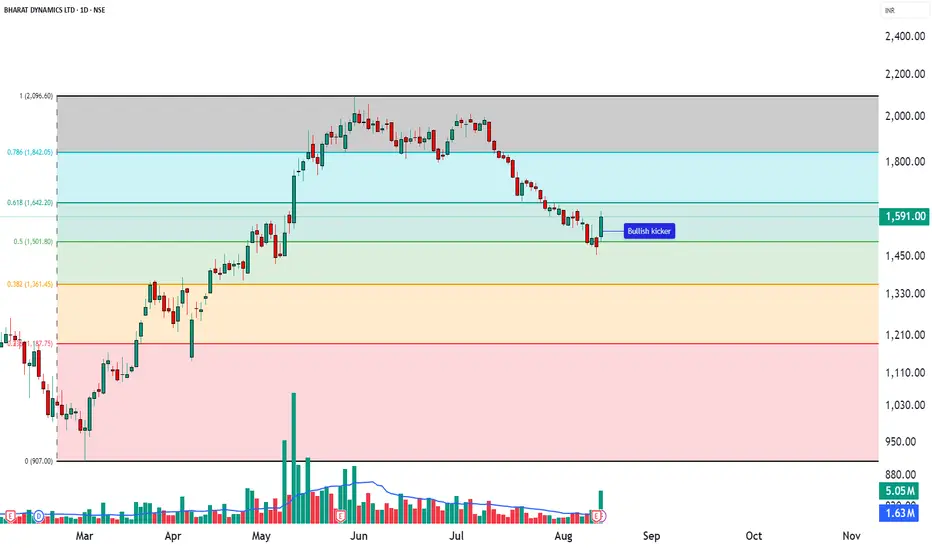
BDL - “Bullish Kicker Candlestick – Educational Analysis” ________________________________________
📊BDL – Technical & Fundamental Educational Snapshot
Ticker: NSE: BDL | Sector: 🏭 Defence & Aerospace
CMP: ₹1,591 ▲ (as of 13 Aug 2025)
Rating: ⭐⭐⭐⭐ (Moderately Bullish Setup – Educational Purposes Only)
Pattern Observed: 📈 Bullish Kicker Candlestick Pattern
________________________________________
Bullish Kicker Candlestick – Educational Analysis (BDL, NSE)
The Bullish Kicker is a strong reversal candlestick pattern, signaling a sudden shift from bearish to bullish sentiment. Studying this pattern helps traders understand price action and momentum dynamics.
________________________________________
Key Features:
Gap up from previous candle → sudden change in market sentiment.
No overlap between candle bodies → shows aggressive bullish control.
Bears initially in control, but strong buying pushed the price higher.
________________________________________
💡 Volume Confirmation
Kicker candle volume: 5.05M, compared to 20-day average of 1.63M.
Higher-than-average volume indicates strong participation and validates momentum from an educational perspective.
________________________________________
Support & Resistance Zones
📈Support Zones: 1525, 1460, 1417
📉 Resistance Zones: 1633, 1676, 1741
Patterns near strong support or after a downtrend are typically more reliable for educational analysis.
________________________________________
🔍 Indicator Insights
RSI: 42 – recovering from oversold levels.
VWAP: Bullish – indicates intraday support and momentum.
These indicators provide additional context for studying the pattern, not for direct trading decisions.
________________________________________
⚖️ Trade Planning Concepts (Educational Only)
Entry Concept: Observe the close of the kicker candle, or wait for the next candle to break above its high.
Stop Loss Concept: Slightly below the low of the kicker candle (~1502).
Reference Levels: Nearby resistance zones (1633, 1676, 1741) or risk-reward frameworks.
________________________________________
💡 Risk Management Concepts
Limit risk per study trade (e.g., 1–2% of capital).
Patterns may fail if subsequent price action invalidates the momentum.
________________________________________
Note: Bullish Kickers often follow impactful news or earnings. Observing volume and confirmation indicators is essential to understand price action dynamics.
________________________________________
⚠️ Disclaimer – Please Read Carefully
The information shared here is meant purely for learning and awareness. It is not a buy or sell recommendation and should not be taken as investment advice. I am not a SEBI-registered investment advisor, and all views expressed are based on personal study, chart patterns, and publicly available market data.
Trading — whether in stocks or options — carries risk. Markets can move unexpectedly, and losses can sometimes be larger than the money you have invested. Past performance or past setups do not guarantee future results.
If you are a beginner, treat this as a guide to understand how the market works — practice on paper trades before risking real money. If you are an experienced trader, remember to assess your own risk, position sizing, and strategy suitability before entering any trade.
Data, prices, and analysis are based on information available as of 12 August 2025, and market conditions can change at any time. Always verify with reliable sources and consult a SEBI-registered financial advisor before making any real trading decision.
By reading, watching, or engaging with this content, you acknowledge that you take full responsibility for your own trades and investments.
________________________________________
💬 Found this useful?
Drop your thoughts, questions, or setups in the comments — let’s grow together!
🔁 Share this post with fellow traders and beginners to spread clean, structure-based learning.
✅ Follow simpletradewithpatience for beginner-friendly setups, price action insights, and disciplined trading content.
🚀 Stay Calm. Stay Clean. Trade With Patience.
Trade Smart | Learn Zones | Be Self-Reliant 📊
________________________________________
BDL Soon Approaching 1500 levels Beautiful Chart of BDL...if it breaks yesterday's low of 1550...expect 1500 in 1-2 days!
SELL ON BDL?Recent Trend: Downtrend with lower highs and lower lows
🔹 EMA (Exponential Moving Average): The stock is currently trading below the EMA, which is bearish (EMA ~₹1,691)
🔍 Chart Observations:
❌ Bearish Signs:
Trend Breakdown: The stock broke key support near ₹1,800–1,850 and has sharply fallen to ₹1,620.
Sustained Selling Pressure: The last 4–6 candles show consistent red candles with no strong bounce.
Volume Spike on Red Days: Indicates institutional selling or long unwinding.
EMA Crossover: The price falling below the 20-day/50-day EMA is often a strong signal of short-term trend reversal.

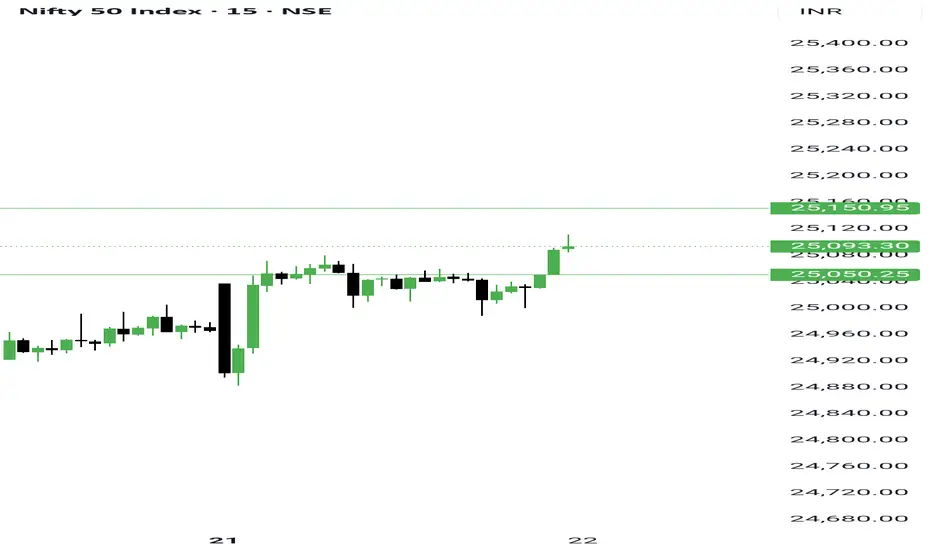
Chart always tells the truth - Nifty and Banknifty The chart always tells the truth.
We studied that NSE:NIFTY would bounce, and it did — what a bounce!
But keep in mind, fear is still present in the market. Traders can sell even on the smallest negative trigger. Today’s move was largely because of short covering.
Today’s Nifty candle is bullish, but buyers’ volume is only 40 million higher than sellers, while on Friday sellers had 43 million more than buyers.
This clearly shows that sellers are still active.
So, a bullish candle + low volume + short covering = likely sideways action tomorrow.
Nifty levels:
- Support: 25050
- Resistance: 25175 — above this, we could see short covering up to 25350
The market remains bullish, and this is the right time to build a list of stocks where character or structure change has happened.
If you can spot such small-cap stocks, you can easily aim for 40-50% upside in next 3-4 months.
Talking about NSE:BANKNIFTY — even after such a big green candle, sellers outnumbered buyers by 7 million in volume. So be cautious while trading here.
BankNifty levels:
- Support: 56770
- Resistance: 57200
Sector-wise, the craze is still around IPOs. Focus on recently listed NSE:NIFTY_IPO stocks (1-2 years old) where character changed in the last rally.
Here’s how my recent picks performed today:
NSE:MASTEK - +7%
NSE:PARADEEP - +7.63%
NSE:JYOTICNC - +5%
NSE:BDL - +2.80%
NSE:LTF - +3.66%
NSE:UPL - +3.92%
NSE:CARRARO - +5.6%
NSE:KPEL - +4.7%
NSE:MMTC - +3.79%
That’s all for today.
Take care.
Have a profitable tomorrow.
BDL | Long | Swing Setup | Wave AnalysisBDL is either in Wave C of abc
or Wave 3 of 1-5 as shown in chart
both cases suggest a bullish up-move towards target one in case of wave C and towards target 2 in case of wave 3.
SL would be 1090- 1130 zone. If looks weak in this zone we will exit.
Increasing volume suggests a good momentum long setup.
Just my 0.02$

Bharat Dynamics Ltd (BDL)🚀 BDL - Technical Breakout in Play!
Weekly breakout above key resistance zone 🔥
Pattern: Double Bottom ➕ Break of Monthly Mother Candle High
Potential Upside:
🎯 Target 1: ₹1968.50
🎯 Target 2: ₹2590.00

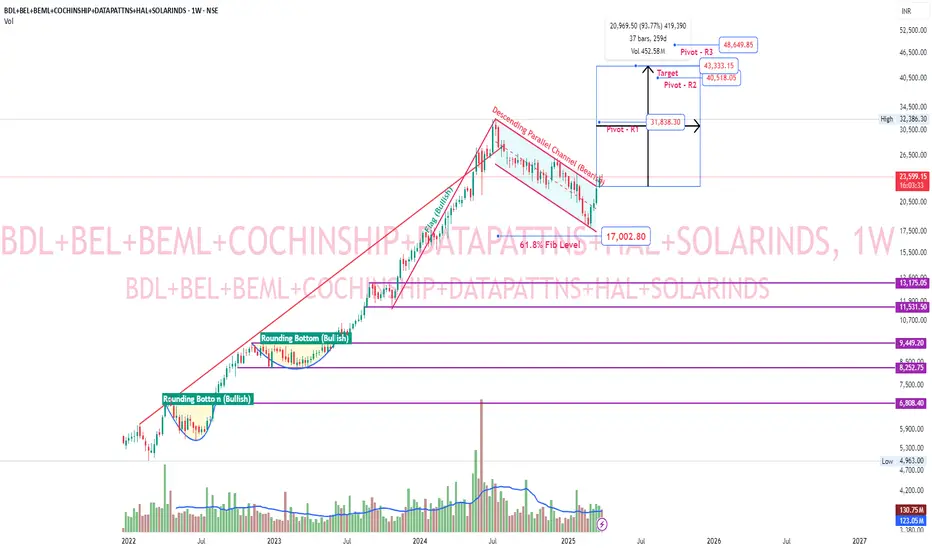
Aerospace & Defence bullish flag breakoutCreated custom index with following scrips. BDL, BEL, BEML, COCHINSHIP, DATAPATTNS, HAL, SOLARINDS. These are some major aerospace-defence companies. This custom index gave a bullish flag breakout. Huge upside potential based on flag pole as target. Pivot R1 itself has approximately 34.5% upside potential.
BDL - Bullish Momentum in Play - 40% Upside Potential!➡️ Price Analysis & Overview:
1️⃣ Demand Zone Bounce: BDL is rebounding from a strong demand zone, showcasing potential for upward momentum.
2️⃣ EMA Support: The stock consistently respects the exponential moving average, reinforcing its bullish structure.
3️⃣ Candle Strength: Recent candles indicate strong bullish momentum, paving the way for further gains.
4️⃣ Current volumes are looking good but expecting more volumes!
✨My View:
Expect the bullish momentum to persist. Watch for sustained breakouts or pullbacks to EMA for strategic entries.🚀
Monthly TF:
⚠️ Disclaimer: For learning purposes only. Always do your research before trading.
Drop a comment if you liked this analysis!✌️
Thanks & Regards,
Anubrata Ray ⚡

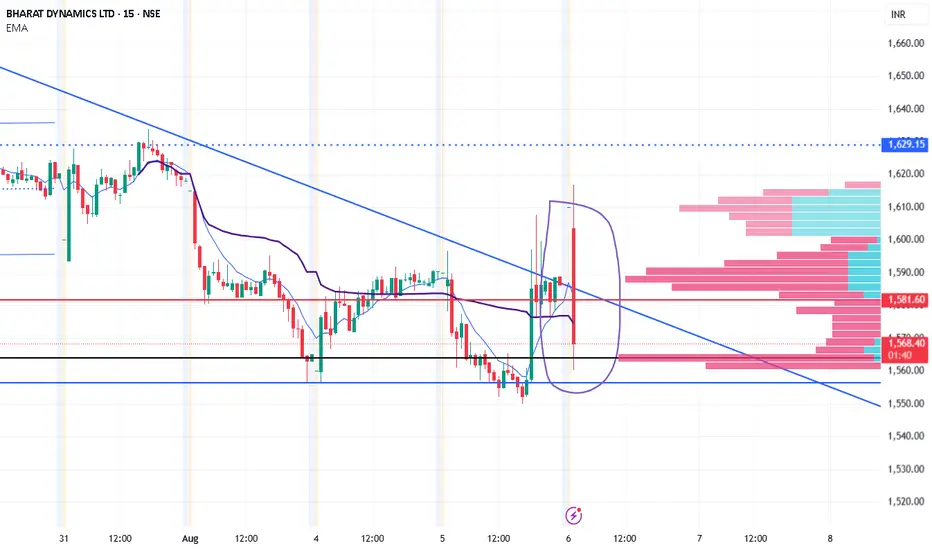
Supply-Demand Flip Play with Volume Spike📈 BHARAT DYNAMICS LTD | Supply-Demand Flip Play with Volume Spike
📅 Date: May 09, 2025
📈 Timeframe: 15-Minute
🔍 Stock: BDL (NSE)
📊 **Price Action Update (Today):**
BDL opened strong at 1455 and rallied till 1595 before slipping down from a previously tested **Supply Zone (1547.40 – 1576.00)** The intraday move witnessed a sharp bullish rally from sub-1,455 levels, only to reverse sharply from the overhead supply. This creates a textbook example of **supply rejection after a demand-driven impulse**. The candle near close reflects a high-wick bearish rejection.
🧠 **Technical Overview:**
Today’s session was a high-volatility play showcasing both demand and supply dynamics. A **Possible Demand Zone (1447.30 – 1460.90)** emerged from a sharp buying reaction, indicating strong institutional interest. The price shot up almost ₹100 points in a short span with surging volumes, testing the overhead **Retested Supply Zone**, which held firm — confirming sellers’ presence. This makes the area between **1547 and 1576** a critical resistance for future rallies. Until broken decisively, traders should remain cautious about fresh longs at higher levels.
🧩 **Chart Pattern Insight:**
BDL’s 15-min chart displays a classic **Demand-to-Supply Flip** — a rally from demand, quick run-up, and sharp rejection at a pre-marked supply. This is often referred to as a “trap move” where late buyers are caught at highs. The clean volume spike at the breakout and immediate rejection within the supply zone is a common pattern seen in smart money distribution phases. Traders can look for potential **shorting setups** if the price re-enters the supply with weak momentum or **buying opportunities near the demand zone**, only with volume confirmation.
🧱 **Support & Resistance Analysis:**
* 🔼 **Resistance (Supply Zone):** 1547.40 – 1576.00
* 🔽 **Support (Demand Zone):** 1447.30 – 1460.90
A breakout above 1576 with strong volume can invalidate the supply zone. Until then, this remains a selling area. On the downside, if the price revisits the demand zone, it may offer a low-risk buying opportunity — but only if it holds with bullish candles and rising volume.
🔍 **Volume Analysis:**
The volume surged dramatically on the rally towards the supply zone, showing panic buying or aggressive short covering. The final rejection candle also saw elevated volume, which adds weight to the **supply zone rejection thesis**. Prior candles had lower volume, indicating absorption near lows and sudden spike into resistance. This is a signature behavior of “liquidity grabs.”
📌 **Educational Insight:**
This chart provides a clean **example of how price reacts to supply and demand zones**, especially intraday. Demand zones are best used for potential long setups only after a bullish confirmation, while supply zones can be used for shorts or to exit longs. These zones act as emotional points — where institutions look to trap retail traders. For intraday traders, this scenario shows why waiting for confirmation is key before entering trades around such zones.
⚠️ **Disclaimer:**
This analysis is for educational purposes only and does not constitute any investment advice or stock recommendation. Please consult with your financial advisor before taking any trading decisions. This post complies with SEBI regulations and is intended to promote financial literacy.

BDL - Stock Analysis📢 Disclaimer:
This analysis is for educational and informational purposes only and should not be considered as financial advice. Market movements are subject to various factors, and past performance does not guarantee future results. Please conduct your own research and consult with a registered financial advisor before making any investment decisions. 📊⚖️
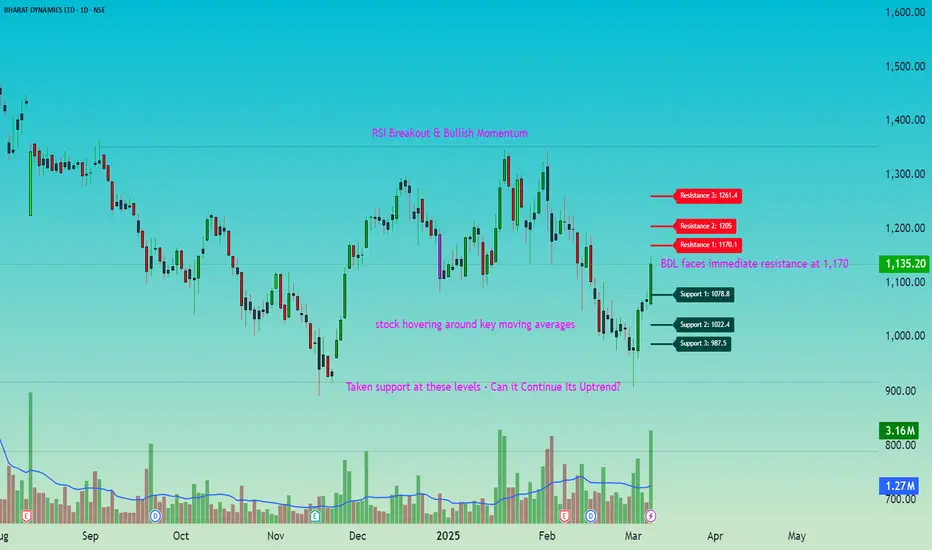
📊 BDL Market Overview
BDL opened at 1,061.9 and witnessed strong momentum, reaching a high of 1,148.6 before closing at 1,135.2 📈. The stock showed resilience, bouncing back from the day’s low of 1,057.3 and closing significantly higher than its previous close of 1,065.65 ✅. This upward movement indicates positive sentiment, with buyers showing strength throughout the session.
📌 Key Levels to Watch
BDL faces immediate resistance at 1,170 🚧, with further hurdles at 1,205 and 1,261 🔼. On the downside, support is seen at 1,079 ✅, followed by 1,022 and 988 ⚠️. A breakout above resistance could indicate continued strength, while a drop below key support levels may signal weakness. 📉
📊 Moving Averages Analysis
BDL is currently near its 50 EMA (1,124.49) 📉, with the 100 EMA at 1,151.01 and the 200 EMA at 1,138.21. The stock hovering around these levels suggests a crucial zone where further movement could decide the trend. A breakout above the 100 EMA may indicate strength 🚀, while dipping below the 50 EMA could bring caution ⚠️.
📊 RSI Breakout & Bullish Momentum
BDL has witnessed an RSI breakout 📈, signaling increasing buying strength. The presence of a strong bullish candle 🔥 further confirms momentum, indicating that buyers are in control. If this momentum sustains, the stock could test higher resistance levels 🚀. However, traders should watch for follow-through buying to confirm the trend ✅.
📊 Market Sentiment Overview
BDL is trading near key moving averages, indicating a crucial decision zone ⚖️. The stock has shown strong bullish momentum, closing well above its previous day’s level ✅. However, resistance at 1,170 🚧 may create short-term hurdles, while support at 1,079 is key for stability. The sentiment remains cautiously bullish, with a need for confirmation at higher levels.
🎯 Market Observation
If BDL breaks above 1,170, it could gain further strength toward 1,205 – 1,261 🚀. On the downside, a slip below 1,079 may lead to a test of 1,022 – 988 ⚠️. Moving averages suggest a critical juncture, where sustained buying could fuel an uptrend, while rejection near resistance may cause consolidation.
📢 Conclusion
BDL has strong momentum, but key levels must be watched for confirmation. A break above resistance could drive further upside 📈, while holding above support will be crucial for maintaining strength ✅. Market participants should stay alert to price action near moving averages and plan accordingly. 🚀
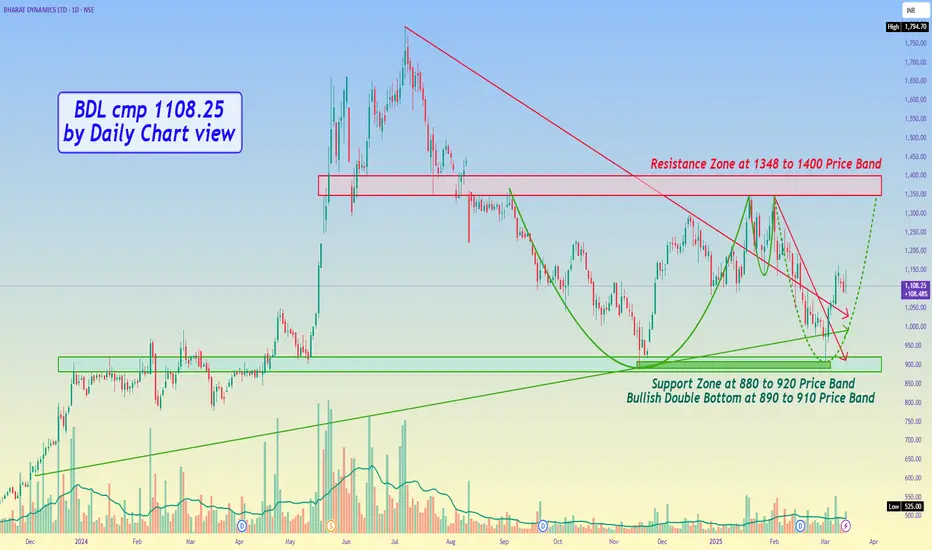
BDL cmp 1108.25 by Daily Chart viewBDL cmp 1108.25 by Daily Chart view
- Support Zone at 880 to 920 Price Band
- Resistance Zone at 1348 to 1400 Price Band
- Bullish Double Bottom at 890 to 910 Price Band
- Volumes are syncing in closely with the avg traded quantity
- Daily Support at 1001 > 890 > 785 with the the Resistance at 1205 > 1301 > 1400
- Bullish Cup and Handle followed by the Bullish Rounding Bottom in the making process
Bharat Dynamics Ltd. - Breakout OpportunityDate : 11-Dec-2024
LTP : Rs. 1,212.05
Targets: (T1) Rs. 1,350 --> (T2) Rs. 1,496 --> (T3) Rs. 1,662 --> (T4) Rs. 1,794
SL : Rs. 1,049
Technical View:
• NSE:BDL was going through it's primary downtrend since Jul-2024.
• After touching a lifetime high of 1,794.70 on 5-Jul-2024, it has retraced 50% to 890 level.
• NSE:BDL has recently breakout from it's primary downtrend with higher than average volume.
• NSE:BDL is trading above 20 DEMA and 50 DEMA since last few sessions. 20 DEMA has crossed over 50 DEMA.
• RSI is in buy zone and trading at 64.58. MACD has crossed 0 line and trading at 40.98
• Both RSI and MACD are showing positive divergence, indicating trend reversal.
• Looking strong to start an upward journey from here.
Liked the analysis? Boost/Like this idea and follow my ID.
Disclaimer: I am not a SEBI registered analyst/consultant and not recommending anyone to take any BUY or SELL position in stock market. Investing in stock market is risky and one should do a self analysis and validation before investing in stock market. My ideas are published for learning purpose only and are available to everyone at no cost/charge.

BDL Bharat DynamicsBDL is at demand zone and expected to rise. As per fibo Levels we can aim for 2150-2200 from the CMP. If the price gets a little down from the CMP then we can add a little more if prefer to add in bits.
NOTE: I'm not a SEBI REG. Study before investing.

Bharat Dynamics Ltd - Breakout OpportunityDate : 7-Jun-2024
Rating : Buy - Positional Trade
LTP : Rs. 1,430.95
Targets: (1) Rs. 1,662 --> (2) Rs. 1,891 --> (3) Rs. 2,261
SL : Rs. 1,293 on daily close basis
Technical View:
• NSE:BDL is in its primary uptrend and was recently going through it's secondary downtrend.
• After touching the high of 1,662.95 on 3-Jun-2024, it has retraced 22% to 1,293.20 level and taken support at 20 DMA.
• On 7-Jun-2024, NSE:BDL has broke out from its secondary down trend with high volume.
• Prices are trading above 20 DMA, 50 DMA and 21 DEMA.
• RSI is trading at 59.84 and MACD is trading at 114.27.
• Looking good to start a new swing from here.
• All the above observations are noted in Daily Timeframe.
Disclaimer : I am not a SEBI registered analyst/consultant and not recommending anyone to take any BUY or SELL position in stock market. Investing in stock market is risky and one should do a self analysis and validation before investing in stock market. Ideas are published for learning purpose only.

BDL On the verge of BreakoutNSE:BDL
Good to keep on the radar
As its on the verge of new breakout of Flag n pole
Always respect SL & position sizing
========================
Trade Secrets By Pratik
========================
Disclaimer
NOT SEBI REGISTERED
This is our personal view and this analysis
is only for educational purposes
Please consult your advisor before
investing or trading
You are solely responsible for any decisions
you take on basis of our research.

Bharat Dynamics Ltd - Breakout OpportunityDate : 16-May-2024
Rating : Buy - Positional Trade
LTP : Rs. 2,069.60
Targets: (1) Rs. 2,098 --> (2) Rs. 2,278 --> (3) Rs. 2,571
SL : Rs. 1,938 on daily close basis
Technical View:
• NSE:BDL is in its primary uptrend and was recently going through it's secondary downtrend.
• After touching the high of 2,097.95 on 25-Apr-2024, it has retraced 14% to 1,805.55 level.
• On 16-May-2024, NSE:BDL has broke out from its secondary down trend with higher than average volume.
• NSE:BDL is already trading above 20 DMA, 50 DMA and 21 DEMA.
• Both RSI and MACD have formed bullish crossover and are trading at 66.32 and 41.62 respectively.
• Looking strong to start a new swing from here.
Key Events:
• 2/1 stock split. Record Date: 24-May-2024
• Quarterly Result and Dividend announcement: 29-May-2024
Disclaimer : I am not a SEBI registered analyst/consultant and not recommending anyone to take any BUY or SELL position in stock market. Investing in stock market is risky and one should do a self analysis and validation before investing in stock market. Ideas are published for learning purpose only.

BHARAT DYNAMICS LTd for 2100+Bharat Dynamics Limited (BDL) is one of India's manufacturers of ammunitions and missile systems. We do see confirmation on charts of BDL.
I am expecting a good rally in Bharat Dynamics Limited (BDL) from this point ahead of earnings.
CMP : 1985
SL : 1900
TRAGET : 2100

Bharat Dynamics Ltd - Breakout OpportunityDate : 27-Mar-2024
Rating : Buy - Positional Trade
LTP : Rs. 1,755
Targets: (1) Rs. 1,810 --> (2) Rs. 1,984 --> (3) 2,252
SL : Rs. 1,625
Technical View:
• NSE:BDL is in its primary uptrend since long time and was recently going through it's secondary downtrend.
• After touching the life time high of 1,984.80 on 27-Feb-2024, it has retraced 22% to 1,552.10 level.
• NSE:BDL has broke out from its secondary down trend on 26-Mar-2024 with higher volume.
• RSI has crossed 50 on 26-Mar-2024.
• On 27-Mar-2024 it has closed above both 20 DMA and 50 DMA.
• Looking strong to start a new swing from here.
Disclaimer: I am not a SEBI registered analyst/consultant and not recommending anyone to take any BUY or SELL position in stock market. Investing in stock market is risky and one should do a self analysis and validation before investing in stock market.

Bharat Dynamics Limited (BDL): A High-Flying Opportunity! Today, we're going to take a deep dive into the technical analysis of Bharat Dynamics Limited ( NSE:BDL ), a government-owned company in India.
📈 Breaking the Rectangle Pattern 📈
On April 24, 2024, BDL broke out of a Rectangle pattern that was formed after making an all-time high. This rectangle can be interpreted as a Re-accumulation in stage 2.
🎯 New All-Time High and Retest 🎯
In last week, the stock broke its all-time high and formed a new all-time high. The breakout was accompanied by very high volumes. In the last 3 days, the stock has been coming down to retest the Breakout with low volume. This shows that the downward movement is without selling interest, which is a good sign.
💡 Trading Strategy 💡
We can plan an entry at 1955 to trade the breakout retest entry or you can say entry at the demand zone of the lower timeframe which is available on the 15-minute chart.
Keep a stop loss below 1897 which is around 3% down from the entry point.
The first target should be a 6% gain.
For riding the rally, trail your stop loss.
Thank you for your support, your likes, and comments. Feel free to ask if you have any questions. Remember, the journey of a thousand miles begins with a single step. So, let's step into the world of trading with confidence and determination! 🚀
Please note that this analysis is for educational purposes only. I am not a SEBI registered analyst. This is not intended as a trading or investment recommendation. Happy trading! 🎉
