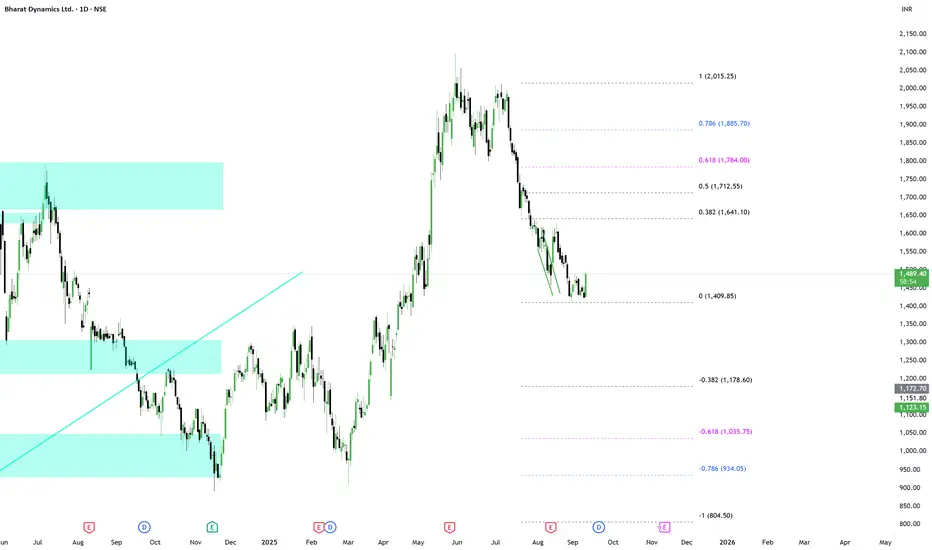
BDL: RSI BOBDL is in base formation and RSI gave a fresh Breakout today. Keep it in watchlist or enter with a small SL 1400 with some buffer.
Targets that we can see in 2-3 months: 1700-1800-1900-2000
Bdlanalysis
BDL - “Bullish Kicker Candlestick – Educational Analysis” ________________________________________
📊BDL – Technical & Fundamental Educational Snapshot
Ticker: NSE: BDL | Sector: 🏭 Defence & Aerospace
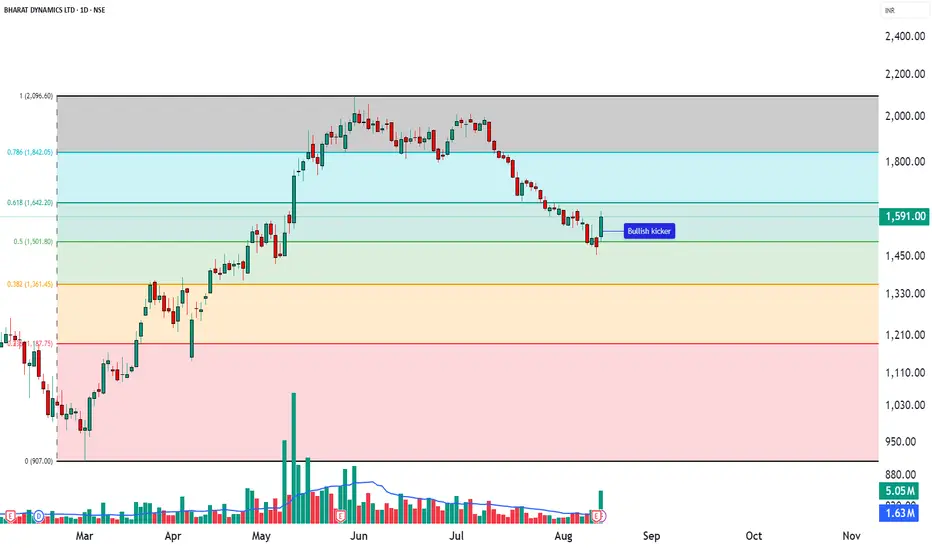
CMP: ₹1,591 ▲ (as of 13 Aug 2025)
Rating: ⭐⭐⭐⭐ (Moderately Bullish Setup – Educational Purposes Only)
Pattern Observed: 📈 Bullish Kicker Candlestick Pattern
________________________________________
Bullish Kicker Candlestick – Educational Analysis (BDL, NSE)
The Bullish Kicker is a strong reversal candlestick pattern, signaling a sudden shift from bearish to bullish sentiment. Studying this pattern helps traders understand price action and momentum dynamics.
________________________________________
Key Features:
Gap up from previous candle → sudden change in market sentiment.
No overlap between candle bodies → shows aggressive bullish control.
Bears initially in control, but strong buying pushed the price higher.
________________________________________
💡 Volume Confirmation
Kicker candle volume: 5.05M, compared to 20-day average of 1.63M.
Higher-than-average volume indicates strong participation and validates momentum from an educational perspective.
________________________________________
Support & Resistance Zones
📈Support Zones: 1525, 1460, 1417
📉 Resistance Zones: 1633, 1676, 1741
Patterns near strong support or after a downtrend are typically more reliable for educational analysis.
________________________________________
🔍 Indicator Insights
RSI: 42 – recovering from oversold levels.
VWAP: Bullish – indicates intraday support and momentum.
These indicators provide additional context for studying the pattern, not for direct trading decisions.
________________________________________
⚖️ Trade Planning Concepts (Educational Only)
Entry Concept: Observe the close of the kicker candle, or wait for the next candle to break above its high.
Stop Loss Concept: Slightly below the low of the kicker candle (~1502).
Reference Levels: Nearby resistance zones (1633, 1676, 1741) or risk-reward frameworks.
________________________________________
💡 Risk Management Concepts
Limit risk per study trade (e.g., 1–2% of capital).
Patterns may fail if subsequent price action invalidates the momentum.
________________________________________
Note: Bullish Kickers often follow impactful news or earnings. Observing volume and confirmation indicators is essential to understand price action dynamics.
________________________________________
⚠️ Disclaimer – Please Read Carefully
The information shared here is meant purely for learning and awareness. It is not a buy or sell recommendation and should not be taken as investment advice. I am not a SEBI-registered investment advisor, and all views expressed are based on personal study, chart patterns, and publicly available market data.
Trading — whether in stocks or options — carries risk. Markets can move unexpectedly, and losses can sometimes be larger than the money you have invested. Past performance or past setups do not guarantee future results.
If you are a beginner, treat this as a guide to understand how the market works — practice on paper trades before risking real money. If you are an experienced trader, remember to assess your own risk, position sizing, and strategy suitability before entering any trade.
Data, prices, and analysis are based on information available as of 12 August 2025, and market conditions can change at any time. Always verify with reliable sources and consult a SEBI-registered financial advisor before making any real trading decision.
By reading, watching, or engaging with this content, you acknowledge that you take full responsibility for your own trades and investments.
________________________________________
💬 Found this useful?
Drop your thoughts, questions, or setups in the comments — let’s grow together!
🔁 Share this post with fellow traders and beginners to spread clean, structure-based learning.
✅ Follow simpletradewithpatience for beginner-friendly setups, price action insights, and disciplined trading content.
🚀 Stay Calm. Stay Clean. Trade With Patience.
Trade Smart | Learn Zones | Be Self-Reliant 📊
________________________________________
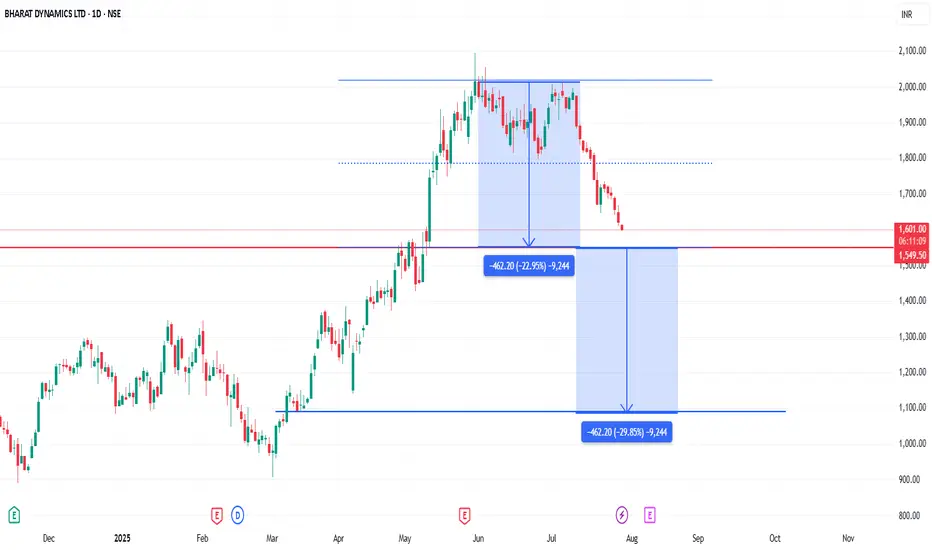
BDL on SEll SignalBDL doesnt look very good on charts. Double top and "M" pattern can also be clearly seen here!
Supply-Demand Flip Play with Volume Spike📈 BHARAT DYNAMICS LTD | Supply-Demand Flip Play with Volume Spike
📅 Date: May 09, 2025
📈 Timeframe: 15-Minute
🔍 Stock: BDL (NSE)
📊 **Price Action Update (Today):**
BDL opened strong at 1455 and rallied till 1595 before slipping down from a previously tested **Supply Zone (1547.40 – 1576.00)** The intraday move witnessed a sharp bullish rally from sub-1,455 levels, only to reverse sharply from the overhead supply. This creates a textbook example of **supply rejection after a demand-driven impulse**. The candle near close reflects a high-wick bearish rejection.
🧠 **Technical Overview:**
Today’s session was a high-volatility play showcasing both demand and supply dynamics. A **Possible Demand Zone (1447.30 – 1460.90)** emerged from a sharp buying reaction, indicating strong institutional interest. The price shot up almost ₹100 points in a short span with surging volumes, testing the overhead **Retested Supply Zone**, which held firm — confirming sellers’ presence. This makes the area between **1547 and 1576** a critical resistance for future rallies. Until broken decisively, traders should remain cautious about fresh longs at higher levels.
🧩 **Chart Pattern Insight:**
BDL’s 15-min chart displays a classic **Demand-to-Supply Flip** — a rally from demand, quick run-up, and sharp rejection at a pre-marked supply. This is often referred to as a “trap move” where late buyers are caught at highs. The clean volume spike at the breakout and immediate rejection within the supply zone is a common pattern seen in smart money distribution phases. Traders can look for potential **shorting setups** if the price re-enters the supply with weak momentum or **buying opportunities near the demand zone**, only with volume confirmation.
🧱 **Support & Resistance Analysis:**
* 🔼 **Resistance (Supply Zone):** 1547.40 – 1576.00
* 🔽 **Support (Demand Zone):** 1447.30 – 1460.90
A breakout above 1576 with strong volume can invalidate the supply zone. Until then, this remains a selling area. On the downside, if the price revisits the demand zone, it may offer a low-risk buying opportunity — but only if it holds with bullish candles and rising volume.
🔍 **Volume Analysis:**
The volume surged dramatically on the rally towards the supply zone, showing panic buying or aggressive short covering. The final rejection candle also saw elevated volume, which adds weight to the **supply zone rejection thesis**. Prior candles had lower volume, indicating absorption near lows and sudden spike into resistance. This is a signature behavior of “liquidity grabs.”
📌 **Educational Insight:**
This chart provides a clean **example of how price reacts to supply and demand zones**, especially intraday. Demand zones are best used for potential long setups only after a bullish confirmation, while supply zones can be used for shorts or to exit longs. These zones act as emotional points — where institutions look to trap retail traders. For intraday traders, this scenario shows why waiting for confirmation is key before entering trades around such zones.
⚠️ **Disclaimer:**
This analysis is for educational purposes only and does not constitute any investment advice or stock recommendation. Please consult with your financial advisor before taking any trading decisions. This post complies with SEBI regulations and is intended to promote financial literacy.

BDL - Stock Analysis📢 Disclaimer:
This analysis is for educational and informational purposes only and should not be considered as financial advice. Market movements are subject to various factors, and past performance does not guarantee future results. Please conduct your own research and consult with a registered financial advisor before making any investment decisions. 📊⚖️
📊 BDL Market Overview
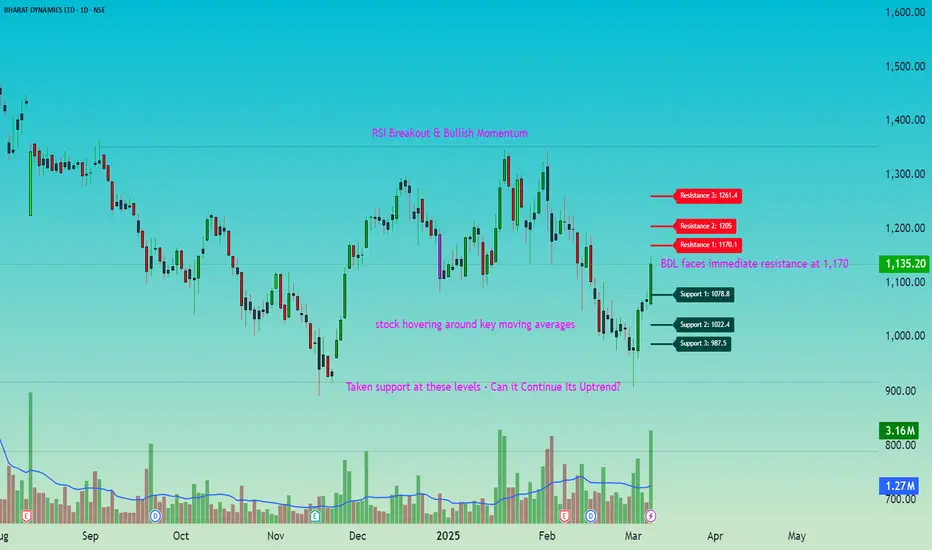
BDL opened at 1,061.9 and witnessed strong momentum, reaching a high of 1,148.6 before closing at 1,135.2 📈. The stock showed resilience, bouncing back from the day’s low of 1,057.3 and closing significantly higher than its previous close of 1,065.65 ✅. This upward movement indicates positive sentiment, with buyers showing strength throughout the session.
📌 Key Levels to Watch
BDL faces immediate resistance at 1,170 🚧, with further hurdles at 1,205 and 1,261 🔼. On the downside, support is seen at 1,079 ✅, followed by 1,022 and 988 ⚠️. A breakout above resistance could indicate continued strength, while a drop below key support levels may signal weakness. 📉
📊 Moving Averages Analysis
BDL is currently near its 50 EMA (1,124.49) 📉, with the 100 EMA at 1,151.01 and the 200 EMA at 1,138.21. The stock hovering around these levels suggests a crucial zone where further movement could decide the trend. A breakout above the 100 EMA may indicate strength 🚀, while dipping below the 50 EMA could bring caution ⚠️.
📊 RSI Breakout & Bullish Momentum
BDL has witnessed an RSI breakout 📈, signaling increasing buying strength. The presence of a strong bullish candle 🔥 further confirms momentum, indicating that buyers are in control. If this momentum sustains, the stock could test higher resistance levels 🚀. However, traders should watch for follow-through buying to confirm the trend ✅.
📊 Market Sentiment Overview
BDL is trading near key moving averages, indicating a crucial decision zone ⚖️. The stock has shown strong bullish momentum, closing well above its previous day’s level ✅. However, resistance at 1,170 🚧 may create short-term hurdles, while support at 1,079 is key for stability. The sentiment remains cautiously bullish, with a need for confirmation at higher levels.
🎯 Market Observation
If BDL breaks above 1,170, it could gain further strength toward 1,205 – 1,261 🚀. On the downside, a slip below 1,079 may lead to a test of 1,022 – 988 ⚠️. Moving averages suggest a critical juncture, where sustained buying could fuel an uptrend, while rejection near resistance may cause consolidation.
📢 Conclusion
BDL has strong momentum, but key levels must be watched for confirmation. A break above resistance could drive further upside 📈, while holding above support will be crucial for maintaining strength ✅. Market participants should stay alert to price action near moving averages and plan accordingly. 🚀
Bharat Dynamics Ltd. - Breakout OpportunityDate : 11-Dec-2024
LTP : Rs. 1,212.05
Targets: (T1) Rs. 1,350 --> (T2) Rs. 1,496 --> (T3) Rs. 1,662 --> (T4) Rs. 1,794
SL : Rs. 1,049
Technical View:
• NSE:BDL was going through it's primary downtrend since Jul-2024.
• After touching a lifetime high of 1,794.70 on 5-Jul-2024, it has retraced 50% to 890 level.
• NSE:BDL has recently breakout from it's primary downtrend with higher than average volume.
• NSE:BDL is trading above 20 DEMA and 50 DEMA since last few sessions. 20 DEMA has crossed over 50 DEMA.
• RSI is in buy zone and trading at 64.58. MACD has crossed 0 line and trading at 40.98
• Both RSI and MACD are showing positive divergence, indicating trend reversal.
• Looking strong to start an upward journey from here.
Liked the analysis? Boost/Like this idea and follow my ID.
Disclaimer: I am not a SEBI registered analyst/consultant and not recommending anyone to take any BUY or SELL position in stock market. Investing in stock market is risky and one should do a self analysis and validation before investing in stock market. My ideas are published for learning purpose only and are available to everyone at no cost/charge.

Bharat Dynamics Ltd - Breakout OpportunityDate : 7-Jun-2024
Rating : Buy - Positional Trade
LTP : Rs. 1,430.95
Targets: (1) Rs. 1,662 --> (2) Rs. 1,891 --> (3) Rs. 2,261
SL : Rs. 1,293 on daily close basis
Technical View:
• NSE:BDL is in its primary uptrend and was recently going through it's secondary downtrend.
• After touching the high of 1,662.95 on 3-Jun-2024, it has retraced 22% to 1,293.20 level and taken support at 20 DMA.
• On 7-Jun-2024, NSE:BDL has broke out from its secondary down trend with high volume.
• Prices are trading above 20 DMA, 50 DMA and 21 DEMA.
• RSI is trading at 59.84 and MACD is trading at 114.27.
• Looking good to start a new swing from here.
• All the above observations are noted in Daily Timeframe.
Disclaimer : I am not a SEBI registered analyst/consultant and not recommending anyone to take any BUY or SELL position in stock market. Investing in stock market is risky and one should do a self analysis and validation before investing in stock market. Ideas are published for learning purpose only.

Bharat Dynamics Ltd - Breakout OpportunityDate : 16-May-2024
Rating : Buy - Positional Trade
LTP : Rs. 2,069.60
Targets: (1) Rs. 2,098 --> (2) Rs. 2,278 --> (3) Rs. 2,571
SL : Rs. 1,938 on daily close basis
Technical View:
• NSE:BDL is in its primary uptrend and was recently going through it's secondary downtrend.
• After touching the high of 2,097.95 on 25-Apr-2024, it has retraced 14% to 1,805.55 level.
• On 16-May-2024, NSE:BDL has broke out from its secondary down trend with higher than average volume.
• NSE:BDL is already trading above 20 DMA, 50 DMA and 21 DEMA.
• Both RSI and MACD have formed bullish crossover and are trading at 66.32 and 41.62 respectively.
• Looking strong to start a new swing from here.
Key Events:
• 2/1 stock split. Record Date: 24-May-2024
• Quarterly Result and Dividend announcement: 29-May-2024
Disclaimer : I am not a SEBI registered analyst/consultant and not recommending anyone to take any BUY or SELL position in stock market. Investing in stock market is risky and one should do a self analysis and validation before investing in stock market. Ideas are published for learning purpose only.

Bharat Dynamics Ltd - Breakout OpportunityDate : 27-Mar-2024
Rating : Buy - Positional Trade
LTP : Rs. 1,755
Targets: (1) Rs. 1,810 --> (2) Rs. 1,984 --> (3) 2,252
SL : Rs. 1,625
Technical View:
• NSE:BDL is in its primary uptrend since long time and was recently going through it's secondary downtrend.
• After touching the life time high of 1,984.80 on 27-Feb-2024, it has retraced 22% to 1,552.10 level.
• NSE:BDL has broke out from its secondary down trend on 26-Mar-2024 with higher volume.
• RSI has crossed 50 on 26-Mar-2024.
• On 27-Mar-2024 it has closed above both 20 DMA and 50 DMA.
• Looking strong to start a new swing from here.
Disclaimer: I am not a SEBI registered analyst/consultant and not recommending anyone to take any BUY or SELL position in stock market. Investing in stock market is risky and one should do a self analysis and validation before investing in stock market.
