Bearish Hammer – EMA Confirmation Setup🧭 Overview
The Bearish Hammer pattern appears near the top of an upward move and signals potential buyer exhaustion. When combined with EMA High–Low band alignment, it provides a structured approach to identify early downside pressure.
⸻⸻⸻⸻⸻⸻⸻⸻⸻⸻⸻⸻⸻⸻
📘 Concept
A Bearish Hammer forms after an advance, where price attempts to move higher but faces strong rejection. The long upper wick reflects selling pressure entering the market.
To increase reliability, this setup is combined with the EMA High–Low band:
• The hammer should form above the EMA band.
• The EMA band should not touch the hammer body.
This alignment strengthens bearish bias within the broader structure.
⸻⸻⸻⸻⸻⸻⸻⸻⸻⸻⸻⸻⸻⸻
📊 Chart Explanation
1️⃣ A Bearish Hammer forms near the top of the move, indicating buyer exhaustion.
2️⃣ The candle appears above the EMA High–Low band, supporting bearish alignment.
3️⃣ The hammer’s low acts as the validation line for downside confirmation.
4️⃣ A close below the validation line confirms weakness.
5️⃣ A break above the hammer high acts as the devalidation level and cancels the setup.
⸻⸻⸻⸻⸻⸻⸻⸻⸻⸻⸻⸻⸻⸻
📝 Summary
Bearish Hammer near highs signals early selling pressure.
EMA band alignment improves structure clarity.
Close below the hammer low confirms the setup.
Break above hammer high invalidates the pattern.
⸻⸻⸻⸻⸻⸻⸻⸻⸻⸻⸻⸻⸻⸻
⚠️ Disclaimer
📘 For educational purposes only.
🙅 Not SEBI registered.
❌ Not a buy/sell recommendation.
🧠 Purely a learning resource.
📊 Not Financial Advice.
Bearish Patterns

A 1500 points drop in NQ this week? Hello traders!
NQ has broken through Friday's high and almost hit the daily wick CE . We also have continuous bullish candles on the daily which would form a complete order block . We also have a 12h gap inside the daily order block which the market has tapped into. I'm expecting an extremely bearish week with draws to 24239.75, 23904.50, and a daily fvg at 23600.
We also have NFP this week which has been delayed as it was originally supposed to come out on Friday itself. It's a red folder packed week and I suggest super caution around those times. We also have CPI on Friday which was supposed to be released on Wednesday of this week. When the calendar is messed with, it becomes obvious that manipulation will be at its peak.
We also have SMT divergence on the daily chart. That is just a bonus and not the base of this bearish idea. The foundation of this whole idea is based on where the market is heading, where the liquidity is resting.
Have a good trading week,
Satya.
P.S. Not financial advice.

CALLED ETH CRASH AT $3,700. NOW 65% DOWN. CALLED ETH CRASH AT $3,700. NOW 65% DOWN. ACCUMULATION ZONE ACTIVATED
REMEMBER MY WARNING?
When ETH Broke $3,700-$3,600 Support, I told you: "Major Breakdown Incoming"
THE RESULT:
✅ Entry Warning: $3,700
✅ Current Price: ~$1,700
✅ Total Drop From Our Entry: -54% (65% from Peak in Last 6 months)
ACCUMULATION ZONES:
✅ Zone 1: $2,000-$1,800 - FILLED (First Bids Triggered)
🎯 Zone 2: $1,400-$1,270 (0.786 Fib) - BIDS PLACED
→ This is maximum Pain Zone
→ Historical Bounce Level
→ Best Long-Term Entry
WHY I’M LONg-TERM BULLISH ON CRYPTOCAP:ETH :
→ U.S. ETH ETFs Have Accumulated 6M ETH ($55B) in ~18 months
→ Bitmine Continues aggressive Accumulation, Now Holding 4.28M ETH (~$13B+)
→ Combined with Other ETH-Strategy Firms, Institutions Now Control ~13M ETH
This Level of Structural, Long-Term Demand is Extremely Bullish for Ethereum’s Next Cycle.
Long-Term Targets: $10,000-$20,000 (5-10x Potential)
MY APPROACH:
1️⃣ Scale in Slowly (Not All-In)
2️⃣ Place Bids at Key Technical Levels
3️⃣ Let Market Come to Me
4️⃣ Think in Years, Not Weeks
THE MINDSET (THE REALITY):
❌ Most Bought at $3,700 (Greed)
✅ I'm Buying at $1,800 (Fear)
This is how generational wealth is built in crypto.
IMPORTANT:
This is NOT Short-term Trading, This is LONG-TERM Accumulation
65-80%% Corrections = Normal in Crypto
Next Bull Run = 500-1000% Moves
THE FIBONACCI PROOF:
0.618 Fib ($1,700) = Current Support Test
0.786 Fib ($1,270) = Maximum Opportunity
More Downside Possible Before Reversal.
But When $10K-$20K Hits, You'll Remember this Post.
NFA. ALWAYS DYOR. Scale in Smart.

OCTOBER 18: I CALLED $107K CRASH. TODAY: BITCOIN -44% AT $60K.OCTOBER 18: I CALLED $107K CRASH. TODAY: BITCOIN -44% AT $60K. RECEIPTS INSIDE.
They Called Me "FUD Spreader" When I Warned You On October 18, 2025.
Bitcoin Was At $107K.
Everyone Screamed "BUY THE DIP"
I Showed You The Bearish Divergence And Said: "Protect Your Capital."
THE NUMBERS DON'T LIE:
Bitcoin: $107,000 → $60,000
Total Drop: -44%
Short Profit: $47,000 Per BTC
IF YOU FOLLOWED THIS ANALYSIS:
✅ You Saved Your Portfolio From -44% Destruction
✅ You Made Massive Profits On The Short
✅ You're Now Positioned To Buy At 44% Discount
✅ You Ignored The Noise And Followed The Chart
WHAT HAPPENED:
Weekly Bearish Divergence ✓ CONFIRMED
$104K Support Breakdown ✓ BROKE
$73K Support Level ✓ SMASHED
$66K Zone ✓ CRUSHED
Now At $60K Testing Critical Support
WHAT'S NEXT:
$48K-$49K Zone Still In Play If $60K Breaks.
This Is NOT About Being Bearish.
This Is About PROTECTING CAPITAL And Buying Smart.
Bull Market Will Continue.
But Corrections Are PART Of The Journey.
Now You Can Start Accumulation Bitcoin From $60K Level Slowly
THE DIFFERENCE:
❌ Moonboys: "Buy At $107K, HODL Forever"
✅ Real Analysis: Save 44%, Re-Enter Lower
This Is Why Technical Analysis Matters.
This Is Why You Don't Follow Blind Hopium.
Drop Comment If You Followed This Call.
More Updates Coming. The Opportunity Isn't Over.

$ZEC Update: 3 Perfect Calls. 3 Massive Wins. What's Next?CRYPTOCAP:ZEC Update: 3 Perfect Calls. 3 Massive Wins. What's Next?
Let Me Walk You Through How We Played This:
📍 Feb 2024: Called CRYPTOCAP:ZEC at $20–$24. Everyone Laughed. Said I Was Crazy.
📍 Nov 2025: Price Exploded to $750. +3100% Gains for Believers.
📍 Call #1: SHORT: Told You to Exit/Short Around $700–$750. Price Dumped 55% After My Warning. Shorts Printed Heavy.
📍 Call #2: LONG: Told You to Go Long After the Dump at $300. Price Pumped to $560. That's 86% Profit booked.
📍 Call #3: EXIT: Warned Again that Price Had high Chances to Dump from $500 Level. Same thing Happened.
Now Look Where We Are: CRYPTOCAP:ZEC Trading at $276
↓ 60% Down from our First Short Entry
↓ 50% Down from our Second Exit/Short Warning
3 Calls. 3 Wins. No Luck, Just Charts.
What's Next?
I Still Believe ZEC Can Hit: → $190 → $100 (Major HTF/FVG Level)
The Unfilled HTF FVG Below Hasn't Been Swept yet. Structure Says Lower Before Any Real Reversal.
Keep These Levels on Your Radar if you're Looking to Enter.
Don't Chase. Don't FOMO. Wait for the Levels.
Hope you Enjoyed the Accuracy. More Coming.
Who's Been Following Since $20? 👇
NFA | ALWAYS DYOR

$BTC UPDATE: 22% DOWN FROM MY SHORT ZONECRYPTOCAP:BTC UPDATE: 22% DOWN FROM MY SHORT ZONE
When Most MoonBoys Were Calling $200K–$500K... I Shared Shorts at $95K-$98K.
Today: Bitcoin Touched $75,500 ✅
Results Without Leverage: +22%
With 5x Leverage: ~100%+ ProfitIf You Followed the Setup and Now Time to Book Profits.
The Trend Was Clear:
→ Bear Flag Breakdown
→ H&S Failure
→ Lower Highs, Lower Lows
This is Why We Trade Structure, Not Hopium.
Risk Management Saved Portfolios.
Stop Losses Kept You in the Game.
Moon Boys Don't Teach You Risk Management.
Charts do.
Always Trade with a Plan. Always manage Risk.
Hope You Saved Capital & Banked Gains.
Not financial Advice. ALWAYS DYOR.

Double Top Pattern🧭 Overview
A Double Top is a bearish reversal pattern that indicates a potential end to an uptrend and a shift toward a downward phase. It forms an “M”-shaped structure on the chart, marked by two consecutive peaks at nearly the same level, separated by a moderate pullback known as the neckline. The pattern is confirmed when price decisively breaks and closes below the neckline, signaling weakening buying strength and a change in market control.
------------------------------------------------------------
🔑 Key Components of a Double Top Pattern
1️⃣ First Peak
Price rallies strongly to a high, marking the end of an extended upward move. A pullback follows, indicating the first sign of resistance.
2️⃣ Trough / Neckline
After the first peak, price retraces to a support area and stabilizes. This level forms the neckline, which acts as a key decision zone.
3️⃣ Second Peak
Price attempts to rise again toward the previous high but fails to break above it. This failure reflects weakening buying momentum and growing selling pressure.
4️⃣ Breakdown (Confirmation)
The pattern is confirmed when price breaks and closes below the neckline, signaling a shift in trend direction.
------------------------------------------------------------
📊 Chart Explanation
Two prominent peaks form near the same price level, highlighting strong resistance.
The pullback between the peaks creates a clear neckline support.
The second peak shows reduced strength compared to the first.
A decisive breakdown below the neckline confirms the reversal and opens the path toward lower levels.
------------------------------------------------------------
📝 Summary
• Double Top forms after a strong uptrend.
• Failure at the second peak indicates buyer exhaustion.
• Neckline acts as a key confirmation level.
• Breakdown below the neckline validates the reversal structure.
------------------------------------------------------------
⚠️ Disclaimer
📘 For educational purposes only
🙅 Not SEBI registered
❌ Not a buy/sell recommendation
🧠 Shared purely for learning and pattern understanding
📊 Not Financial Advice

BTC Confirms Bearish Structure After Neckline RejectionBTC Confirms Bearish Structure After Neckline Rejection
#Bitcoin has rejected the 94k–98k neckline resistance, confirming a bearish market structure.
➡️ Resistance: 94k–98k
➡️ Supports: 80k → 75k → 70k
Structure shows a confirmed Head & Shoulders Pattern Failed, Followed by a bear flag breakdown, trend remains decisively bearish.
Outlook:
Below 90k, downside continuation is favored.
Measured move points to 75k–70k (~22% downside).
Bullish bias only returns on a strong reclaim and acceptance above 92k.
Until then: sell the rallies, respect the trend.
Not financial advice. DYOR.

ITC - WyckoffITC – Weekly Wyckoff Distribution (Schematic #2) in Play
ITC’s weekly structure appears to be unfolding as a Wyckoff Distribution – Schematic #2, suggesting a transition from demand dominance to supply control.
Key observations from the chart :
Preliminary Supply (PSY) marked the first sign of large supply entering after a strong uptrend.
Buying Climax (BC) followed by an Automatic Reaction (AR) confirmed the start of a trading range.
Secondary Test (ST) failed to make new highs, indicating weakening demand.
Upthrust (UT) and subsequent Lower Highs (LPSY) signal repeated absorption of demand by smart money.
Recent breakdown below the range indicates Sign of Weakness (SOW) and confirms Phase D/E behavior.
📉 Implication:
The structure favors distribution completion, with risk skewed to the downside unless price reclaims the prior range convincingly.
📌 Key levels to watch:
Breakdown area as resistance
Major demand zone near ₹277–₹262 (weekly support)
This is a reminder that time spent at the top often precedes the move down.

What exactly you have to do when the Markets are REDI make educational content videos for swing trading basis
Charts used are older than 3 months in this video

XAUUSD Range Breakdown | Sell the Retest SetupGold (XAUUSD) has broken down from its consolidation range, signaling a potential shift in momentum to the downside.
Price is now expected to retest the breakdown zone between 4390 – 4400, which could act as fresh resistance.
📌 Trade Setup (Short):
Instrument: XAUUSD (Gold)
Sell Zone: 4390 – 4400
Targets: 4365 → 4355
A rejection from this retest zone may offer a high-probability sell opportunity, with momentum favoring further downside continuation.
⚠️ Wait for price reaction near the zone and follow strict risk management.
📌 Disclaimer:
This analysis is for educational purposes only and is not financial advice. Always manage risk and follow your trading plan.
Your feedback drives our content and keeps everyone trading smarter. Let’s make those pips together! 🚀
Happy Trading,
– The InvestPro Team

BTC at Major Resistance | Short Opportunity Near 90K ZoneBitcoin (BTCUSD) is approaching a key resistance zone between 89,900 – 90,600, an area where price has a higher probability of facing selling pressure.
📌 Trade Idea (Short Setup):
Instrument: BTCUSD
Sell Zone: 89,900 – 90,600
Target Area: 88,500 – 88,000
This zone may act as a supply area, where bears could step in to defend higher prices. Rejection signals or weakness near resistance could offer a favorable risk-to-reward short opportunity.
⚠️ Always wait for confirmation and manage risk wisely.
📌 Disclaimer:
This analysis is for educational purposes only and is not financial advice. Always manage risk and follow your trading plan.
Your feedback drives our content and keeps everyone trading smarter. Let’s make those pips together! 🚀
Happy Trading,
– The InvestPro Team

BITCOIN at a MAKE-OR-BREAK zoneBITCOIN at a MAKE-OR-BREAK zone
CRYPTOCAP:BTC must break $90,000 to unlock the $107,000 upside.
❌ If $90K fails → Downside Opens to $70K–$65K
Technicals Show a Bearish Pennant And Pattern Target: ~$70,000
These levels are CRITICAL. Watch closely.
NFa & DYOR

SILVER | Monthly TA – High-Risk ZoneSILVER | Monthly TA – High-Risk Zone
#Silver is in a vertical Expansion Phase and Trading far above Long-Term Trend Support.
Price is testing a macro Supply / Distribution Zone after a Parabolic advance.
If Distribution Confirms:
→ Mean Reversion Toward 0.382–0.5 Fib ($39–$31)
→ Extended Correction into 0.618 Fib (~$24) Possible
Momentum is Climactic — Risk > Reward at Highs.
This is a Decision Zone, not a Chase Zone.
Monthly Timeframe | Structure > Noise
⚠️ Disclaimer: This is Pure TA. Markets involve Risk. NFA & DYOR Before Making any Trading or Investment Decisions.

$FLOW CRASH ALERT – WHAT JUST HAPPENED?AMEX:FLOW just got destroyed, dropping over 52% in 24 hours.
Price action
High: $0.174
Low: $0.079
Current: ~$0.10
Major Red Flags Today:
🔹 Upbit & Bithumb Suspended Deposits and Withdrawals
🔹 South Korea’s DAXA Issued a Trading Risk Warning
🔹 Flow Foundation confirmed they are investigating a potential security incident on the Flow network
What On-Chain Data Shows:
🔹 Top 100 holders Reduced Holdings by ~2.79M FLOW
🔹 No Smart Money Accumulation signal
🔹 Heavy Selling by Public Wallets During Peak Hours
🔹 ~1.69M FLOW moved to Exchanges (Selling Pressure)
🔹 Late buyers Jumped in During the Crash, Not Before
Market Behavior:
🔹 Panic selling dominated
🔹 Whales appear to have distributed near highs
🔹 Some wallets aggressively bought the dip amid fear
🔹 Reports of a large whale dumping on DEXs
Uncertainty Remains:
🔹 Cause of the “security incident” is still unclear
🔹 CEX suspensions increase fear and volatility
🔹 Short-term sentiment remains extremely bearish
This Move Was Driven by Fear, Uncertainty, and Heavy Selling Pressure. Until Clarity Comes from the Flow Foundation, Risk Remains Very high.
Investors are Waiting for clear Answers from Flow Blockchain
Trade Carefully. Volatility is Brutal Right Now.
NFA & DYOR

FlagBreak - Bearish Continuation🔎 Overview
This chart highlights a Bearish Flag structure, a continuation pattern that forms after a strong directional move. It reflects a temporary pause in price before momentum potentially resumes in the same direction .
------------------------------------------------------------
📘 Concept — Bearish Flag
A Bearish Flag forms when price makes a sharp downward move (impulse) followed by a brief upward-sloping consolidation.
This consolidation is corrective in nature and does not indicate a trend reversal.
------------------------------------------------------------
🧭 How to Use
• Validation → Successive candle closes below the lower boundary confirm continuation.
• Devalidation → Candle closes above the upper boundary invalidate the setup.
------------------------------------------------------------
📊 Chart Explanation
1️⃣ Strong Impulsive Move (Flagpole)
The sharp downward move on the left shows aggressive selling pressure and establishes strong directional momentum.
2️⃣ Consolidation Phase (Flag Structure)
After the drop, price moves upward inside a narrow sloping channel, indicating a pause rather than reversal.
3️⃣ Lower Highs and Higher Lows
Price forms a compact structure with lower highs and higher lows, reflecting temporary balance.
4️⃣ Weak Pullback
The rising channel represents a corrective counter-move with reduced momentum, suggesting sellers remain in control.
5️⃣ Continuation Expectation
A decisive close below the lower flag boundary confirms the end of consolidation and continuation of the prior move.
------------------------------------------------------------
📝 Summary
Strong impulse defines direction
Rising flag shows corrective pause
Momentum remains weak during consolidation
Breakdown confirms continuation
------------------------------------------------------------
⚠️ Disclaimer
📘 For educational purposes only.
🙅 Not SEBI registered.
❌ Not a buy/sell recommendation.
🧠 Purely a learning resource.
📊 Not Financial Advice.

Rising Wedge - Bearish setup🔎 Overview
The Rising Wedge is a price structure that develops during an upward phase where price continues to make higher levels, but the rate of advance gradually slows. The narrowing structure reflects weakening participation as price moves higher, often signaling exhaustion rather than strength.
------------------------------------------------------------
📘 Concept
A Rising Wedge is formed when price creates Higher Highs (HH) and Higher Lows (HL) inside a tightening upward channel.
Although price is still moving upward, each push higher covers less distance, indicating fading momentum and increasing imbalance between effort and result.
------------------------------------------------------------
📊 Chart Explanation
1️⃣ Higher Highs & Higher Lows
Price initially forms HH and HL, confirming an established upward structure and buyer control in the early phase.
2️⃣ Narrowing Upward Channel
The distance between highs and lows contracts as price rises, showing slowing momentum and reduced follow-through at higher levels.
3️⃣ Consolidation Near the Upper Range
Price pauses and compresses near the upper boundary of the wedge, highlighting balance and short-term indecision.
4️⃣ Momentum Weakening
Repeated tests near the upper boundary fail to generate strong expansion, indicating declining buyer participation.
5️⃣ Structural Shift Confirmation
• Weakening buyer strength becomes visible as price struggles to hold higher levels.
• Successive candle closes below the lower wedge trendline confirm a structural shift and validate the bearish reversal.
------------------------------------------------------------
📝 Summary
Rising Wedge reflects slowing upside momentum within an upward structure.
Price compression signals exhaustion rather than continuation.
Consolidation near the top highlights market indecision.
A confirmed close below the lower wedge line marks the directional shift.
------------------------------------------------------------
⚠️ Disclaimer
📘 For educational purposes only.
🙅 Not SEBI registered.
❌ Not a buy/sell recommendation.
🧠 Purely a learning resource.
📊 Not Financial Advice.

$TWT at a Major Decision Zone | Accumulation or Distribution?CRYPTOCAP:TWT at a Major Decision Zone | Accumulation or Distribution?
CRYPTOCAP:TWT has been range-bound between $0.65 – $1.55 for nearly 3 years, signaling a long-term consolidation. This structure usually precedes a big directional move, the only question is which side breaks first.
Bullish Structure (Accumulation Case)
🔹 Primary accumulation zone: $0.92 – $0.72
🔹 Key condition: Price must hold above $0.70
🔹 If support holds Upside expansion targets: $2 → $5 → $10 (only after confirmed breakout)
Bearish Structure (Distribution Case)
🔹 $0.70 = critical long-term support
🔹 A clean breakdown below $0.70 confirms bearish market structure
🔹 Downside Targets: $0.20 – $0.10 (70–80% potential drawdown)
Key Technical Levels
Strong Resistance: $1.72
Major Support: $0.70
FVG / Demand Zone: $0.23 – $0.17
Technical Conclusion
CRYPTOCAP:TWT is compressing inside a multi-year range. No bias until breakout or breakdown.
Trade only confirmed setups, manage risk tightly, and let price decide the direction.
NFA & DYOR

$BTC: Technical Breakdown (High-Probability Bearish Setup)CRYPTOCAP:BTC : Technical Breakdown (High-Probability Bearish Setup)
Market Structure Shift
Bitcoin has Already lost $107000 major bullish support and is sustaining below it, confirming a bearish market phase.
The Head & Shoulders distribution pattern is fully validated.
Head & Shoulders Measurement
As per classical H&S rules, the 162% extension target of the pattern has already been achieved on the downside, indicating:
🔹 Pattern completion
🔹 Cycle top likely formed
🔹 Transition from bull to bear phase
Fibonacci Retracement (Macro Bear Framework)
Measured from bear-market low → cycle top, Fibonacci levels project:
0.382 Fib: ~$56,700
0.5 Fib: ~$44,000 → key bear market acceptance zone
0.618 Fib: ~$35,000 → strongest macro support / worst-case scenario
Current price action still reflects a healthy macro retracement, not capitulation.
Liquidity & Imbalance
Despite the bearish structure, a Fair Value Gap (FVG) remains unmitigated in the $98,000–$100,000 range.
This level may act as a liquidity magnet before the next impulsive leg down.
Bias & Scenarios
Primary bias: Bearish
Relief rally possibility: $98K–$100K (FVG fill)
Next downside leg: $70K–$60K, then deeper Fib supports
Conclusion
With H&S 162% target completed and structure broken, BTC remains bearish by technical definition.
Trade only with confirmation, manage risk, and respect all valid scenarios.
NFa & DYOR

$BONK Technical Analysis Update by CryptopatelSIX:BONK Technical Analysis Update by Cryptopatel
Current Structure:
SIX:BONK has broken key support at $0.00001 and is currently retesting the level.
Red zone: $0.000010 – $0.00001125.
Price below this zone = bearish, high probability of testing Bullish Order Block between $0.00000450 – $0.00000350, which is the prime accumulation area.
Retracement Outlook:
If SIX:BONK fails to reclaim $0.00001, expect 50%–70% retracement in the next few weeks.
Bullish Flip:
Key breakout required: $0.00001250.
Closing above this Red box signals super bullish momentum, potential 200%–400% upside.
Trade Watch:
Red zone $0.000010–$0.00001125 = critical level to enter trades.
Monitor price reaction at Bullish Order Block for optimal accumulation.
Summary:
Below $0.00001 → Bearish / accumulation phase
Above $0.00001250 → Super bullish breakout
TA Edge: Discipline on zones + clear breakout confirmation = key to maximizing gains.
NFA & DYOR

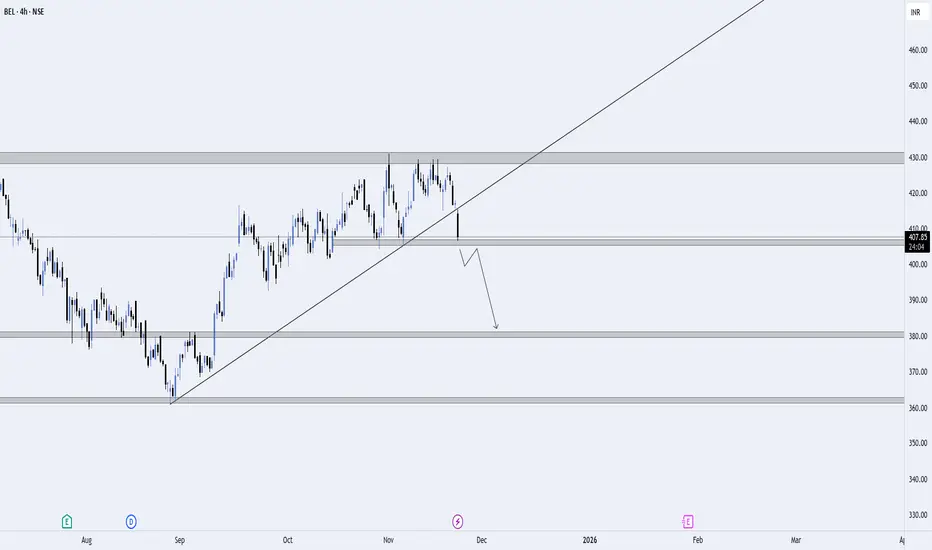
BEL – Trendline Breakdown & Supply Zone Rejection | Bearish SetuBEL has rejected strongly from the higher-timeframe supply zone around ₹425–₹430, followed by a clean trendline breakdown. This breakdown signals weakening bullish momentum and opens the door for a deeper correction.
📌 Key Highlights
Strong rejection from the major supply zone.
Clear trendline break, indicating a shift in structure.
Price currently hovering near ₹408–₹410 support.
Expecting a pullback before continuation.
🎯 Entry Plan (Breakdown + Retest)
🔽 Preferred Entry Model
1. Breakdown:
Price breaks below the minor structure at ₹406–₹408 with a strong bearish candle.
2. Retest:
Wait for price to pull back toward ₹408–₹410 (previous support → now resistance) OR a retest of the broken trendline.
3. Entry Trigger:
Enter short only after a bearish rejection (wick rejections / bearish engulfing / breakdown of retest low).
📍 Ideal Entry Zone:
₹400 – ₹403
🎯 Targets
TP1: ₹395
TP2: ₹382
Final Target (HTF Demand): ₹360 – ₹365
❌ Invalidation
Setup invalid if BEL reclaims ₹425 and sustains above the supply zone.
📈 Bias
Bearish as long as the price stays below the breakdown zone and the trendline.
BTC Breakdown Confirmed – Here’s Where BTC Could Surge NextBTC Breakdown Confirmed – Here’s Where BTC Could Surge Next
1️⃣ Long-Term Trendline Breakdown Confirmed
🔹 BTC has decisively broken the multi-year ascending trendline supporting price since Nov 2022.
🔹 The Breakdown + Retest at ~$104k-$108k confirms bearish structure ✅.
🔹 Retest failed in Oct 2025, confirming sellers are in control.
2️⃣ Fibonacci Levels Highlight Strong Demand
🔹 Price is now hovering between 0 Fib ($125,647) and 0.382 Fib ($56,494).
🔹 Measured move Targets: Strong Demand Zone $34,477 - $56,494 (0.618 - 0.382 Fib)
🔹 This is the accumulation zone for long-term positions, historically providing strong bounce potential.
3️⃣ Critical Support / Resistance Zones
🔹 Immediate Support: $85k-$87k (psychological)
Major Support:
🔹 $56,494 (0.382 Fib, upper demand)
🔹 $44,133 (0.5 Fib, middle demand)
🔹 $34,477 (0.618 Fib, “Golden Pocket”, lower demand)
Resistance: Broken trendline now acting as key supply
4️⃣ Potential Scenarios
Bearish (High Probability)
🔹 Continuation down to Strong Demand Zone ($34k-$56k)
🔹 Represents 38-61% retracement from ATH, typical after trendline breakdown + retest
Bullish (Needs Reclaim)
🔹 Reclaim broken trendline (~$95k-$100k)
🔹 Close above $104k = false breakdown, continuation to new highs
Why I’m Watching $56,500 - $34,500 for Longs
🔹 Historical accumulation zone with high probability of a strong bounce
🔹 After breakdown + retest, price often retraces to 0.5 or 0.618 Fib before resuming bull trend
🔹 Perfect long-term entry for those aiming for multi-year BTC upside
BTC may test the $56k-$34k demand zone soon. For long-term holders, this is a prime accumulation area before the next bull cycle. Stay patient and strategic – $1M BTC dreams require discipline, not FOMO.
Guys, don’t judge me: I’m a Bitcoin lover too. I’m just reading what the chart is showing. Even if the short-term looks bearish, I see the setup for a massive long-term move toward $1M 🚀
NFA & DYOR

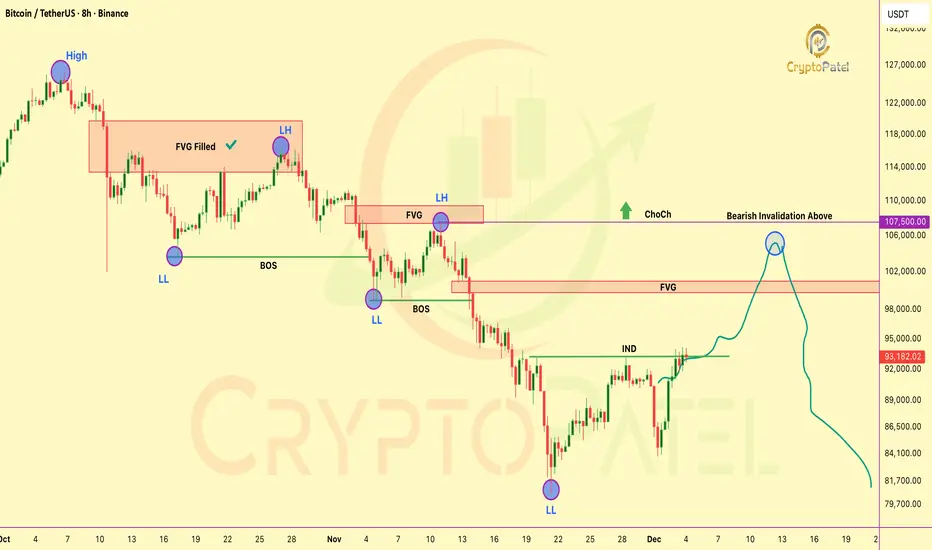
HTF ChoCH Alert: BTC’s Macro Bias Is Still BearishHTF ChoCH Alert: BTC’s Macro Bias Is Still Bearish
BTC is still following clean HTF bearish order-flow (LH → LL → BOS).
The current push up is just a premium retracement, driven by internal liquidity grabs.
Price is reaching for the premium FVG at 99,866–101,184, the next clear draw on liquidity and a prime reversal zone.
Below 107,500 bias stays bearish (Bearish Invalidation / HTF ChoCH)
Expect: BSL sweep → FVG fill → mitigation → sell-side continuation.
ICT view:
Market is simply rebalancing inefficiency before delivering lower.
NFA & DYOR