Bearish View On SGX NIFTY In SGX Nifty Formed A Triangle Pattern in 5Mins Chart So That Triangle Pattern Indicates SGX Nifty Will Fall
So You Need To Do Short Sell Only
Don't Buy Call Options Sell Call Options And Buy Put Options
SGX Immediate Resistance @17415 If SGX Nifty Breaks @17415 Then It Will Upto @17480.
SGX Nifty Immediate Support @17340 If SGX Nifty Breaks @17340 Then It Will Fall Upto @17290
If SGX Nifty Breaks Major Support @17290 Then It Will Fall Upto @17100
• DISCLAIMER :-
Iam Not A SEBI Registered Analyst
If You Take Any Position Consultant Your Financial Advisor
Iam Not Responsible For Your Loss And Profit
Thank You
Bearish Patterns

BIOCON in full bear gripShort Biocon 308, on every rise till 314 for tgt of 295/280. Invalid above 319 closing basis

Renuka Sugar Short Double top formation with momentum on downside.
Renuka Sugar has formed double top formation in daily time frame and Longterm investor should be cautious in this stock as major reversal may happen in this stock.
Momentum on down side is strong as RSI level is below 40 and volumes has been increasing in down trend.
Bullish trade should be avoided in this stock.
Investor should do their own analysis.
Happy Trading !!!!!

M&M Finance SHORT , Descending TriangleThe Short Setup is Very Clear here + on Friday there was a News Item: "RBI bars Mahindra Finance from using third-party recovery agents after Hazaribagh mishap" which is serving as the Catalyst for the Selling Pressure in this Stock. M&M Finance involved in Unethical Practices and hence the Stock Price is being Hammered.
A Classic Descending Triangle on the Hourly Time Frame
One can Short for
Targets:
T1= 185
T2= 182 - 180
with Stop Loss > 200

Nifty headed towards 14100Nifty has been making lower lows On daily chart but failed to make higher highs. Looking forward to see nifty at 14200 in next 3-6 months,

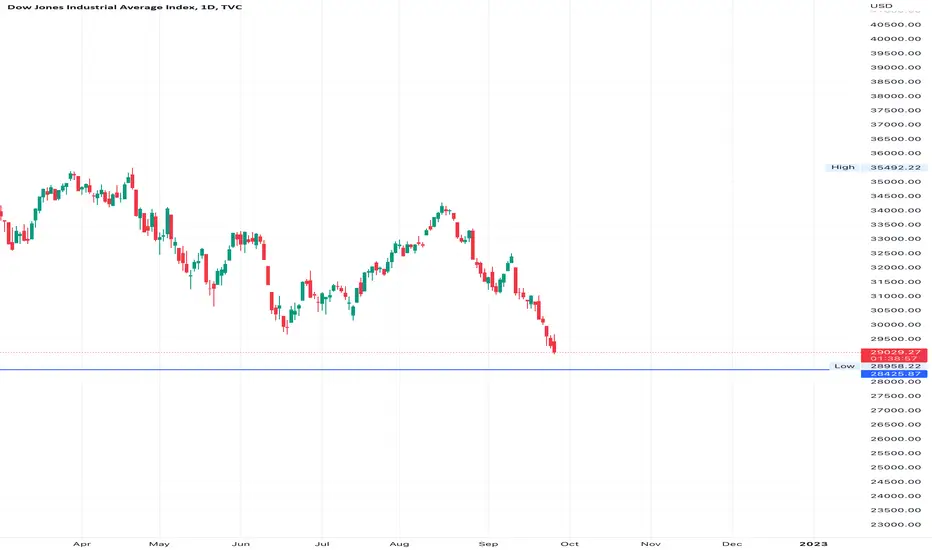
Dow jones made lower low yet again Dow jones has making lower lows with lower highs which is not a good signal in upcoming 6 months for USA and other economies such as Nifty.
To know full analysis kindly click on the
RSI Divergence: Apollo TyresIn NSE:APOLLOTYRE the stock was making Higher highs whereas RSI was making lower highs creating the divergence. The stock yesterday closed below the trendline and so did the Rsi. The target for the same will be the immediate support that is also the channel line of the stock.
* It is my analysis and not a buy or sell recommendation.


US DOLLAR CURRENCY INDEX VIEW! Hello, us dolar curency index trading @113 on harmonic level 1.618 can correct if breaks can go upto @120 & @127 (targets identified from swing high & harmonic xabcd patern level 1.131) above @113 indian stock market will fall. Fiis puling out money from stock market. CAPITALCOM:DXY

Short Gail for the targets of 84 and 78Gail is at the support and
Bollinger Bands are squeezed and the breakdown of the lower band.
Macd is Bearish Crossover
RSI is below 40
So short near the close of the candle for the targets of 84 and 78.

Nykaa breakout level mark for education only support levels not This is Disclaimer for all is only for E
ducation prepose only breakout going to have in this Stock nykaa

WBC Short side Swing Trademest capital indicator has generated an alert of going "SHORT" for WBC "Westpac Banking Corporation" Australia
Happy trading 🙏

CIPLA ZIGZAG CORRECTIONcipla is in wave c of zigzag correction, target can be seen towards 1019, one can also trail their position, on purple lines.


B-Nifty raised with Negative Divergence .B-Nifty raised with Negative Divergence if correction take place. it may be deep.
Major resistance 40500-40800

DLF ShortElliot Wave Counts are evident in Chart:
Rise from 23rd August is an ABC with C being an Ending diagonal, and on Friday there was a Clear Breakdown of the same.
Downside Target open to 372 - 360 (Lower BB)
Stop Loss > 410

Canara Bank SHORTElliot Wave Count:
Fall from Feb 2022 highs is in 3 Wave as ABC which is (W)
Rise is an (X) Wave with Lot of Overlapping, Falling Volumes and a Bearish RSI Divergence
Now Wave (Y) on the Downside is playing out
Downside Targets:
T1= 195
T2= 180
T3= 155
Stop Loss above 241


Shriram Transport Finance (Short Setup)BEARS to Attack SRTRANSFIN!
A Head & Shoulder Top Pattern is visible
+
EW count says 1 of (C) done as the 'v waves' marked
2 of (C) done as rise from 23rd August Low is overlapping
Now 3 of (C) down should start
CMP= 1324
TARGETS:
T1= 1260
T2= 1235
STOP LOSS > 1400
SShort

RELIANCE SHORTRELIANCE is making a good triangle pattern and moving averages are also showing bearishness in the stock thus Reliance can enter the Bear market once it breaks the triangle.
THE MAJOR support is now 2400 that's gonna be the first target and the second target can be 2200.


# Titan's next harmonic# Titan near to profit booking zone
PRZ-2640-2675
CMP:2493 @ 11 September 2022

#ASTRAL Harmonic worked perfectly#ASTRAL Harmonic
Profit booking zone - 2624.00
buy above 2212
CMP:1994 @ 29 August
