#ETHEREUM Technical Update: $3000 Hit Exactly as Mapped#ETHEREUM Technical Update: $3000 Hit Exactly as Mapped
CRYPTOCAP:ETH has tapped the $3000 zone, exactly as projected when price was breaking down from the $4000 bearish breakdown + retest.
We’re now ~30% down from the short-entry region.
If you shorted, you booked heavy profits.
If you didn’t, at least you avoided longing the top above $4000+
This is where the prime accumulation zone begins.
Key levels to watch:
🔵 $3000: First accumulation zone + bullish OB (Possible bounce reaction from here.)
🔽 Next support: $2400
Major Accumulation Zones:
0.5 FIB: ~$2621
0.618 FIB: ~$2255
If ETH sweeps into these FIB/FVG pockets, that becomes the high-discount, prime long-term accumulation zone.
Macro view unchanged: Long-term Target: $10K–$15K
Stay patient. Stick to structure. Accumulate smart, not emotional.
NFA & DYOR
Bearish Patterns

#BITCOIN UPDATE: Structure Still Playing Out Exactly as Mapped#BITCOIN Technical Update: Structure Still Playing Out Exactly as Mapped
CRYPTOCAP:BTC has now broken below the $90K zone, a level not seen since 22 April 2025, Seven months ago.
I told you this when Bitcoin was rejecting $115K, and we’re now ~22% down from that zone.
Price is following the structure with precision.
Key observations:
🔻 BTC currently sits on the 0.618 FIB: High-probability bounce zone.
A relief move into the $98K–$100K region is very possible in the coming days.
🔼 Upside FVG: ~$98,000
If price pushes deeper first, this FVG becomes the ideal tap before the next leg down.
This is why I said: don’t short here, Risk-reward is terrible at the lows.
A sweep toward $98K would offer a clean, low-risk short entry.
🔽 Downside FVG: ~$88,474: This zone can trigger a strong reaction and potential bounce.
Market structure remains intact:
Below $107.5K → macro bearish leg still active
Above $107.5K → invalidation + path toward new ATH reopens
Price continues to respect levels.
Charts > emotions. Structure > noise.
NFA & DYOR
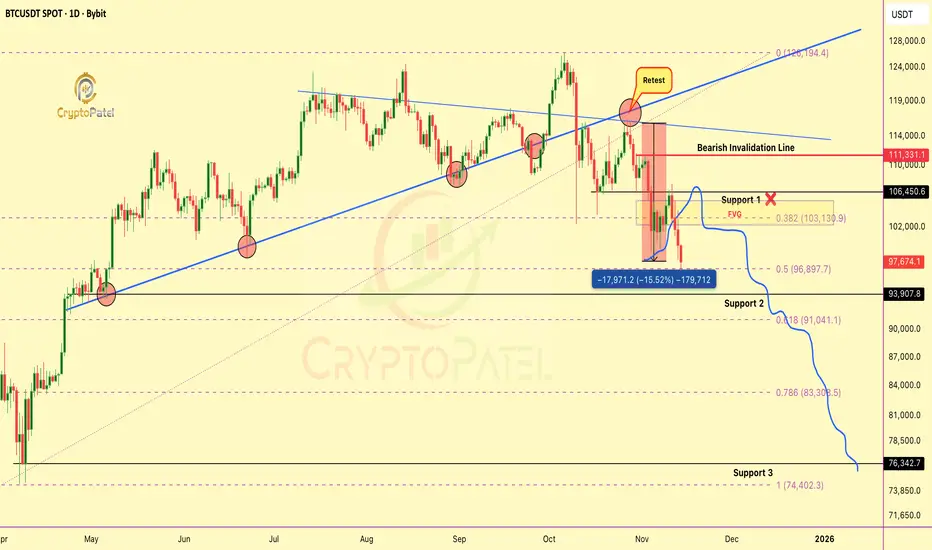
bearish retest I warned on Oct31 played out EXACTLY as projectedThe bearish retest I warned about on Oct 31 played out EXACTLY as projected
I clearly said CRYPTOCAP:BTC would dump again after filling the FVG at $106K–$107K and that’s exactly what happened.
BTC dropped from $107K → $98K (-9%) and from our retest entry, we’re now 15% in profit.
Hope you enjoyed the analysis and booked gains.
Now watch the 0.5–0.618 FIB zone closely.
✔️ If it holds → strong bounce possible
❌ If it fails → BTC could slide below $80K
I’ve been warning about this dump since BTC was above $120K+.
Structure always wins.
NFA & DYOR
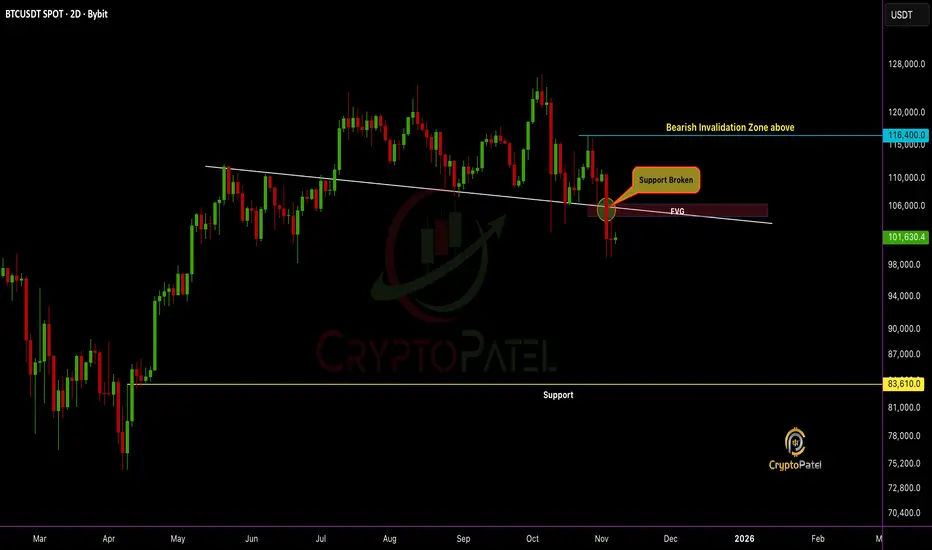
BTC Breakdown Confirmed, Structure Flipped Bearish: Next $88610?BTC Breakdown Confirmed, Structure Flipped Bearish: Next Stop $83,610?
Support is broken and the structure confirms a clear bearish shift.
#Bitcoin failed to reclaim the Fair Value Gap (FVG) zone, turning it into strong resistance.
High chances CRYPTOCAP:BTC could fill the FVG and continue the downside move toward $83,610.
Bulls remain trapped unless price reclaims $116,400, the bearish invalidation zone.
Trend bias remains bearish. Liquidity targets below are in play.
NFa & DYOR
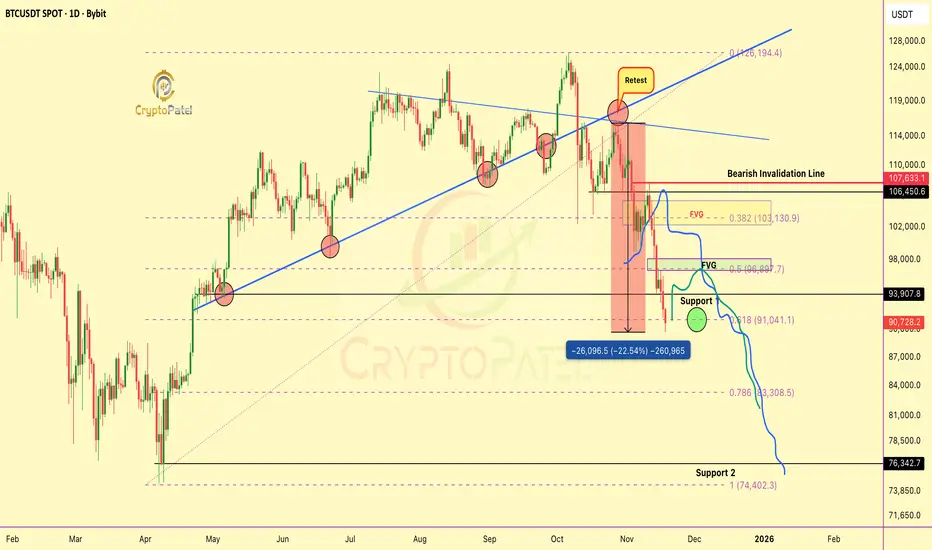
BITCOIN TECH UPDATE: BEARISH DOMINATES MUST READ🚨 BTC TECH UPDATE: BEARISH DOMINATES MUST READ 🚨
CRYPTOCAP:BTC is down 14% from my bearish short at $115,000 retest.
✅ Those who shorted, well played.
✅ Those who avoided longing at the top, capital saved.
Price Action:
#BITCOIN hit 1st support and broke below, trend remains bearish.
Next target: $94,000.
Short-Term Relief:
Expect a bounce toward $105,000–$108,000 (retest + FVG zone) before the next leg down.
Longer-Term:
$94,000 key decision zone → potential drop to $76,000 if bearish momentum continues.
Will update with precision once $94k is reached.
Sentiment: Bearish as forecasted from $115k.
Bullish Trigger:
If BTC breaks $111,500 with HTF candle close, bullish scenario activates → potential ATH toward $150,000.
Trade smart. Watch levels. Manage risk.
Your move: Ride the bearish wave or wait for the relief rally?
NFA & DYOR

the set up im gonna call this episode the set up
check the trendline
check the overbought
the same scenario same as 2021 i still say idk about the alt season maybe i have zero knowledge but slowly slowly gotta get ready for the bears to take over
also calm down we still have new years eve.
P.S: the only play out i gave for the altseason was 2 3 posts before you can check it out on how i think it will be and where will be bitcoin located at , at that time.
stay focused
stay sharp
sina

$LINEA WARNING: Bearish Pressure + Accumulation Opportunity Ahea$LINEA WARNING: Bearish Pressure + Accumulation Opportunity Ahead!
Chart Analysis Recap:
Previous exit signal: $0.025 → #Linea is now ~50% down ✅ confirms chart-based strategy.
Current trend: Super bearish; expecting further downside 20%-40% before the next upward leg.
Long-Term Potential:
@Linea.eth could give 10x returns, targeting $0.1–$0.2, but success depends on smart entry points.
Key Strategy:
Ideal accumulation zone: below $0.01 for long-term holders.
Trade smart, enter on hard dips and manage risk.
Takeaway: Patience + technical discipline = positioning for potential massive upside.
NFa & DYOR

MicroStrategy Broken 55-SMA so Will Bitcoin follow the Same ?NASDAQ:MSTR Crashes Below 55-Week SMA
History shows: MicroStrategy weakness = early CRYPTOCAP:BTC top warning.
▶️ NASDAQ:MSTR bottom?: ~$115
▶️ CRYPTOCAP:BTC possible floor: ~$75K
Bitcoin is still ready for a new crash if it follows NASDAQ:MSTR below its 55-SMA.
BTCUSDT is at a critical point. Watch, learn, and act & Follow for high-value market updates.
NFa & DYOR

EMA Ribbon - Trend Strength & Reversal insight🧭 1. Overview
The EMA Ribbon is a set of multiple Exponential Moving Averages (EMAs) layered together to visualize the trend strength, direction, and possible reversals.
It helps traders identify when the market is trending strongly or losing momentum.
In this chart,
• Yellow lines = Short-term EMAs (react quickly to price)
• White lines = Long-term EMAs (show overall market direction)
When used together, they form a ribbon-like structure that acts as both dynamic support and resistance.
⸻⸻⸻⸻⸻⸻⸻⸻⸻⸻⸻⸻
📊 2. EMA Ribbon on Chart
• When the ribbon expands, it shows trend strength increasing — momentum is strong.
• When the ribbon contracts (becomes narrow), momentum is cooling, often leading to consolidation or reversal.
• The slope and crossover behavior of short and long EMAs reveal bullish or bearish momentum.
⸻⸻⸻⸻⸻⸻⸻⸻⸻⸻⸻⸻
🟢 3. Bullish Momentum
When short-term EMAs (yellow) stay above the long-term EMAs (white):
• EMA ribbon slopes upward → confirms an ongoing uptrend.
• Ribbon acts as a dynamic support zone — price often bounces from it.
• Indicates strong buying pressure and trend continuation.
• The wider the ribbon, the stronger the bullish momentum.
⸻⸻⸻⸻⸻⸻⸻⸻⸻⸻⸻⸻
🔴 4. Bearish Momentum
When short-term EMAs (yellow) fall below long-term EMAs (white):
• EMA ribbon slopes downward → confirms a downtrend.
• Ribbon acts as a dynamic resistance zone — price struggles to break above it.
• Indicates strong selling pressure and bearish control.
• Ribbon expansion during a downtrend suggests momentum strength from sellers
⸻⸻⸻⸻⸻⸻⸻⸻⸻⸻⸻⸻
📘 5. Summary
✅ Bullish Phase: Short EMAs above long EMAs → strong uptrend & support zone.
❌ Bearish Phase: Short EMAs below long EMAs → strong downtrend & resistance zone.
⚙️ Neutral / Reversal Phase: EMAs narrow together → momentum cooling, await breakout.
The EMA Ribbon is not just a visual trend indicator — it’s a dynamic momentum tool that adapts with price, helping traders identify both trend continuation and early reversal signs.
____________________________________________________________
⚠️ Disclaimer
📘 For educational purposes only.
🙅 Not SEBI registered.
❌ Not a buy/sell recommendation.
🧠 Purely a learning resource.
📊 Not Financial Advice.

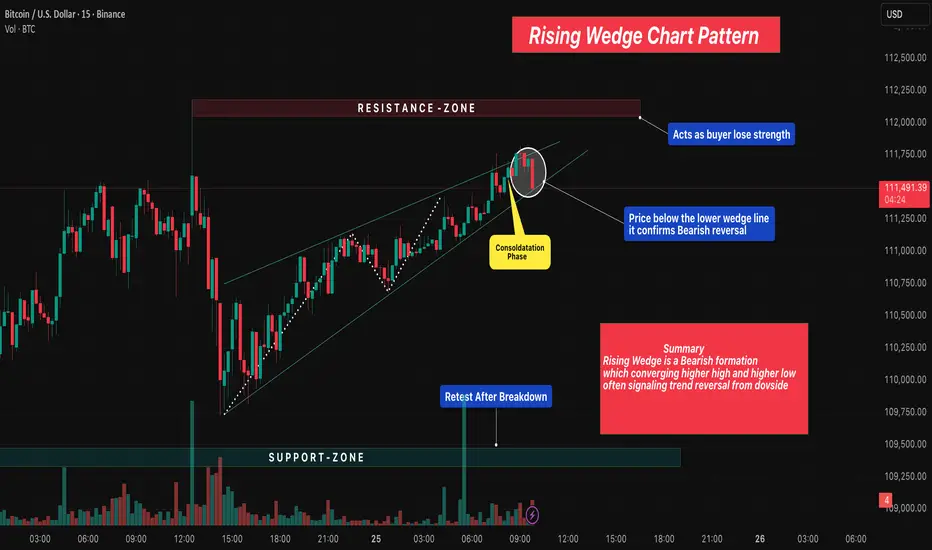
Rising Wedge Chart Pattern 🔎 Overview
The Rising Wedge Pattern is a bearish reversal setup that forms when price moves within a narrowing upward channel — creating higher highs and higher lows that converge toward the top.
It often appears after an uptrend, signaling that bullish momentum is weakening and sellers may soon take control.
As price rises inside the wedge, volume usually decreases, showing fading buyer strength before a potential breakdown .
____________________________________________________________
📔 Concept
• The pattern develops between two converging trendlines sloping upward.
• Each new swing high becomes smaller, showing exhaustion in buyers.
• A break below the lower wedge line confirms the bearish reversal.
• The expected move often equals the height of the wedge projected downward.
____________________________________________________________
📊 Chart Explanation
• Pattern Name → Rising Wedge Chart Pattern
• Resistance Zone → Acts as seller territory where buyers begin losing strength.
• Support Zone → Serves as the final defense; breakdown confirms bearish trend reversal.
• Consolidation Phase → Price compresses within the wedge before breakdown, showing indecision.
• Breakdown Confirmation → When price closes below the lower wedge line, it confirms bearish reversal.
• Retest After Breakdown → Price often retests the wedge from below before continuing downward.
• Summary → Rising Wedge is a bearish pattern of converging higher highs & higher lows, often signaling trend reversal from the upside.
____________________________________________________________
👀 Observation
The Rising Wedge shows weakening bullish pressure as the market climbs with smaller candles and lower volume.
Breakout traders monitor this setup for early reversal opportunities.
The most reliable setups occur near resistance zones or after extended rallies.
____________________________________________________________
💡 Conclusion
A confirmed breakdown below the wedge structure indicates sellers gaining control.
Using proper stop-loss, target projection, and volume confirmation can improve accuracy when trading this reversal formation.
____________________________________________________________
⚠️ Disclaimer
📘 For educational purposes only.
🙅 Not SEBI registered.
❌ Not a buy/sell recommendation.
🧠 Purely a learning resource.
📊 Not Financial Advice.
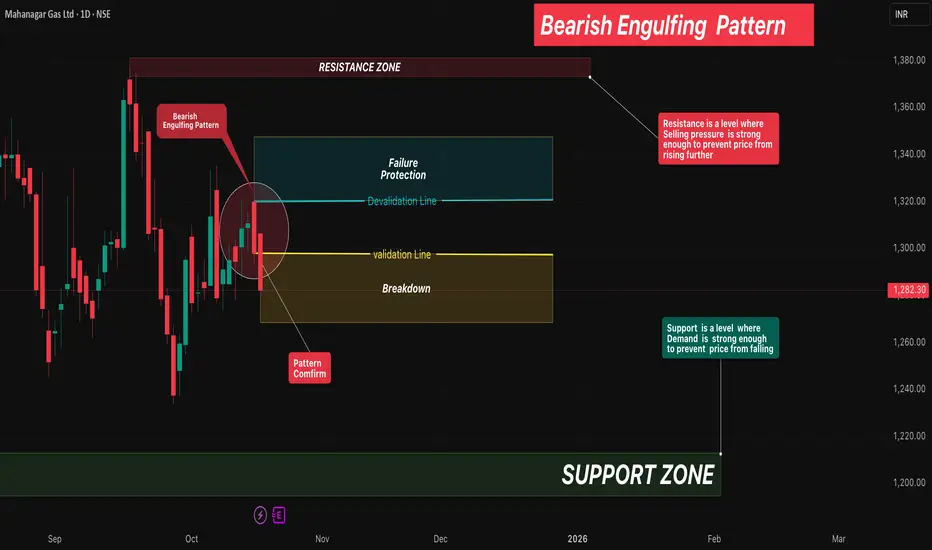
Bearish Engulfing Pattern🔎 Overview
The Bearish Engulfing Pattern is a strong two-candle reversal formation that signals a potential shift from an uptrend to a downtrend.
It occurs when a small bullish (green) candle is immediately followed by a large bearish (red) candle that completely engulfs the prior candle’s body.
This shows a clear shift in market psychology — buyers initially push the price higher, but sellers step in with force and erase those gains, marking the start of bearish momentum.
____________________________________________________________
📔 Concept
A Bearish Engulfing occurs when:
1️⃣ The first candle is a small green candle continuing the uptrend.
2️⃣ The next candle is a large red candle whose body completely engulfs the green candle’s body.
3️⃣ This pattern signals that sellers have regained control after buyer exhaustion.
____________________________________________________________
📌 How to Use
✅ Validation → The candle must close below the open of the red candle to confirm bearish reversal.
❌ Devalidation → If price closes above the close of the red candle before validation, the signal fails.
This structured confirmation helps filter false breakouts and define clear risk levels.
____________________________________________________________
📊 Chart Explanation
• Symbol → NSE:MGL
• Timeframe → 1D
• On 15 Oct 2025 , a small green candle formed, continuing the uptrend.
• On 16 Oct 2025 , a large red candle engulfed the previous green body — confirming the Bearish Engulfing Pattern .
• On 17 Oct 2025 , price broke down further, validating the bearish reversal.
This sequence highlights how quickly market sentiment shifted from bullish to bearish control.
____________________________________________________________
👀 Observation
• The Bearish Engulfing is most reliable near swing highs or resistance zones.
• High volume on the engulfing candle strengthens the reversal signal.
• Combining this pattern with confirmation tools like RSI, Supertrend, or Moving Averages
improves accuracy.
____________________________________________________________
💡 Conclusion
The Bearish Engulfing Pattern marks a clear shift in control from buyers to sellers.
Once validated, it indicates a high-probability reversal setup with defined stop-lose and target zones based on structure or risk-reward multiples.
___________________________________________________________
⚠️ Disclaimer
📘 For educational purposes only.
🙅 Not SEBI registered.
❌ Not a buy/sell recommendation.
🧠 Purely a learning resource.
📊 Not Financial Advice.
Bitcoin LTF Analysis & Market OutlookBitcoin LTF Analysis & Market Outlook
#Bitcoin still doesn’t look strong on LTF, and I’m expecting some more downside movement in the coming days. So if you’re holding high leverage longs, manage them carefully and always use strict stop loss.
Here’s the key structure to watch:
Resistance 1: $116,000
If CRYPTOCAP:BTC fails to break and hold above this level, momentum stays weak and we could revisit the $100,000 zone again.
Resistance 2: $122,500
Only a confirmed breakout above this level can trigger the next leg toward a new ATH around $150,000.
Until then, play defense. Avoid emotional trades, don’t gamble with your hard-earned money, and only take entries backed by clear confluence, strategy, and discipline.
Remember: The market always rewards patience, not greed. Stay alert, follow structure, and let the setup come to you.

NASDAQ 100 : This is going to hurt Chart is self explanatory. Refer to marked S/R Zones
- Divergent RSI
- NNH (Net new highs) dropping fast
- Anticipatory shorts are riskier but can give a great entry.
Stop Loss - 25200 DCB

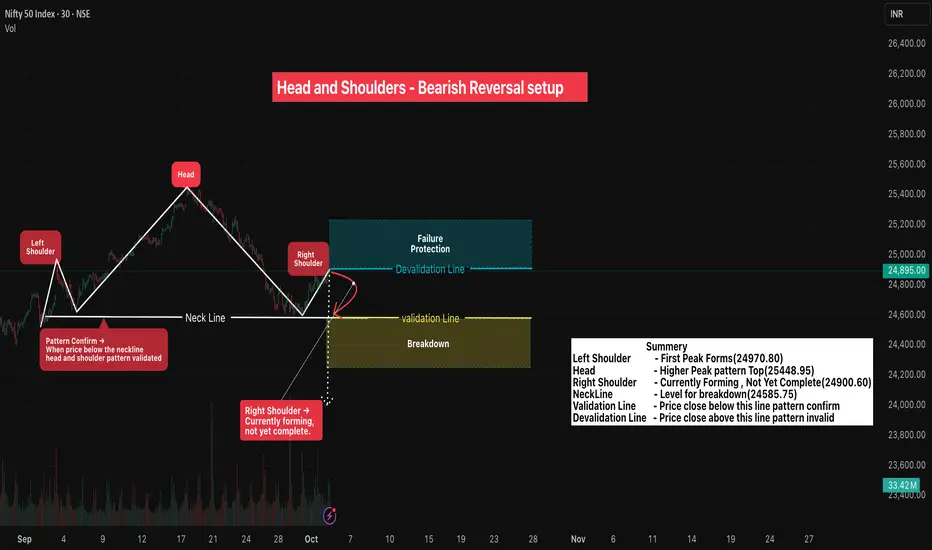
Head and Shoulders - Bearish Reversal Setup🔎Overview
The Head and Shoulders Pattern is a classic bearish reversal formation that signals a potential change in trend from uptrend to downtrend .
It is formed by three peaks:
- Left Shoulder → Price rises, forms a peak, then retraces.
- Head → Price moves higher than the left shoulder, creating the tallest peak, then falls back.
- Right Shoulder → Price rises again but fails to surpass the head, showing loss of momentum.
- Neckline → A line drawn through the two troughs between the shoulders and the head. A breakdown below the neckline confirms bearish sentiment.
This pattern reflects weakening buying pressure and strengthening selling interest, often appearing at the end of strong rallies.
____________________________________________________________
📌 How to Use
• ✅ Pattern Confirmed → When candle closes below the Validation Line
• ❌ Pattern Invalid → If candle closes above the Devalidation Line (Failure Protection).
• Protects against false signals & ensures structured risk management.
____________________________________________________________
📊 Chart Explanation
• Symbol → NSE:NIFTY
• Timeframe → 30m
• Left Shoulder Peak - 24970.30
• Head (Highest Peak) - 25448.95
• Right Shoulder Peak - 24900.80
• Neckline → Drawn by connecting the two troughs between shoulders and head.
• Validation Level → 24,585.75 → Close below = Pattern Confirmed .
• Devalidation Level → 24,910.65 → Close above = Pattern Invalid.
____________________________________________________________
👀 Observations
- The right shoulder often appears weaker, highlighting reduced buyer confidence.
- Once the neckline is tested multiple times, probability of a breakdown increases.
- Volume generally decreases during formation and expands during breakdown, strengthening confirmation.
- This setup helps traders anticipate major reversals rather than chasing late entries.
- Head and Shoulders is widely followed, making it self-fulfilling as many traders act on the same signal.
____________________________________________________________
💡 Why It Matters
Head & Shoulders is one of the most reliable reversal patterns, giving clear validation/devalidation levels for structured risk management. It helps avoid false breakouts and provides traders with predefined stop-loss and target zones.
____________________________________________________________
✅ Conclusion
Breakdown below the Validation Line confirms bearish reversal bias. Combine this with broader market context, volume confirmation, and disciplined position sizing for effective trading decisions.
____________________________________________________________
⚠️ Disclaimer
📘 For educational purposes only.
🙅 Not SEBI registered.
❌ Not a buy/sell recommendation.
🧠 Purely a learning resource.
📊 Not Financial Advice.
Dark Cloud Cover - Bullish Pattern🔎 Intro / Overview
The Dark Cloud Cover is a bearish reversal candlestick pattern that appears after an uptrend .
It forms when a strong bullish candle is followed by a bearish candle that opens above the previous high but closes deep into the prior candle’s body, usually below its midpoint.
This signals that buyers are losing control and sellers are stepping in at the swing high, hinting at a possible reversal.
___________________________________________________________
📌 How to Use
- Step 1: Identify a strong bullish candle.
- Step 2: The next candle must open above the prior high but close below the midpoint → confirmation of bearish pressure.
- Step 3: Must appear at/near a swing high.
- Validation → Candle closes below the validation line.
- Devalidation → Candle closes above the devalidation line before validation.
___________________________________________________________
🎯 Trading Plan
- After pattern confirmation.
- Validation Line → Pattern Low.
- Devalidation Line → Swing High.
- Rule:
• If price closes below the validation line → Price enters Reversal Confirmation Zone .
• If price closes above the devalidation line (before validation) → Price enters Failure Zone .
This protects against false signals and ensures structured risk management.
___________________________________________________________
📊 Chart Explanation
Symbol: NSE:SBIN | Timeframe: 15 min
📌 On 26 Sep · 14:45 , the Dark Cloud Cover pattern was confirmed.
- Validation Level: 854.30 → If price closes below, pattern is validated.
- Devalidation Level: 858.10 → If price closes above (before validation), pattern is invalidated.
___________________________________________________________
👀 Observation
- Most effective after strong uptrends.
- Works best when formed at clear swing highs.
- Validation/Devalidation rules filter false signals.
___________________________________________________________
❗ Why It Matters?
- Provides a clear bearish reversal signal at swing highs.
- Rule-based entry helps traders avoid emotional decisions.
- Enhances discipline by defining zones for confirmation and failure.
___________________________________________________________
🎯 Conclusion
The Dark Cloud Cover Pattern is a reliable bearish reversal tool when combined with validation and devalidation rules.
It helps traders confirm trend reversal at the right spots while protecting against false signals.
🔥 Patterns don’t predict. Rules protect. 🚀
___________________________________________________________
⚠️ Disclaimer
📘 For educational purposes only.
🙅 Not SEBI registered.
❌ Not a buy/sell recommendation.
🧠 Purely a learning resource.
📊 Not Financial Advice.

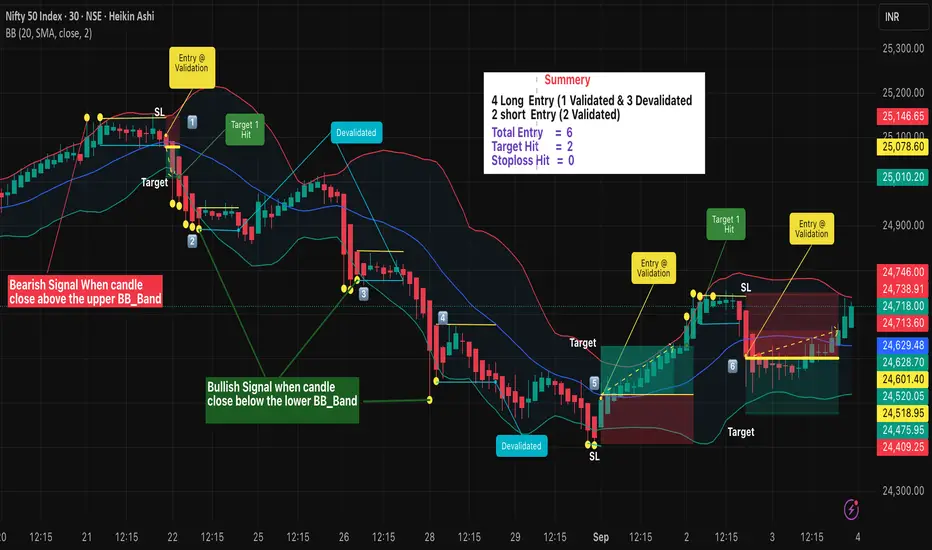
Heikin Ashi with Bollinger Bands – Rule-Based Reversal Strategy🔹 Intro / Overview
The Bollinger Bands are one of the most widely used indicators for identifying overbought and oversold market conditions.
They consist of an upper band, middle band (SMA), and lower band that expand and contract based on volatility.
In this setup, we focus on Bullish and Bearish signals generated when price closes outside the bands.
Heikin Ashi Chart In this idea Apply Boolinger band on Heikinashi chart to capture reversal signals.Heikin Ashi candles help reduce market noise, providing smoother price action and clearer trend signals.
When combined with Bollinger Bands, they offer disciplined entries, defined stop losses, and structured target management.
---
📖 How to Use
🔴 Bearish Signal - Appears after a uptrend
- Trigger → Candle closes above the Upper Band. (Signal candle)
- Candle High = Devalidation line.
- Candle Low = Validation line.
- Entry Confirmed → When price closes below the validation line.
- ❌ No Entry → If price moves above the devalidation line before validation.
🟢 Bullish Signal - Appears after a downtrend
- Trigger → Candle closes below the Lower Band. (Signal candle)
- Candle High = Validation line.
- Candle Low = Devalidation line.
- Entry Confirmed → When price closes above the validation line.
- ❌ No Entry → If price moves below the devalidation line before validation.
- 👉🏼 RESET → if Another New Trigger Comes Before Validation-Devalidation, the system RESET Validation and devalidation line to new values.
---
🎯 Trading Plan
- Entry → On validation close (Bearish: below signal Candle Low, Bullish: signal Candle above High).
- Stop Loss (SL) → Signal candle low for Bullish, signal candle high for Bearish.
- Target → 1R (equal to risk: Entry–SL distance).
- Remaining Lots → Trail with ATR, Fibonacci, Box Trailing, or structure-based stops for extended moves.
---
📊 Chart Explanation
1️⃣ 🛑Bearish Signal →
- Candle validated as price closed below the validation line .
- 🎯 Target 1 achieved, remaining lots managed with trailing methods. Exit may occur at swing bottom with best trailing method.
2️⃣ 🟢 Bullish Signal →
- ❌ Candle Devalidated as price closed below the devalidation line . . no Entry
3️⃣ 🟢Bullish Signal →
- ❌ Candle Devalidated as price closed below the devalidation line . . no Entry
4️⃣ 🟢Bullish Signal →
- ❌ Candle Devalidated as price closed below the devalidation line . . no Entry
5️⃣ 🟢Bullish Signal →
- Candle validated as price closed above the validation line
- 🎯 Target 1 achieved, remaining lots managed with trailing methods. Exit may occur at swing top with best trailing method.
6️⃣ 🛑Bearish Signal →
- Candle validated as price closed below the validation line .
-Still active during trading hours, monitoring continues.
---
👀 Observation
- Bearish signals are more effective during strong uptrends when volatility peaks.
- Bullish signals work best at market bottoms or oversold conditions.
- Early invalidations prevent false entries.
- Trailing stops allow scaling out while capturing bigger moves.
---
❗ Why It Matters?
- Provides rule-based trading using Bollinger Bands, not just blind signals.
- Validation & devalidation ensure disciplined entries.
- Helps traders avoid chasing moves by waiting for confirmation.
- Enhances risk management with clear SL & trailing systems.
---
🎯 Conclusion
The Bollinger Band Strategy offers structured bullish & bearish setups.
By combining validation lines, devalidation rules, and trailing systems, traders can capture high-probability trades while avoiding false signals.
🔥 Patterns don’t predict. Rules protect. 🚀
⚠️ Disclaimer
📘 For educational purposes only · 🙅 Not SEBI registered · ❌ Not a buy/sell recommendation · 🧠 Purely a learning resource · ❌ Not financial advice.
Hammer Candlestick Reversals - Bullish & Bearish Setups🔹 Intro / Overview
In this idea, we focus on the Hammer candlestick pattern — both Bullish and Bearish variations.
The Hammer is a powerful reversal signal formed with a small body, a long shadow, and defined highs/lows.
When combined with EMA High–Low Band Confirmation and swing structure, it creates rule-based trading opportunities with clear validation and devalidation rules.
---
📖 Bullish & Bearish Hammer Intro
🟢 Bullish Hammer → Appears after a downtrend / at swing low . Buyers step in strongly, rejecting lower prices.
- EMA Band should be above the candle.
- Candle High = Validation line.
- Candle Low = Devalidation line.
- Entry → Close above the High.
- Stop-Loss → Candle Low.
- Target → 1x risk, with remaining lots trailed (ATR, Fibonacci, Box Trailing).
🔴 Bearish Hammer → Appears after a uptrend / at swing high . Sellers take control after rejecting higher prices.
- EMA Band should be below the candle.
- Candle Low = Validation line.
- Candle High = Devalidation line.
- Entry → Close below the Low.
- Stop-Loss → Candle High.
- Target → 1x risk, with remaining lots trailed.
---
📌 How to Use
🟢 Bullish Hammer Spotted
- Validation → Close above the Hammer’s high.
- Devalidation → Close below the Hammer’s low. (before validation)
- SL → Hammer Low.
- Target → 1x risk, remaining lots trail with ATR/Fibonacci.
🔴 Bearish Hammer Spotted
- Validation → Close below the Hammer’s low.
- Devalidation → Close above the Hammer’s high. (before validation)
- SL → Hammer High.
- Target → 1x risk, remaining lots trail with ATR/Fibonacci.
---
🎯 Trading Plan
- Entry → On validation close (Bullish above High, Bearish below Low).
- Stop Loss → Defined by Hammer candle (Low for Bullish, High for Bearish).
- Target → First TP = 1R, Remaining lots trailed for extended moves.
---
📊 Chart Explanation
1️⃣ 🟢 Bullish Hammer Spotted
- Candle validated as price closed above the high.
- 🎯 Target 1 achieved, remaining lots managed with trailing methods. Trailing Exit could be at swing top with best trailing
2️⃣ 🛑 Bearish Hammer →
- Candle validated as price closed below the low.
- 🎯 Target 1 achieved, remaining lots managed with trailing methods. Trailing Exit could be at swing bottom with best trailing
3️⃣ 🛑 Bearish Hammer →
- ❌ Devalidated
- Candle devalidated as price closed above the high.
4️⃣ 🛑 Bearish Hammer →
-Candle validated as price closed below the low.
⛔ Stop-Loss hit
- stop loss ensures risk management and discipline in trading.
5️⃣ 🛑Bearish Hammer →
-Candle validated as price closed above the low.
- 🎯 Target 1 achieved, remaining lots managed with trailing methods. Trailing Exit could be at swing bottom with best trailing
---
👀 Observation
- Bullish Hammer → Works best after prolonged downtrend at support zones.
- Bearish Hammer → Stronger after extended uptrends or near resistance zones.
- EMA Band → Confirms market bias and filters false signals.
- Risk Management → Defined SL + structured TP protect capital and maximize reward.
---
❗ Why It Matters?
- Clear rules: Validation, Devalidation, Entry, SL, and TP.
- Combines price action (Hammer) with EMA Band confirmation.
- Ensures disciplined trading instead of emotional decisions.
- Allows both conservative and aggressive management via trailing.
---
🎯 Conclusion
The Bullish & Bearish Hammer patterns, when combined with EMA High–Low Band confirmation, provide a structured reversal trading strategy.
By following strict entry, SL, and TP rules, traders can filter false setups and capture strong reversals at swing highs and lows.
🔥 Patterns don’t predict. Rules protect. 🚀
---
⚠️ Disclaimer
For educational purposes only · Not SEBI registered · Not a buy/sell recommendation · Not financial advice — purely a learning resource.

Bearish Hammer with EMA High-Low Band - Rule Based Entry 🔹 Intro / Overview
The Bearish Hammer candlestick is a signal of potential downside reversal.
It forms when buyers push price higher, but sellers regain control and close the candle near its low.
When combined with EMA High–Low Band confirmation, it creates a disciplined setup to identify short trade opportunities with clear rules.
---
📖 How to Use
✅ Validation → A valid signal occurs when the close price is below the low of the Bearish Hammer.
❌ Invalidation → If the close price crosses above the high of the Bearish Hammer, the signal is invalid. (Before validation )
EMA Band Confirmation:
- The Bearish Hammer must be above the EMA High–Low Band.
- The EMA High-Low band should not touch the Bearish Hammer.
- This ensures the setup aligns with bearish conditions.
✅ Bearish Hammar High must be swing high
---
🎯 Trading Plan
Entry → Enter short when the close price is below the Hammer’s low (validation line).
Stop-Loss (SL) → The high of the Bearish Hammer candle(Swing High)
Target (TP):
- First Target → 1R (equal to the risk defined by Entry–SL distance).
- Remaining Lots → Trail using ATR, Fibonacci levels, Box Trailing, or structure-based stops.
---
📊 Chart Explanation
- The Bearish Hammer shows rejection of higher prices, with a small body near the low and a long upper shadow.
- The EMA High–Low Band sits below the candle, and the Hammer forms above the band (no touch), confirming the setup.
- Validation occurs when the next close is below the Hammer’s low.
- Invalidation occurs if price closes above the Hammer’s high(before Validation)
---
👀 Observation
Bearish Hammer Behavior → Most effective after an uptrend or at resistance zones.
EMA Role → Ensures trade alignment with broader market bias.
Risk Management → SL above Hammer high, TP at least 1:1, with trailing options for extended downside moves.
---
❗ Why It Matters?
- Shows buyers losing strength.
- Sellers step back in and dominate.
- EMA Band ensures cleaner filtering of weak signals.
- Provides a strict framework for entry, SL, and targets.
---
🎯 Conclusion
The Bearish Hammer, combined with EMA High–Low Band confirmation, creates a structured short setup.
Using strict validation, devalidation, and risk management, traders can filter false signals and ride potential bearish moves with confidence.
🔥 Patterns don’t predict. Rules protect.
---
⚠️ Disclaimer
For educational purposes only · Not SEBI registered · Not a buy/sell recommendation · Not financial advice — purely a learning resource.

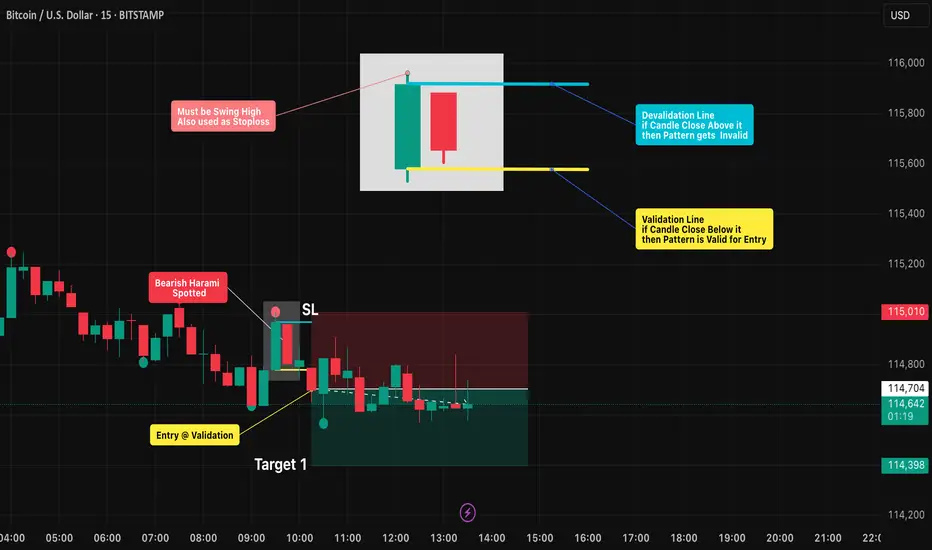
Bearish Harami Pattern: Spotting Reversals with Discipline🔻Bearish Harami Pattern: Spotting Reversals with Discipline
Intro / Overview
The Bearish Harami is a candlestick reversal pattern that often appears at the end of an uptrend.
It signals a possible shift where bullish momentum weakens and sellers begin to step in.
The first candle’s high must be a swing high , and this level can also be used as a stop-loss reference.
To trade it effectively, spotting the formation is not enough — strict validation and invalidation rules are key to avoid false signals.
✨ Concept
A Bearish Harami is a two-candle pattern:
- First candle (Green🟢): A strong bullish candle showing buyer dominance.(Swing high)
- Second candle (Red🔴): A smaller bearish candle whose body is fully inside the prior green candle’s body (wicks ideally inside).
This forms the “harami” structure, where the red candle looks like it is “inside the green candle,” suggesting a pause in bullish pressure and potential reversal.
📖 How to Use
1️⃣ Identify the pattern: Look for a large green candle followed by a smaller red candle contained within it.
2️⃣ Validation Point: The setup is validated if price closes below the open of the green candle within the next few candles.
3️⃣ Invalidation Point: The setup is invalidated if price closes above the close of the green candle before validation occurs.
4️⃣ Stop-Loss & Targets:
- Stop-loss (SL): Place at or just above the swing high (first green candle high).
- Target (TP): 1x, 2x, or more times the distance between entry and stoploss.
5️⃣ Enhance Reliability: Combine with resistance levels, trendlines, moving averages, or other candlestick signals to filter out weak setups.
📊 Chart Explanation – Step by Step
✔ The Bearish Harami pattern was spotted after a clear uptrend.
✔ The following candle closed below the green candle’s open → Validation confirmed ✅.
✔ A short entry was taken on the same candle.
✔ A Bearish Harami pattern has also been drawn and highlighted on the chart.
🔍 Observation
- If Target 1 is achieved → book 2 lots , and trail the remaining position with a stop-loss.
- Harami is only a potential reversal → confirmation is necessary.
- Breakdown below the green candle’s open = sellers in control 🔻.
- Breakout above the green candle’s close = setup failure ❌.
- Patience is key — wait for confirmation before entering.
📌 Why It Matters?
The Bearish Harami helps traders by:
- Reducing false reversal trades with strict rules.
- Providing clear entry/exit levels with discipline.
- Enforcing risk management via pre-defined SL & TP.
✅ Conclusion
The Bearish Harami becomes powerful when traded with discipline.
By marking the open and close of the green candle, traders can clearly separate a valid short trade from a failed setup.
With a stop-loss at the swing high and take-profits at 1x, 2x, or more, while trailing further lots, the Harami offers a structured, rule-based strategy.
⚠️ Always remember: the pattern shows possibility → price confirmation makes it probability .
⚠️ Disclaimer
For educational purposes only · Not SEBI registered · Not a buy/sell recommendation · No investment advice — purely a learning resource
CocaColaDid the big hand selling the coca-cola stock at this point of time.
Though it's very difficult to identify the next move however this is just a try to find the distribution in price

M_M C Wave CorrectionTriple Bearish Divergences
Elliot Impulse completed (1-2-3-4-5 Complete)
Elliot Correction In Progres (A Complete, B Complete, C may start).

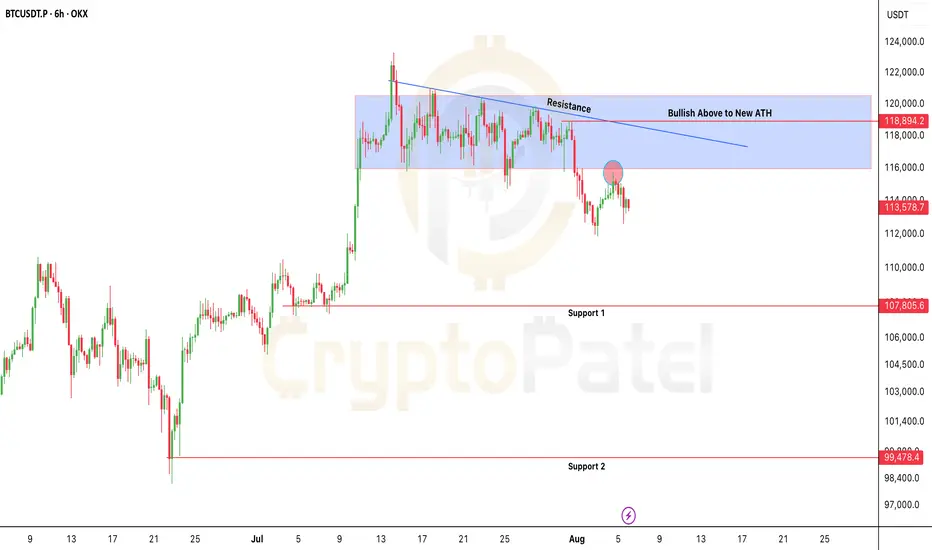
Bitcoin at Risk: $115.7K Is the Line Between Bounce or BreakdownBitcoin at Risk: $115.7K Is the Line Between Bounce or Breakdown
CRYPTOCAP:BTC is trading below key resistance ($115.7K–$118.9K) and rejected cleanly at the trendline.
As long as price holds below $115,700, bearish bias remains.
⚠️ Failure to reclaim = high risk of breakdown toward $107K and even sub-$100K levels.
Bearish invalidation only above $119K
NFA & DYOR
Urgent Bitcoin Update: BTC Must Hold $110K🚨 Urgent Bitcoin Update: BTC Must Hold $110K – Or Risk Dropping Below $100K
BTC is trading near $113,900, sitting right on key support at $112K–$110K.
This zone is crucial- Holding it could lead to a rally toward $150K ATH.
But if BTC breaks below $110K, expect downside pressure with possible moves to: $100K / $93K / $83K
Price has also broken below the ascending trendline- a bearish sign unless bulls step in.
I mentioned exiting around $122K–$123K: Hope you booked profits ✅
Now, just observe how BTC reacts between $110K–$112K.
Note: NFA & DYOR
