SUBEXLTDthis was overbought in until Jul 2021
and since then it has been cooling down itself. Don't rush to buy. let it settle down and spend some time in oversold zone.
Bearish Patterns

BNB SHORTTIME TRADEhere bnb can have a bearish or bullish move according to the 4 hr timeframe as i see blue line is daily DAY
and green line is HOUR trendline bnb broke day trend line as i have posted already i have a short trade on bnb
and i also look for short time trade so i took this trade if bnb has a bearish candle in hr tend line it has a bear move
and break the trend line with bull candle has a bullish move
stay tuned to get more trade ideas

Nifty Analysis | Trade PlanAs per current market sentiments and global news we can see bearish momentum in Nifty 50 in upcoming days. Technically also the Index is forming descending triangle pattern taking support at 16900 -800 zone and once this support breaks than we can see Nifty to 17600 levels. Now talking about the levels plotted on chart we can plan out trade based on these area, the beaeish breakout level is crucial to watch out for but If it gets broken then we can see T1 & T2 as per our study, however the only level for bullish reversal is also marked on 17000 area which is also a psychological support. Bottom line is there's more downside than upside in the market for upcoming days.


ICICIGI POTENTIAL SELLINGNSE:ICICIGI
as ICICIGI is in down tread from some time it could continue if its break 1275 level and start trading below it .
Disclaimer: Any information shared would be only for educational purpose...
I am not a sebi registered analyst. This channel is for only educational purpose. Any profit/loss, i am not responsible. Before taking any trade please consult your financial advisors. Thanks

BITCOIN ready for a 'METEORITE FALL' !!!!For the first time BITCOIN had shown a negative MACD histogram on monthly charts be cautious,
also Double Top is clearly visible and RSI has also shown breakdown below 60 making its chart the dangerous one.

Ethereum a Falling Comet !!!!1 week earlier also I have mentioned this idea and it fell 220+ points more than 7%,
again I am warning Ethereum could really be a falling comet, be cautious.
Huge rounding top is clearly visible in its weekly charts.

Gold in Position to Accelerate Over $1899.80Bearish Scenario
A sustained move under $1899.80 will signal the presence of sellers. This could trigger a late session pullback into $1861.60, but not necessarily lead to a change in the main trend.

Nifty-50 │ 15-02-2022Nifty-50 Is on Bearish Trend
Date:- 15-02-2022
Movement :- Bearish
Nifty-50 Movement :- ( 120 ~ Points ) Negative Closing
TIME CONSTANT LEVELS ATTENDANCE ( T.C.A ) :- 16726 ±
Nifty50 │ Post-Marketing │ Market Give Closing at :- Updates Will come on Live Market
STOP-LOSS :- Uses Your Own Stop-Loss
Quantum Physics Researcher :- Jeevan Singh
T.C.A Created Using With HPC ( High performance Computing )
Guys This is R&D ( Research And Development ) Purpose Only.
I am Not Responsible If your Stop-Loss Hit And! I am Also Not Responsible If Regulator Call Me Manipulator.
Thank You For Making Trust And Don't Forget To Support Me!

INTRADAY FOR 15 FEB.As our monday prediction , banknifty fall round 1600 points.
here is some prediction for 15feb.
Banknifty Intraday -
BUY ABOVE 37100
SELL BELOW 36750
TARGET FOR SHORT 36600 , 36500 , 36300
OPTION TRADING IS SUBJECTED TO FINANCIAL RISK, ENTER WITH YOUR OWN RISK.

Nifty-50 │ 14-02-2022Nifty-50 Is on Bullish Trend
Date:- 14-02-2022
Movement :- Bearish To Bullish
Nifty-50 Movement :- ( 216 ~ Points ) Sideways Positive Closing
TIME CONSTANT LEVELS ATTENDANCE ( T.C.A ) :- 17269 ±
Pre-Market :- 17159
Nifty50 │ Post-Marketing │ Market Give Closing at :- Sideways ±
Nifty-50 │ Final Closing 3:32 ( PM ) Updated on Live Market
STOP-LOSS :- Uses Your Own Stop-Loss
Quantum Physics Researcher :- Jeevan Singh
T.C.A Created Using With HPC ( High performance Computing )
Guys This is R&D ( Research And Development ) Purpose Only.
I am Not Responsible If your Stop-Loss Hit And! I am Also Not Responsible If Regulator Call Me Manipulator.
Thank You For Making Trust And Don't Forget To Support Me!

On daily chart May be on Monday Bank nifty will show Bear Trend.
For intraday on monday
ENTER ABOVE 38600
SHIORT BELOW 38400
check chart for proper details on 1D for Swing & 5min. for Intraday.

Nifty likely to form the Head and Shoulder on daily chart
Nifty seems to be bearish as the inflation and US-Russia tension could go crazy.
Head and shoulder formation on daily chart is likely to form which suggest major correction ahead.
As long as 17640 Level do not breach on upside nifty likely to remain in the bearish mode.
See the levels drawn on the chart.

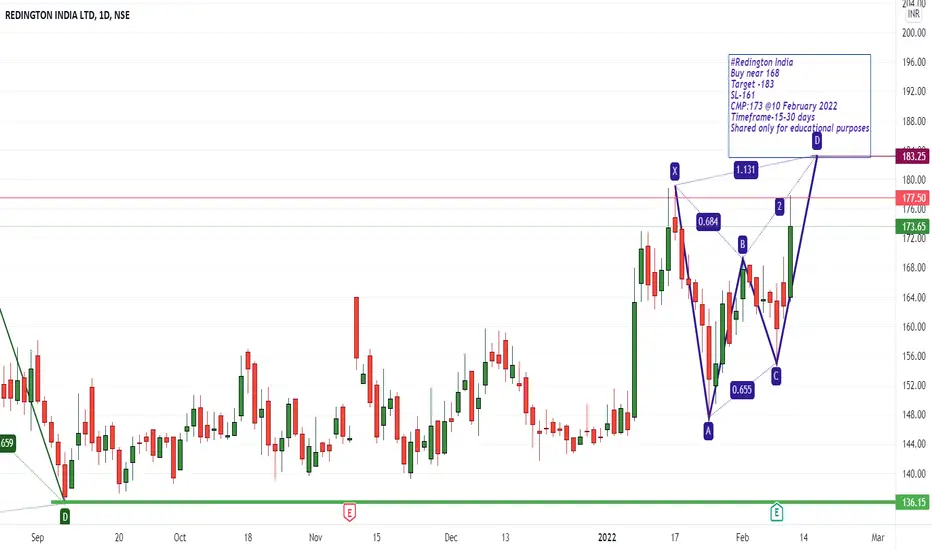
#Redington India#Redington India
Buy near 168
Target -183
SL-161
CMP:173 @10 February 2022
Timeframe-15-30 days
Shared only for educational purposes
Nifty-50 │ 10-02-2022Nifty-50 Is on Bullish Trend
Date:- 10-02-2022
Bearish :- Short-Selling
Nifty-50 Movement :- ( 125 ~ ) Point ( Negative Closing )
TIME CONSTANT LEVELS ATTENDANCE ( T.C.A ) :- 17338 ±
POST-MARKET :- ( Updates will be updated on LIVE Market )
If I Am Right Then │ Nifty-50 │ Final Closing 3:32 ( PM ) Updated on Live Market
STOP-LOSS :- Uses Your Own Stop-Loss
Quantum Physics Researcher :- Jeevan Singh
T.C.A Created Using With HPC ( High performance Computing )
Guys This is R&D ( Research And Development ) Purpose Only.
I am Not Responsible If your Stop-Loss Hit And! I am Also Not Responsible If Regulator Call Me Manipulator.
Thank You For Making Trust And Don't Forget To Support Me!


#Indigo worked perfectly#Indigo near to profit booking zone
Target -2310
CMP:1862.60 @27 January 2022

NykaaNykaa has been into parallel channel since nov 2021 and now it has formed big supply zone for bulls. this has became bearish for near term

Nifty-50 │ 08-02-2022Nifty-50 Is on Bearish Trend
Date:- 08-02-2022
Bearish :- Short-Selling
Nifty-50 Movement :- ( 260 ~ ) Point ( Negative Closing )
TIME CONSTANT LEVELS ATTENDANCE ( T.C.A ) :- 17123 ±
If I Am Right Then │ Nifty-50 │ Final Closing 3:32 ( PM ) is Sideways.
I will Update ( Nifty-50 ) Closing On ( Live Market )
STOP-LOSS :- Uses Your Own Stop-Loss
Quantum Physics Researcher :- Jeevan Singh
T.C.A Created Using With HPC ( High performance Computing )
Guys This is R&D ( Research And Development ) Purpose Only.
I am Not Responsible If your Stop-Loss Hit And! I am Also Not Responsible If Regulator Call Me Manipulator.
Thank You For Making Trust And Don't Forget To Support Me!

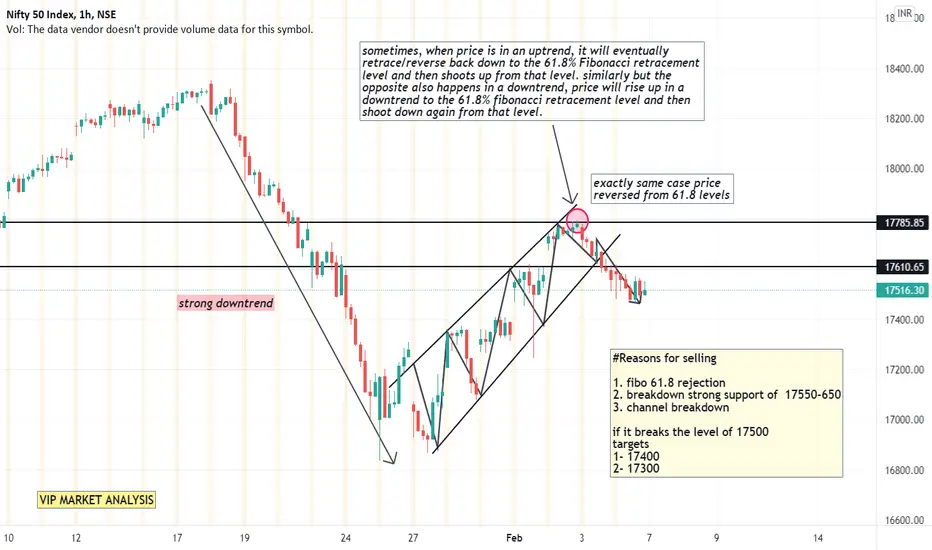
NIFTY BEARISH VIEWi think market are weak nifty also looking weak once it breaks the level of 17500 it will fall fast up to 17400
this analysis is only for educational purpose do your own analysis
Indiabulls Housing Financecan they refocus only on generating economic profit
there has been a management change
look at the chart for more details

Banknifty bearish viewbanknifty is looing bearish and i am short on banknifty this is for educational purpose only do your own research

ETHUSDT bearish leg completion.Here's an idea how it might play out on ETHUSDT.
I fell it is bearish. Let me know your views in comments.
