Bearish Engulfing Pattern: Spotting Reversals with Discipline🔎 Intro / Overview
Managing a trade after entry is just as important as finding the right setup. The Bearish Engulfing is one of the most reliable candlestick patterns to spot potential reversals. When traded with discipline, it helps you recognize momentum shifts early and manage risk objectively.
📔 Concept
A Bearish Engulfing occurs when:
The first candle is a small green candle that continues the uptrend.
The next candle is a large red candle whose body completely engulfs the green candle’s body .
👉 This shows a clear psychological shift — buyers push higher (green candle), but sellers step in aggressively (red candle) and erase those gains.
📌 How to Use
✅ Validation → The candle must close below the open of the red candle.
❌ Invalidation → If price closes above the close of the red candle before confirmation.
Trading Plan:
Entry → After confirmation of the red candle’s close.
Stop-Loss (SL) → Above the high of the red candle which is also a swing high.
Take-Profit (TP) :
Conservative → 1R (Entry → SL distance)
Moderate → 2R
Aggressive → Book partial at 1R and trail the rest using tools like ATR, Fibonacci levels, or structure-based stops to ride any extended downside move.
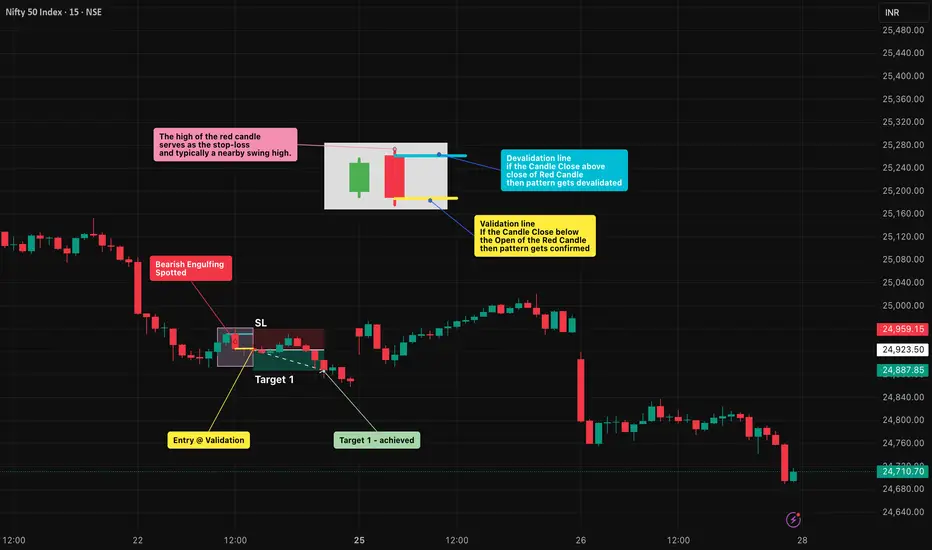
📊 Chart Explanation
On the chart, the first small green candle represents buyers continuing the uptrend. The next large red candle completely engulfs the green candle’s body and closes lower, signaling that sellers have taken control.
The pattern was validated at the close of the red candle , where the short entry was taken. The high of the red candle is used as the stop-loss level, while the targets are mirrored in reverse using the same distance.
In this example, Target 1 was quickly achieved . From there, traders can apply trailing stop methods to lock in profits and manage further downside targets.
👀 Observation
Works best when the pattern forms at major resistance levels or after a sustained uptrend .
A high-volume red candle strengthens the reliability of the signal.
In sideways or choppy conditions , false signals are common — always confirm with structure and indicators before acting.
❗ Why It Matters?
The green candle shows buyer optimism .
The red candle shows seller dominance .
This clear flip in control creates a rule-based setup with defined entry, SL, and TP.
🎯 Conclusion
The Bearish Engulfing is a strong sign of reversal — but it’s powerful only when combined with structure, confirmation, and disciplined risk management.
🔥 Patterns don’t predict. Rules protect.
⚠️ Disclaimer
For educational purposes only · Not SEBI registered · Not a buy/sell recommendation · No investment advice — purely a learning resource
Bearishpattern
Mastering Trade Setup with simplicity of dow theorySimplifying Trade Strategies with Dow Theory Wisdom
Welcome to the world of trading, where the Dow Theory can be your trusty guide. Let's break down an easy trade strategy that suits different market situations.
Dow Theory Insights
Dow Theory, a key tool in technical analysis, says understanding trends is crucial. Figuring out the trend is where we start, setting the stage for smart trade decisions.
Bullish View
If we're feeling positive
Higher Lows: Check if prices keep going up.
Near Support: Make sure prices are close to a support zone.
Reversal Signs: Look for any candle patterns signaling a turnaround.
Buying Setup:
Stoploss: Think of it like a safety net, set it at the recent lowest point.
Execute a buy trade when these factors line up, always keeping an eye on that stoploss.
Bearish View
If we're feeling negative
Lower Highs: Check if prices keep going down.
Near Resistance: Make sure prices are close to a resistance zone.
Reversal Hints: Look for any candle patterns signaling a potential shift.
Selling Setup:
Stoploss: Your safety measure, set it at the recent highest point.
Execute a sell trade when these conditions come together, always mindful of that stoploss.
Sideways View
For a market that's just hanging out
Draw Lines: Sketch lines above and below the current prices (Support and Resistence Trendlines)
Be Patient: Hang tight until prices break above or below those lines.
Only jump into a trade when the market decides where it's going.
In the lively world of trading, Dow Theory keeps us wise. By using these strategies, along with clever stoploss placements, you can navigate the markets with ease
This post is for educational purposes only. Trading involves risk, and past performance is not indicative of future results. Always do your research and consider consulting a financial advisor before making any investment decisions. I am not sebi registered analyst. My studies are for educational purpose only. Please Consult your financial advisor before trading or investing. I am not responsible for any kinds of your profits and your losses.
Most investors treat trading as a hobby because they have a full-time job doing something else.
However, If you treat trading like a business, it will pay you like a business.
If you treat like a hobby, hobbies don't pay, they cost you...!
Hope this post is helpful to community
Thanks
RK💕
Disclaimer and Risk Warning.
The analysis and discussion provided on in.tradingview.com is intended for educational purposes only and should not be relied upon for trading decisions. RK_Charts is not an investment adviser and the information provided here should not be taken as professional investment advice. Before buying or selling any investments, securities, or precious metals, it is recommended that you conduct your own due diligence. RK_Charts does not share in your profits and will not take responsibility for any losses you may incur. So Please Consult your financial advisor before trading or investing.

The Rising Wedge PatternA rising wedge is a bearish pattern when it appears at the top of a mature uptrend. It signifies that a potential top might be in the offing. The duration (short/medium/long term) of the top depends upon the timeframe on which it appears.
Preconditions
------------------
> A strong mature (multi-day/week)trend in the background
> Wave HH1 to be extremely smaller than H
> HH2 should be smaller than HH1
> HH-HL structure results into a rising wedge or arrowhead
> It should appear at the potential top of a rally
> Wave LL has to be snappier/abrupt/faster than wave HL & L
Volume characteristics
----------------------------
> The volume in HH1 is generally less than volume in wave H
> Volume in HH2 is less than volume in HH1
> Volume in wave LL should be higher than volume in wave HL and L
Confirmation
-----------------
> Wave LL breaks the low of wave HL
Psychology
--------------
> Weak character of waves HH1 & HH2 with shortening of length and lesser volume means buyers are not interested at these levels
> Breakout buyers trapped above H and HH1
> Sharp wave LL with increasing volume suggest that sellers are taking over and a potential medium to long term top may be in place
Trading
---------
> Book profits full/partial, in any long position, at the break of HL
> Risk takers short at the break of HL but risk in may be large as stop loss (above HH2) could be wide
> Other may wait for a pullback on the upside (after break of HL); price often reverts back to average prices where short position can be taken
> Always try to minimize risk, either by reducing position size or otherwise
Do not forget to like/comment/share for more updates in future.
Thanks for reading
