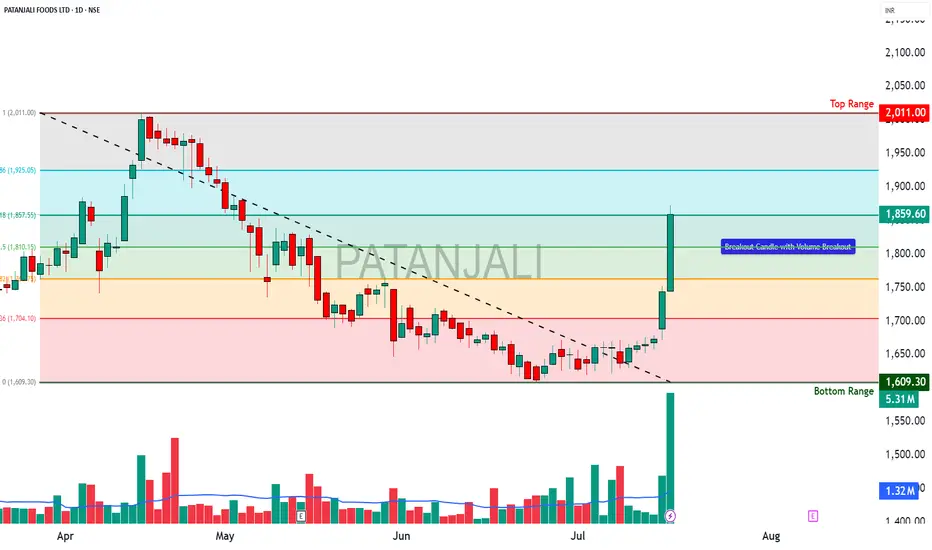
PATANJALI - OPTIONS TRADE SETUPPATANJALI OPTIONS TRADE SETUP – 17 JULY
Spot: ₹1859.6
Trend: Bullish
Volatility: Moderate IV rise (38–41%)
Lot Size: 300
________________________________________
1. Bullish Trade (Naked options as per trend)
Best CE: Buy 1860 CE @ ₹59.45
Why: Strong continuation signal with rising OI and price, heavy volume, and ideal gamma/vega mix for price moves.
________________________________________
2. Contrarian Trade (Naked options against trend)
Best PE: Buy 1800 PE @ ₹31.3
Why: Defensive Put play with unusually high activity and rising IV → could work as hedge if breakdown begins below ₹1840.
________________________________________
3. Strategy Trade (As per trend + OI data)
Strategy: Bull Call Spread → Buy 1860 CE / Sell 1920 CE
Net Debit: ₹59.45 - ₹35.5 = ₹23.95
Max Profit: ₹60 - ₹23.95 = ₹36.05
Max Loss: ₹23.95
Risk:Reward ≈ 1:1.5
Lot Size: 300
Total Risk: ₹7,185
Max Profit: ₹10,815
Why:
• Massive Long Buildup in CE chain (1820 to 1960), with 1860 CE leading in volume and OI surge
• 1860–1920 spread captures ideal move zone before resistance at 1960
• IVs rising moderately → favors debit spread entry
• PE chain showing Short Buildup, especially at 1800/1840/1880 → downside bets getting squeezed
• Balanced risk with great R:R (1:1.5) near breakout zone — clean bullish continuation setup
________________________________________
📘 My Trading Setup Rules
Avoid Gap Plays
→ Check pre-open price action to avoid trades influenced by gap-ups/gap-downs.
Breakout Entry Only
→ Enter trades only if price breaks previous day’s High (for bullish trades) or Low (for bearish trades).
Watch Volume for Confirmation
→ Monitor volume closely. No volume = No trade.
Enter on Strong Candle + Volume
→ Execute the trade only if a strong candle appears with increasing volume in the direction of the trade.
Defined Risk:Reward Only
→ Take trades only if R:R is favorable (ideally ≥ 1:2).
Premium Disclaimer
→ Option premiums shown are based on EOD prices — real-time premiums may vary during execution.
Time Frame Preference
→ Trade with your preferred time frame — this strategy works across intraday or positional setups.
________________________________________
⚠ Disclaimer (Please Read):
• These Trades are shared for educational purposes only and is not investment advice.
• I am not a SEBI-registered advisor.
• The information provided here is based on personal market observation.
• No buy/sell recommendations are being made.
• Please do your own research or consult a registered financial advisor before making any trading decisions.
• Trading involves risk. Always use proper risk management.
I am not responsible for trading decisions based on this post.
________________________________________
Beginnertrading
Maruti - Strong Option Chain Signals for Potential Trade Setups________________________________________________________________________________
MARUTI
Bias: Bullish Bias
Strong Long Build-Up across Call strikes (12700–13500)
Simultaneous Short Build-Up on Puts — classic bullish confirmation
________________________________________________________________________________
Best CE:
Strike: 12800
LTP: ₹138.3
OI: 5,14,100 (+78,350 | +17.98%)
Volume: 17,570
Build-Up: Long Build-Up
Interpretation: High OI addition + price rise = active bullish bets at 12800
________________________________________________________________________________
Best PE:
Strike: 12600
LTP: ₹159
OI: 1,05,700 (+76,600 | +263.23%)
Volume: 10,114
Build-Up: Short Build-Up
Interpretation: Strong put writing at 12600 suggests immediate support here
________________________________________________________________________________
Best Strategy:
Bull Call Spread or Naked Call Buy
(Buy 12800 CE, Sell 13200 or 13500 CE for risk-defined play)
- Directional bullish play
- Room to run till 13200–13500 zone based on fresh CE buildup
- Ideal if Spot sustains above 12600
________________________________________________________________________________
Why:
- Long Build-Up seen from 12700 CE to 13500 CE
- Spot = ₹12650, and 12600 PE has heavy Put writing → firm base
- Call Short Covering seen at 12500, 12600 → unwinding resistance
- IVs are rising on PEs, falling on CEs → supports bullish sentiment
- 12800 CE has highest Long Build-Up + Volume → key upside breakout strike
- Above 12800, next resistance zones visible around 13200–13500 based on CE action
________________________________________________________________________________
⚠️ Disclaimer (Please Read):
• This chart is shared for educational purposes only and is not investment advice.
• I am not a SEBI-registered advisor.
• The information provided here is based on personal market observation.
• No buy/sell recommendations are being made.
• Please do your own research or consult a registered financial advisor before making any trading decisions.
• Trading involves risk. Always use proper risk management.
________________________________________________________________________________
💬 Found this helpful?
Drop your thoughts or questions in the comments below ⬇️
🔁 Share this post with your trading community.
✅ Follow simpletradewithpatience for price-action backed technical setups.
🚀 Let’s trade with patience, logic, and clarity!
Be Self-Reliant | Trade with Patience | Learn with Logic
DMART – Earnings Incoming________________________________________________________________________________📈 DMART – Earnings Incoming: What’s the Right Time to Enter an Options Trade?
📆 Result Date: 11th July 2025 (Friday)
🕒 Strategy Style: Beginner + STWP HNI Learning Setup
🔍 For Educational Purposes Only
________________________________________________________________________________
🧠 What's the Setup?
DMART is announcing results on Friday, 11th July. We’re expecting a strong move — either up or down — because of mixed expectations around revenue and margins.
When you trade options around results, timing your entry is just as important as selecting the right strikes.
Let’s simplify it ⬇️ ________________________________________________________________________________✅ Option 1: Enter on 10th July (Thursday, After 2 PM)
💡 This is the ideal time for most traders.
🟢 Better option prices (not too inflated yet)
🟢 Good liquidity for smooth entry
🟢 Gives you overnight time to plan
🟢 You avoid the Friday panic crowd
🎯 STWP Suggested Strategy:
Buy 4300 CE + 4100 PE = ~₹180 total premium
This is called a Long Strangle – You win if the stock moves sharply up or down after results.
________________________________________________________________________________⚠️ Option 2: Enter on 11th July (Friday, Before 2 PM)
🔸 You might think, "Let me wait till Friday to get more clarity" — but there’s a catch:
❌ Option prices become expensive (high IV)
❌ Bid-ask spreads get wide (hard to enter)
❌ No time to react if results come intraday
❌ You’re stuck with weekend gap risk without prep
Unless you're experienced or scalping early, it’s not ideal for beginners.
________________________________________________________________________________🎯 Best Timing Rule – STWP Style:
📌 Enter on 10th July between 2:00 PM – 3:15 PM
Why?
You’ll lock in a clean setup with decent pricing and avoid stress.
📆 Exit Plan:
Hold through the weekend → Exit on Monday (14th July) if stock moves sharply 🔥
________________________________________________________________________________🧠 Alert:
Set alerts at:
₹4450 (Upside)
₹3950 (Downside)
If either hits on Monday, trail the winning side and exit the losing leg.
________________________________________________________________________________
📚 This is a learning example – not a trade recommendation.
Options carry risk. Please manage your capital and don’t trade blindly.
________________________________________________________________________________⚠️ Disclaimer (Please Read):
• This chart is shared for educational purposes only and is not investment advice.
• I am not a SEBI-registered advisor.
• The information provided here is based on personal market observation.
• No buy/sell recommendations are being made.
• Please do your own research or consult a registered financial advisor before making any trading decisions.
• Trading involves risk. Always use proper risk management.
________________________________________________________________________________
NAUKRI - Demand Zone + Key Levels________________________________________________________________________________
📊 INFO EDGE (NSE: NAUKRI) – Beginner Chart Study | Demand Zone + Key Levels
🕒 Chart Timeframe: 15-Min | 📆 Updated: July 8, 2025
________________________________________________________________________________
🔍 What the Chart Shows:
NAUKRI recently bounced from a clearly defined demand zone and is now trading near a key mid-level. This educational post is meant to help understand how price behaves around such zones.
________________________________________________________________________________
✅ Zones to Observe for Strength (Upside):
• Above 1489.00: Price sustaining above this top range may indicate strength.
• Between 1432.35 and 1404.10: This broader zone has acted as support earlier. If revisited, watch how price behaves here.
________________________________________________________________________________
⚠️ Neutral / Observation Area:
• Around 1459.40 (near 1460.65): Price is consolidating near this level. It’s better to observe and wait for more clarity from price movement and volume.
________________________________________________________________________________
🔻 Zones to Observe for Weakness (Downside):
• Between 1460.65 – 1489.00: If price reacts negatively here (e.g., rejection candles or high supply volume), observe how it develops.
• Below 1402.85: This would invalidate the previous demand zone. Further weakness could be possible if price closes below.
________________________________________________________________________________
🧠 Learning Takeaways for Traders:
• Avoid trades in the middle zone without clear confirmation.
• Always wait for bullish or bearish patterns and supporting volume before considering action.
• Structure and levels help guide observation – not prediction.
________________________________________________________________________________
📌 Levels Recap:
• Top Range (Resistance): 1489.00
• Mid Resistance: 1460.65
• Mid Support: 1432.35
• Bottom Range: 1404.10
• Demand Zone Reference: 1414.20 – 1404.90 | SL Reference Level: 1402.85 (used for structure observation only)
________________________________________________________________________________
⚠️ Disclaimer (Please Read):
• This chart is shared for educational purposes only and is not investment advice.
• I am not a SEBI-registered advisor.
• The information provided here is based on personal market observation.
• No buy/sell recommendations are being made.
• Please do your own research or consult a registered financial advisor before making any trading decisions.
• Trading involves risk. Always use proper risk management.
________________________________________________________________________________
💬 Join the Discussion (Comments):
✅ Was this chart structure easy to understand?
✅ How do you look at such supply and demand zones in your charting?
✅ Want more beginner-focused educational charts? Drop a 💬 below.
✅ If you're learning technical analysis, follow for more such breakdowns.
________________________________________________________________________________

"Selling Shares in Under a Year? Know Your Tax Rules!"💰 Sold shares and made a profit? Wondering if you pay tax on the full sale or just the profit? In this video, we break down Short-Term Capital Gains (STCG) tax in simple terms — including how to calculate tax, adjust losses, and carry forward STCL. No jargon, just clear answers every beginner needs!
