BUY TODAY SELL TOMORROW for 5%DON’T HAVE TIME TO MANAGE YOUR TRADES?
- Take BTST trades at 3:25 pm every day
- Try to exit by taking 4-7% profit of each trade
- SL can also be maintained as closing below the low of the breakout candle
Now, why do I prefer BTST over swing trades? The primary reason is that I have observed that 90% of the stocks give most of the movement in just 1-2 days and the rest of the time they either consolidate or fall
Resistance Breakout in BEML
BUY TODAY SELL TOMORROW for 5%
BEML

Elliott Wave Analysis & Technical Cross-VerificationsHello Friends, Welcome to RK_Chaarts,
Today, we're going to learn how to validate our Elliott Wave analysis by identifying additional factors that support our directional bias. Once we've plotted our Elliott Wave counts and identified a direction, we want to confirm whether other technical indicators and patterns align with our analysis. This helps strengthen our conviction in our directional bias and provides additional confidence in our trading decisions. Today, we'll explore some key points, including Elliott Wave theory, Exponential moving averages, Trend line breakouts, and Invalidation levels, as well as projected targets. And please note that this post is shared solely for educational purposes. It is not a trading idea, tip, or advisory. This is purely an Educational post.
Elliott Wave Theory structure & wave Counts
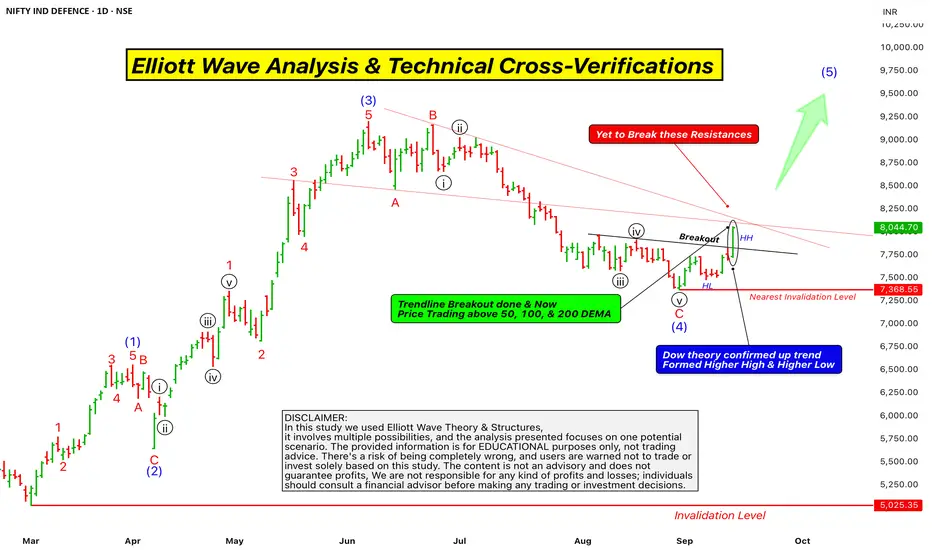
Here chart we are using Nifty India Defence sector, which is an index chart. We are analyzing it using Elliott Wave theory. It's very clear that from the March 2025 bottom, we've identified a clear Wave (1) Wave (2) Wave (3) and Wave (4) and now we've started Wave (5) of Intermediate degree in Blue.
Projections of wave (5)
According to the theory, the projected target for Wave (5) is typically between 123% to 161.8% of the length of Wave (4). So, we can at least assume that the price will reach 123% of Wave (4)’s length, and the price will move higher from here.
Trendline Breakout
The trend line breakout also confirms this. Since Wave (4) moved downwards, Wave (5) should move upwards, indicating a potential upward movement in price. This is a positive signal and a possibility.
Dow Theory confirmation of Trend changed
Additionally, we can see that in the daily time frame, the price has recently completed Wave (4) and formed a higher high, followed by a higher low, and then another higher high, along with a trend line breakout, which we've marked with a rounded ellipse on candle on the chart.
According to Dow theory, this formation of higher highs and higher lows, along with the trend line breakout, indicates that the index has the strength to break through resistance. These two factors strongly support our Elliott Wave projection, which suggests that the price will move upwards. The chart is looking bullish, indicating that a swing has been activated upwards from here.
Exponential Moving Averages
Furthermore, we can see that the price is trading above the 50-day exponential moving average (EMA) in the daily time frame, as well as above the 100-day EMA and the 200-day EMA. These three EMAs are major indicators, and the price is sustaining above all of them. This is also a very good positive sign that supports our view and this scenario.
Supporting Indicators
MACD
RSI
Some Hurdles to cross yet
Finally, we can see that the Zero B trend line, which is coming down from the top, has not been crossed by the price yet, and there has been no breakout. Additionally, we have drawn a trend line connecting the high of the third wave and the low of the fourth wave, which initially acted as resistance and later as support. This trend line is also approaching the same level as the Zero B trend line. So, we have two resistances converging at the same point, which the price has yet to break out of.
This could potentially be a hurdle, and it's possible that according to the Elliott Wave count, Wave (5) will arrive with five sub-divisions, which could lead to a retest of the previous trend line or a Retracement before moving further upwards.
Invalidation Level
According to Elliott Wave theory, the nearest invalidation level is the low of Wave (4), which is currently at 7368, and this level should not be breached. If it is, it will lead to a lower low, which would be an invalidation of the Elliott Wave count.
Overall, the chart of this index looks very promising and bullish. As we all know, the market can be unpredictable, but if this invalidation level is not triggered and the price doesn't break down, then the chart may move upwards with strength. This entire analysis that we discussed is for the Nifty India Defense index chart. Please note that this is not a trading tip or advice, but rather an educational perspective that we shared. Also, keep in mind that the Nifty Defense index is not tradable, but it does provide insight into the market's direction.
This post is shared purely for educational purpose & it’s Not a trading advice.
I am not Sebi registered analyst.
My studies are for educational purpose only.
Please Consult your financial advisor before trading or investing.
I am not responsible for any kinds of your profits and your losses.
Most investors treat trading as a hobby because they have a full-time job doing something else.
However, If you treat trading like a business, it will pay you like a business.
If you treat like a hobby, hobbies don't pay, they cost you...!
Hope this post is helpful to community
Thanks
RK💕
Disclaimer and Risk Warning.
The analysis and discussion provided on in.tradingview.com is intended for educational purposes only and should not be relied upon for trading decisions. RK_Chaarts is not an investment adviser and the information provided here should not be taken as professional investment advice. Before buying or selling any investments, securities, or precious metals, it is recommended that you conduct your own due diligence. RK_Chaarts does not share in your profits and will not take responsibility for any losses you may incur. So Please Consult your financial advisor before trading or investing.
BEML IN ( BEML Limited) LongBEML is the second largest manufacturer of earthmoving equipment in Asia
BEML manufactures a wide range of products including:
Earthmoving Equipment: Bulldozers, Excavators, Dump Trucks, Motor Graders.
Mining Equipment: Underground Mining Machines, Road Headers.
Rail: Metro Coaches, Electric Multiple Units, Vande Bharat Trains.
Defence Equipment: High Mobility Vehicles, Missile Systems, Aerospace Equipment
Since the Government of India holds 54% stake in the company, BEML receives significant support from the government, especially in the defence and infrastructure sector. This provides the company with stability and access to large government contracts
The company recently received an order for LHB coaches worth and an order for High Mobility Vehicles worth from the Ministry of Defence.
The company's current order book is over INR 16,700 crore, which provides visibility of earnings for the coming years
The company pays out about 30% of its profits as dividends. The dividend yield is small and can be considered as an additional bonus to the growing business. The dividend growth will continue in the coming years
The defense complex will be in great demand in the country in the next decade
The company's profit has been growing at an average rate of 35.7% per annum over the past five years. We expect the positive dynamics in this parameter to continue.
In terms of the Technical picture, the price is testing the support level of the ascending trend line, and a double bottom is also visible so far.

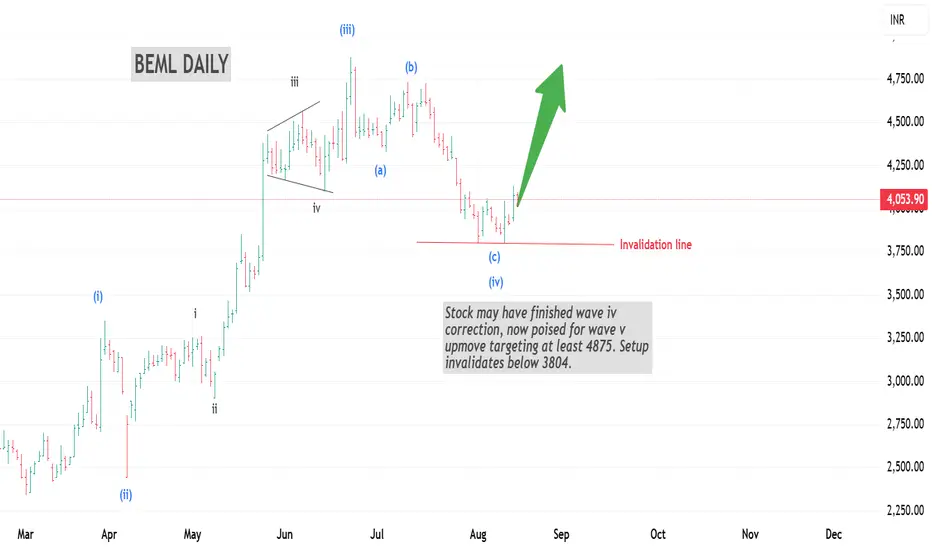
BEML Stock may have finished wave iv correction, now poised for wave v up move targeting at least 4875. Setup invalidates below 3804.
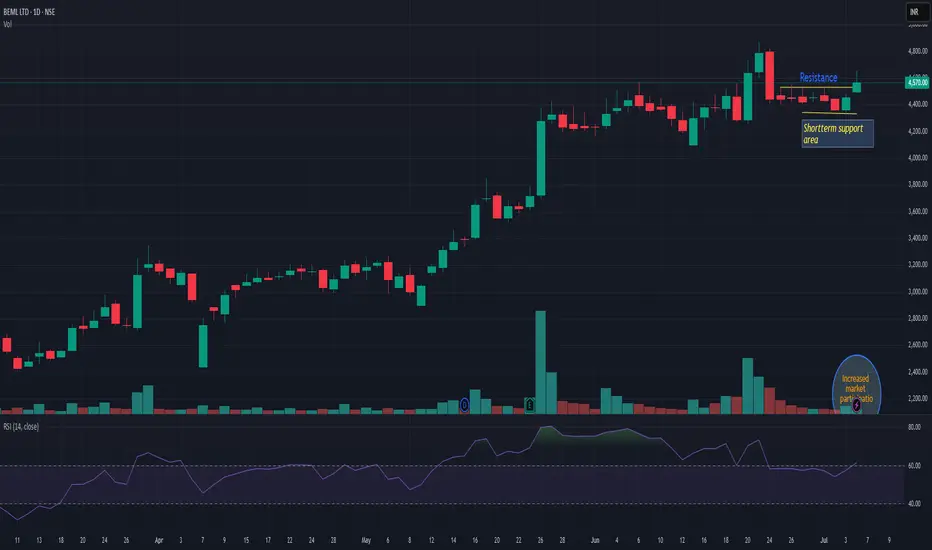
BEMLBEML is trading above resistance line with very decent volume. As long as it is trading above support line, momentum may continue. Recently fresh momentum has been observed on majority defense stock. If today it is closing above 4600 then we may see momentum for next 12-15%. Keep it on radar.
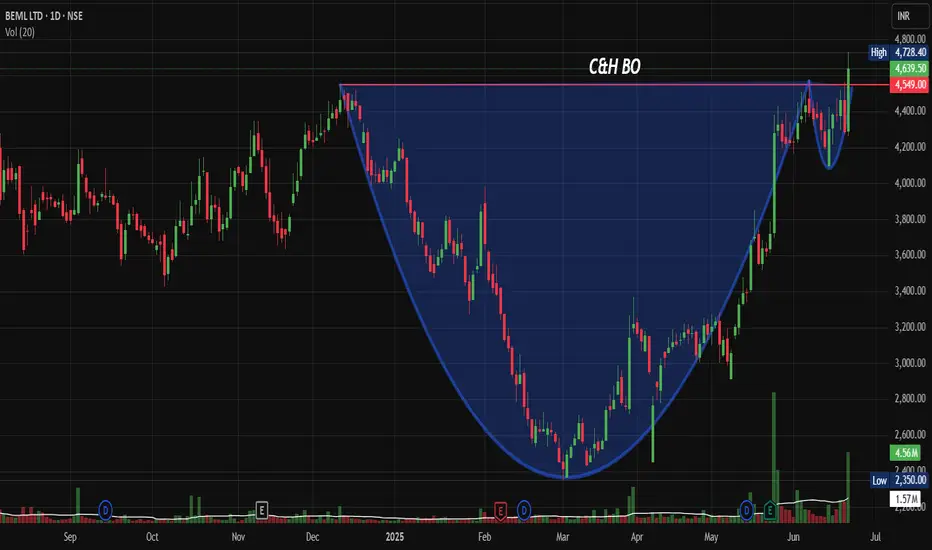
BEML: Breaks Multi-Month Resistance: Perfect Cup & Handle SetupNSE:BEML Breaks Multi-Month Resistance: Perfect Cup and Handle Setup Signals Major Upside Potential
Price Action Analysis:
Current Price Movement:
-Current Price: ₹4,291.50 (as of June 20, 2025)
-Daily Change: +₹351.70 (+8.20%) - Strong bullish momentum
-High: ₹4,728.40 | Low: ₹4,261.00
-Opening: ₹4,291.50 | Volume: 1.57M shares
Key Price Action Points:
Phase 1: Initial Decline (Sep 2024 - Dec 2024)
-Price Range: 4,400 to 3,600 levels
-Characteristics: Controlled selling with no panic dumping
-Volume: Moderate selling pressure
-Significance: Formation of the cup's left rim
Phase 2: Deep Correction (Dec 2024 - Feb 2025)
-Price Range: 3,600 to 2,350 (Cup Bottom)
-Characteristics: Capitulation phase with heavy selling
-Volume: High volume during the decline indicates washout
-Key Level: 2,350 marked the absolute low and cup base
Phase 3: Recovery Rally (Feb 2025 - Apr 2025)
-Price Range: 2,350 to 3,400 levels
-Characteristics: Strong bounce from cup bottom with increasing volume
-Price Action: Higher lows formation indicating accumulation
-Recovery Strength: 45% bounce from lows
Phase 4: Handle Formation (Apr 2025 - May 2025)
-Price Range: 3,400 to 3,000 levels (shallow pullback)
-Characteristics: Light volume decline, healthy consolidation
-Duration: Approximately 4-6 weeks of sideways action
-Volume Pattern: Drying up volume during pullback - classic handle behaviour
Phase 5: Breakout Phase (May 2025 - Current)
-Breakout Level: Above 3,400-3,500 resistance
-Price Acceleration: From 3,000 to the current 4,639 levels
-Volume Confirmation: Massive volume surge during breakout
-Momentum: 43% rally from handle lows in just 6-8 weeks
Candlestick Patterns and Price Behaviour
-Recent Action: Large green candles with minimal upper shadows indicating strong buying pressure
-Volume-Price Relationship: Price advancing on expanding volume - healthy trend
-Pullback Quality: Any pullbacks have been shallow with quick recoveries
-Support Holding: Price consistently holding above key moving averages
Price Structure Analysis:
-Higher Highs: Consistent pattern of higher peaks since February 2025
-Higher Lows: Each pullback finds support at higher levels
-Trend Strength: Steep angle of ascent indicates strong institutional buying
-Momentum Characteristics: Price moving in strong trending phases rather than choppy action
Critical Price Levels Based on Price Action:
-Breakout Confirmation: 3,500 level successfully held as support after breakout
-Momentum Continuation: 4,000 psychological level cleared with ease
-Current Resistance Test: Approaching the 4,800 level with strong momentum
-Volume at Key Levels: Each significant level break is accompanied by volume expansion
Chart Patterns:
-Cup and Handle Formation: The chart displays a classic cup and handle pattern spanning from late 2024 to mid-2025, with the cup formation completing around June 2025 at approximately 4,639 levels
-Breakout Confirmation: Stock has successfully broken above the handle resistance levels with strong volume confirmation
-Time Frame: The pattern has developed over approximately 9 months, indicating strong institutional accumulation
Support and Resistance Levels:
Major Support Levels:
-Immediate Support: 4,000-4,100 (psychological and technical level)
-Primary Support: 3,800-3,900 (previous resistance turned support)
-Secondary Support: 3,400-3,500 (breakout level)
-Long-term Support: 2,800-3,000 (cup base formation)
Resistance Levels:
-Immediate Resistance: 4,800-4,900 (current test level)
-Major Resistance: 5,200-5,400 (projected target based on cup depth)
-Extended Target: 5,800-6,000 (long-term projection)
Volume Spread Analysis:
-Breakout Volume: Significant volume spike observed during the recent breakout from handle formation
-Volume Confirmation: Above-average volume during the entire cup formation phase indicates institutional interest
-Current Volume: 1.57M shares showing continued institutional participation
-Volume Trend: Consistent volume buildup supporting price advancement
Base Formation Analysis:
Primary Base Characteristics:
-Base Type: Cup and Handle pattern with 7-month consolidation
-Base Depth: Approximately 47% correction from highs of 4,400 to lows of 2,350
-Base Duration: Extended consolidation period allowing for proper shake-out of weak hands
-Base Quality: Clean consolidation with clear support and resistance levels
Trade Setup Analysis:
Entry Strategy:
-Primary Entry: 4,100-4,200 (on pullback to support zone)
-Aggressive Entry: Current market price around 4,300 with tight stop-loss
-Conservative Entry: Wait for retest of 3,800-4,000 support levels
Exit Levels:
Target 1: 5,200 (21% upside from current levels)
Target 2: 5,600 (30% upside potential)
Target 3: 6,000 (40% upside - long-term target)
Stop-Loss Management:
Initial Stop-Loss: 3,800 (below key support)
Trailing Stop: Move to 4,000 once Target 1 is achieved
Risk-Reward Ratio: 1:2.5 (favourable risk-reward setup)
Position Sizing Recommendations:
-Conservative Approach: 2-3% of portfolio allocation
-Moderate Risk: 3-5% allocation for growth-oriented portfolios
-Risk Management: Maximum 5% position size due to single stock concentration risk
Risk Management Framework:
Key Risk Factors:
Market Risk: Overall market volatility can impact individual stock performance
Sector Risk: Defence and infrastructure sector cyclicality
Execution Risk: Pattern failure if stock breaks below 3,800 support
Risk Mitigation Strategies:
Diversification: Avoid over-concentration in a single position
Stop-Loss Discipline: Strict adherence to predetermined exit levels
Position Monitoring: Regular review of technical and fundamental developments
Sectoral and Fundamental Backdrop:
Business Verticals:
-BEML operates across Defence, Rail, Power, Mining and Infrastructure sectors, serving India's core industries BemlindiaBemlindia
-The company manufactures heavy earthmoving equipment for mining and construction, defence vehicles, and coaches for metro and Indian Railways, Bharat Earth Movers Limited
Financial Performance:
-Market Cap: ₹19,324 Crore with revenue of ₹4,022 Cr and profit of ₹293 Cr
-Promoter holding stands at 54.0%, indicating strong government backing.
-The board has recommended a final dividend of ₹1.20 per share for FY25, reflecting confidence in financial performance.
Growth Drivers:
-Company targeting ₹30bn annual opportunity in the mining sector with state-of-the-art equipment.
-Defence projects, including DATRAN prototypes, are expected to be completed by mid-2025
-The company has grown from ₹5 Cr turnover in 1965 to over ₹4,300 Cr currently.
Sector Outlook:
-Defence Modernization: Beneficiary of India's defence modernization and Make in India initiatives
-Infrastructure Push: The Government's focus on infrastructure development supports mining and construction equipment demand
-Railway Expansion: Metro and railway coach manufacturing aligned with India's transportation infrastructure growth
Investment Thesis:
-PSU Re-rating: Part of the broader PSU re-rating theme in Indian markets
-Diversified Revenue: Multi-sector exposure provides revenue stability
-Government Support: Strong backing from the Ministry of Defence ensures policy support
-Technical Breakout: Pattern completion suggests an institutional accumulation phase
My Take:
The combination of strong price action momentum with improving fundamental backdrop makes BEML an attractive investment opportunity for medium to long-term investors, with the cup and handle breakout providing clear entry and exit parameters for risk management.
Keep in the Watchlist.
NO RECO. For Buy/Sell.
📌Thank you for exploring my idea! I hope you found it valuable.
🙏FOLLOW for more
👍BOOST if you found it useful.
✍️COMMENT below with your views.
Meanwhile, check out my other stock ideas on the right side until this trade is activated. I would love your feedback.
Disclaimer: "I am not a SEBI REGISTERED RESEARCH ANALYST AND INVESTMENT ADVISER."
This analysis is intended solely for informational and educational purposes and should not be interpreted as financial advice. It is advisable to consult a qualified financial advisor or conduct thorough research before making investment decisions.
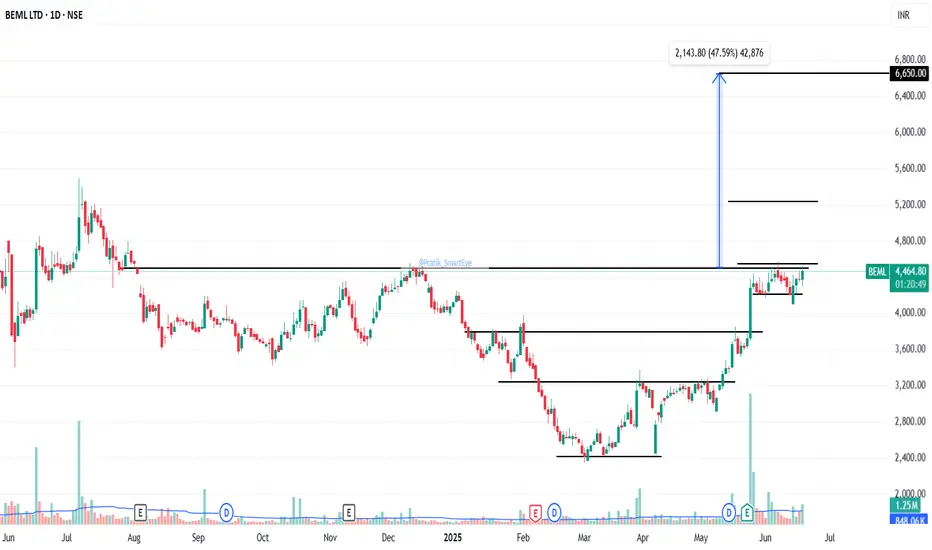
BEML: at Rounding Bottom Breakout.BEML: at Rounding Bottom Breakout. CMP 4473.
Sustained close above 4550 needed.
Resistance 5232/6650.
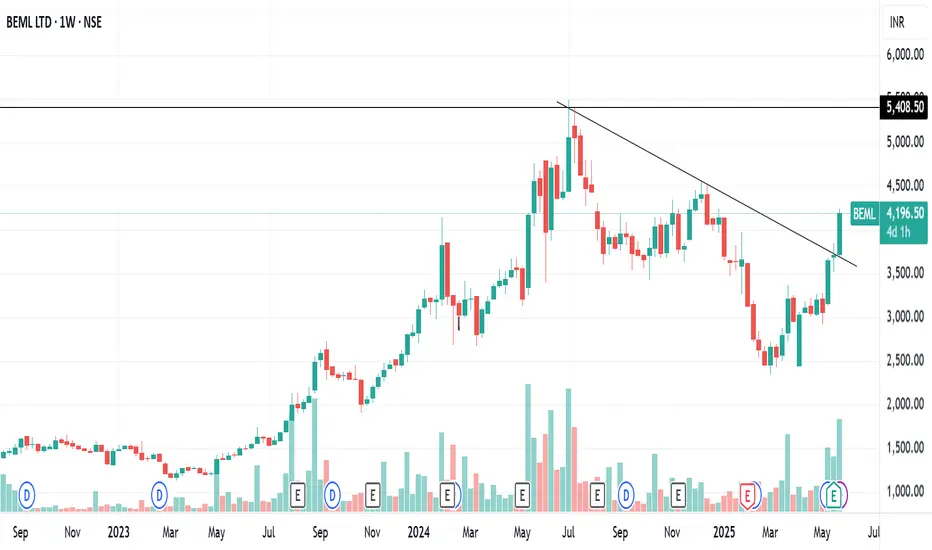
BEML WEEKLY TRENDLINE BREAKOUTBEML is giving trendline breakout weekly basis
huge volume building up last few weeks
bullish RSI,trading above all key ema
target 4600-4800-5400
DO YOUR OWN RESEARCH BEFORE INVESTING
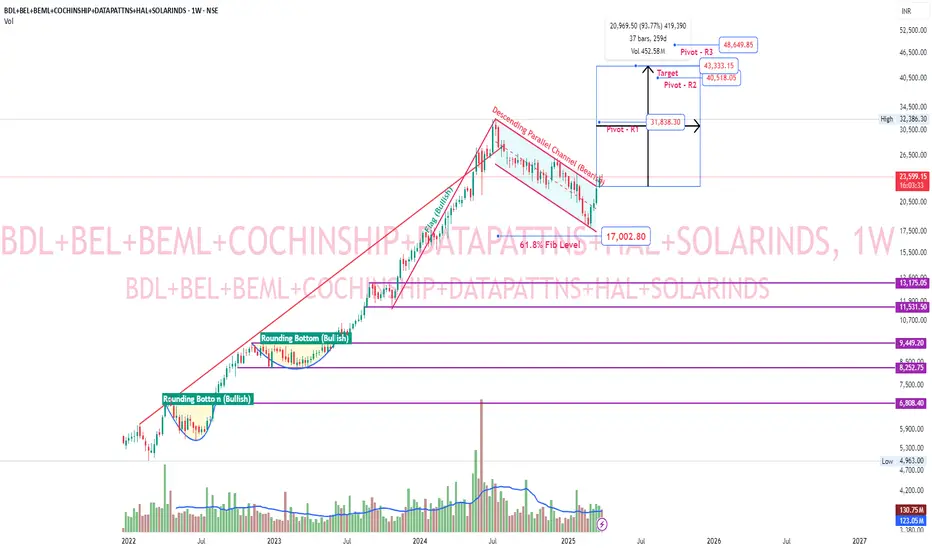
Aerospace & Defence bullish flag breakoutCreated custom index with following scrips. BDL, BEL, BEML, COCHINSHIP, DATAPATTNS, HAL, SOLARINDS. These are some major aerospace-defence companies. This custom index gave a bullish flag breakout. Huge upside potential based on flag pole as target. Pivot R1 itself has approximately 34.5% upside potential.
BEML - Confluence of Supports Suggests a Potential Reversal!The weekly chart of BEML indicates a potential reversal as the stock approaches a critical confluence of support levels. After a significant correction from its all-time high, the price is now testing key technical levels that could act as a strong base for a bullish reversal.
Key Observations:
1. 200-Week EMA Support:
- The price is currently hovering near the 200-week EMA, which has historically acted as a strong dynamic support zone in trending markets.
2. Fibonacci Retracement:
- The stock is approaching the 0.618 Fibonacci retracement level, which is widely regarded as a golden ratio for potential reversals during corrections.
3. Potential Bullish Reversal:
- If the stock holds above this critical support zone, it could initiate a reversal toward higher levels.
---
Let me know your thoughts in the comments! #BEML #TechnicalAnalysis #SwingTrading"
---
Disclaimer:
This analysis is for informational and educational purposes only and does not constitute financial advice. Trading involves risk, and past performance is not indicative of future results. Always conduct your own research and consult with a qualified financial advisor before making any investment decisions.

BEML- Breakout updateBEML CMP: 4360.25; RSI: 67.40;
BEML has completed primary level ABC correction pattern. Now clear breakout above 4280 level was observed as script is sustaining above breakout level from last 3 consecutive trading sessions, representing strength in script and bottoming out signs.
Thus, fresh position in BEML can be initiated. Chart structure is strong and must be accumulated for a swing trade as per below suggested levels.
Accumulation Zone: 4300-4400
Stop Loss: 4280
Target: 4604-5052-6234
✅ FOR MORE TRADING IDEAS LIKE THIS, PLEASE LIKE, SHARE, AND FOLLOW MY IDEA STREAM ✅

BEML Targeting 5500 Amidst Bullish MomentumDetails:
Asset: BEML Limited (Bharat Earth Movers Limited)
Breakout Level: Watch for sustained momentum confirmation
Potential Target: 5500
Stop Loss: Below recent support levels or as per risk tolerance
Timeframe: Short to medium-term
Rationale: BEML is showing strong bullish momentum, with technical indicators suggesting a potential move toward the 5500 level. Positive investor sentiment and robust demand in its sector further support this bullish outlook.
Market Analysis:
Technical Setup: The stock has been showing consistent upward movement. A clear trajectory points toward 5500 as a key target.
Sector Strength: As a leader in heavy earthmoving equipment and infrastructure support, BEML benefits from ongoing infrastructure and defense projects.
Price Target:
The immediate focus is on 5500, with potential for further gains if momentum persists.
Risk Management:
Place a stop loss below critical support levels to manage downside risk in case of market volatility.
Timeframe:
The move to 5500 is expected in the short to medium term, driven by technical and sectoral tailwinds.
Risk-Reward Ratio:
Favorable, with strong upside potential and manageable downside risk near support levels.
Keep tracking BEML’s price action and volume for further confirmation, and consider market conditions that could influence infrastructure and defense stocks.

BEML Firing up!BEML is near it's fresh wave up. One can enter after the breakout or a RETEST if you are a SAFE investor/Trader.
Target: 4650-4800-5000
NOTE: I'm not a SEBI REG. Study before investing.

BEML retested the Demand zone #BEML showing a good come back after re testing the Demand Zone. Now for last few weeks in a range and if Breaks abv 4050 then regain the previous ATH almost 31% return.
BEML Ltd manufactures a wide range of heavy earthmoving equipment catering to the mining and construction industry, vehicles for defence forces and coaches for the metro and Indian Railways.

BEL IS LOOKING BULLISHBEL is looking bullish as its reacted from strong zone. If if closes above 295 more bullishness will be added. These all views are my personal and posting here only for educational purposes. These are not buy/sell recommendations. Better contact your personal financial advisor before go are investing into any stock.

BEML LTD: Bulldozing Its Way to New Heights!BEML LTD: Bulldozing Its Way to New Heights!
Technical Analysis:
Trend: BEML is on a bullish rampage, charging upwards like a bull in a china shop... if the china shop were full of profit opportunities!
Breakout: The stock just smashed through resistance at 4,777.90, showing more strength than a bodybuilder at a protein shake convention.
Support: Previous resistance now acts as support. If BEML were a superhero, 4,777.90 would be its trusty sidekick, always there for backup.
Volume: Increasing volume confirms the uptrend. Traders are piling in faster than kids at an ice cream truck on a hot summer day!
Price Action: Strong bullish candles suggest momentum. BEML is painting the chart green like it's trying to win a St. Patrick's Day parade.
Fundamental Factors:
BEML, a defense equipment manufacturer, likely benefiting from increased government spending.
Infrastructure push in India could be fueling demand for BEML's construction equipment.
Risks:
Overbought conditions may lead to a pullback. Even rocket ships need to refuel sometimes!
Keep an eye on broader market sentiment and sector-specific news.
Trade Idea:
Consider long positions with a stop loss below the breakout level. Target the psychological 5,500 level.
Remember, folks, investing is like cooking - it's all fun and games until someone loses their dough. Always use proper risk management!
Disclaimer: This analysis is for educational purposes only. Do your own research before making investment decisions. And remember, the market has more mood swings than a teenager, so trade wisely!

Paras, another stock want to dance, setting up well-Long base BO then
Elections results create volatility but
Setting up again:
-Recovered fast with volumes then red candle on low vol n bounced from 10 ema
-Defence stocks are making good setups
-Good shakeout of 21 ema
-tightness

BEML DOUBLE BOTTOM BREAKOUTBEML breaking double bottom
with huge volume
#target can be 3900
EDUCATIONAL IDEA

Indian Railway Stocks Railway stocks can breakout again if price closes and sustains above 7115
1) IRCTC
2) CONCOR
3) IRFC
4) RVNL
5) RITES
6) BEML
7) TITAGARH
8) RAILTEL
9) IRCON
Disclaimer: This analysis is for educational purposes only, and I'm not a SEBI registered analyst.
If you found this analysis helpful, I encourage you to like and share it. Your observations and comments are also welcomed below. Your support, likes, follows, and comments motivate me to consistently share valuable insights with you.
🔍 More Analysis & Trade Setups 🔍
For more technical analysis and trade setups, make sure to follow me on TradingView: www.tradingview.com

BEML: CUP&HANDLETrading Strategy : Stock has given a breakout of the formation of cup and handle . One should buy the stock near the current level i.e. 2015 and keeping a stop loss of 1675 , look for the target of 2900-3000 in the coming weeks and months.
Buy: CMP
Stop loss : 1675
Targets:
Tgt 1: 2900-3000
Theory:
The Cup with Handle is a bullish continuation pattern that marks a consolidation period followed by a breakout. It was developed by William O'Neil and introduced in his 1988 book, How to Make Money in Stocks.
As its name implies, there are two parts to the pattern: the cup and the handle. The cup forms after an advance and looks like a bowl or rounding bottom. As the cup is completed, a trading range develops on the right-hand side and the handle is formed. A subsequent breakout from the handle's trading range signals a continuation of the prior advance.
Trend: To qualify as a continuation pattern, a prior trend should exist. Ideally, the trend should be a few months old and not too mature. The more mature the trend, the less chance that the pattern marks a continuation or the less upside potential.
Cup: The cup should be “U” shaped and resemble a bowl or rounding bottom. A “V” shaped bottom would be considered too sharp of a reversal to qualify. The softer “U” shape ensures that the cup is a consolidation pattern with valid support at the bottom of the “U”. The perfect pattern would have equal highs on both sides of the cup, but this is not always the case.
Cup Depth: Ideally, the depth of the cup should retrace 1/3 or less of the previous advance. However, with volatile markets and over-reactions, the retracement could range from 1/3 to 1/2. In extreme situations, the maximum retracement could be 2/3, which conforms with Dow Theory.
Handle: After the high forms on the right side of the cup, there is a pullback that forms the handle. Sometimes this handle resembles a flag or pennant that slopes downward, other times it is just a short pullback. The handle represents the final consolidation/pullback before the big breakout and can retrace up to 1/3 of the cup's advance, but usually not more. The smaller the retracement, the more bullish the formation and significant the breakout. Sometimes it is prudent to wait for a break above the resistance line established by the highs of the cup.
Volume: There should be a substantial increase in volume on the breakout above the handle's resistance.
Target: The projected advance after breakout can be estimated by measuring the distance from the right peak of the cup to the bottom of the cup.

BEML F&P BREAKOUTBEML giving F&P pattrn breakout
good volume and RSI
MACD crossover done
trading above all key ema
educational idea

BEML LTD - 50% RETURNS!!!BUY - BEML LTD
CMP - Rs. 1512
Target - 1: Rs. 2000
Target - 2: Rs. 2275
.
.
Technicals - Cup and Handle Pattern
.
Note: Both Targets will be achieved within 1 year.
.
This is just a view by an expert analyst, please invest at your own risk.
.
Follow me for more!

