Devyani: Triangle pattern (Time frame- 1Day)Devyani: Triangle pattern (Time frame- 1Day)
.
Chart time frame -1 Day
Trade type -Short term
Duration - 2 months
Entry - 116
Target 1 - 128
Stoploss - 110
Risk : Reward - 1:2
Leave us a comment or like to keep our content for free and alive.
Have a great day everyone!
Disclaimer: All charts are purely for educational and information purpose only. I am not a SEBI registered Investement advisor. Please Trade and invest based on your knowledge and risk profile.
Beyondtechnicalanalysis

Bharat Rasayan Ltd.: Triangle pattern (Time frame- 1 Day )Bharat Rasayan Ltd.: Triangle pattern (Time frame- 1 Day )
.
Chart time frame -1 Day )
Trade type -Short term
Duration - 3 months
Entry - 12800
Target 1 - 15000
Stoploss - 11850
Risk : Reward - 1:2.3
Leave us a comment or like to keep our content for free and alive.
Have a great day everyone!
Disclaimer: All charts are purely for educational and information purpose only. I am not a SEBI registered Investement advisor. Please Trade and invest based on your knowledge and risk profile.

Adani Enterprises : Triangle pattern (Time frame-1Week)Adani Enterprises : Triangle pattern (Time frame-1Week)
.
Chart time frame -1 Week
Trade type -Short term
Duration - 3 months
Entry - 1600
Target 1 - 2000
Stoploss - 1350
Risk : Reward - 1:1.6
Leave us a comment or like to keep our content for free and alive.
Have a great day everyone!
Disclaimer: All charts are purely for educational and information purpose only. I am not a SEBI registered Investement advisor. Please Trade and invest based on your knowledge and risk profile.

ONEUSDT Triangle Chart Pattern !TREND ANALYSIS & TRADE SETUP !
WAVE ANALYSIS !!
Follow Chart Instruction.
Do not be Hurry for entry.
Wait for Proper Entry Setup.
Buy/Sell with Best Risk Reward.
Educational Chart Only.
Wait for ENTRY CONFIRMATION !
Risk:Reward: 4-5 times.

Hindalco Downtrend Start !!TREND ANALYSIS & TRADE SETUP !
WAVE ANALYSIS !!
Follow Chart Instruction.
Do not be Hurry for entry.
Wait for Proper Entry Setup.
Buy/Sell with Best Risk Reward.
Educational Chart Only.
Wait for ENTRY CONFIRMATION !
Risk:Reward: 8-10 times.

GODREJCP : Ending Diagonal This is the most common diagonal that can be found out at the ending of a main trend or main correction. It consists of all the waves 1-2-3-4-5 in a single or multiple zigzags. They can be found placed at 5th wave of an impulse wave or can been seen as a wave ‘C’ of a corrective waves zigzags or flat. After the termination of the ending diagonal, a swift & a sharp reversal takes place which bring the prices back to the level from where the diagonal began.
Properties of ending diagonal :
Wedge shaped structure (in case of contracting diagonal).
The subwaves of all the five waves should be in three wave structure.
Wave 3 should be shorter than wave 1 | Wave 5 should be shorter than wave 3 | Wave 4 should be shorter than wave 2
Trading Strategy :
Sell near 1000-1005. keep stop loss of 1025 and look for the target of 940/900/875

Bajaj Finserv Wave Analysis !TREND ANALYSIS & TRADE SETUP !
WAVE ANALYSIS !!
Follow Chart Instruction.
Do not be Hurry for entry.
Wait for Proper Entry Setup.
Buy/Sell with Best Risk Reward.
Educational Chart Only.
Wait for ENTRY CONFIRMATION !
Risk:Reward: 4-5 times.

Tata Power- Buying pattern for big moveTata power following some pattern before moving upward.
Its taking support of 50 Moving average.
Tata Power after entering to RSI red zone enter in RSI green zone from below(Entering RSI red zone must for big move)
Stock cross above or touch 50 days Moving Average then it move up price RS-30+.
All three condition must be satisfied for big move.
This observation can be used for other stocks also.
Sharing personal observation do investment after consulting your financial advisor.
Please like & comment to motivate.
Happy investing :)

GUJALKALI GUJALKALI (D):- 468.65 CMP, Looks good for more upsides :)
1) Breakout Done + Reversal sign :)
2) Volume Breakout

TATA POWER: Bullish TriangleBULLISH TRIANGLE :
Usually this wave structure forms in an impulsive sequence as wave 4 . It consists of 5 sub waves as wave-a , wave-b , wave-c, wave-d and a final setback wave-e. Each of these waves consists of three wave internal structure. Each of the waves should not break their extreme points. The final confirmation to enter the position comes when the price gets close above the level of wave-d. The minimum target of the pattern is just a poke above the level of wave-b and just above the level of wave-3 of the impulsive count. There is also a guideline to predict the target of this pattern which is known as triangular thrust. The triangular thrust is the measurement of the distance from the level of wave-a to the level of wave-b . This measured length should be kept to the breakout level of wave-d to get the target of this pattern.
Trading strategy:
Buy on cmp and add on dips , maintain the sl of 120 & look for the tgt of 133-34 .

MSTCLTD got a Trigger | CHART#16MSTC Ltd. engages in the export of scrap. It operates through the following segments: E-commerce and Trading. The E-commerce segment offers e-auction or e-sale, e-procurement services and development of customized software or solutions.
On February 1, 2021, Finance Minister Nirmala Sitharaman stated in her annual budget speech, “the government will announce a voluntary vehicle scrapping policy to phase out old and unfit vehicles.” She added, the move will help in encouraging fuel-efficient, environment-friendly vehicles, thereby reducing vehicular pollution and oil_import cost.
On March 18, 2021, Nitin Gadkari, Minister for Road Transport & Highways, introduced the much-awaited vehicle scrappage scheme in the LokSabha. According to the new policy, commercial vehicles of >15 years and passenger vehicles of >20 years will have to be mandatorily scrapped if they do not pass the fitness and emission tests.
*Stock Analysis*
The Scrappage policy news announced during union budget made a rally in the stock to rise to 400 levels. But the price is seen cooled off afterwards forming a triangle pattern consolidating to 250 range waiting for a trigger to move up.
The Trigger for the new move is listed in Notes.
*Important Levels to Watch*
--Entry @ above 272
--Target @ 315
--SL @ 230
Notes :
1. INDIA’S MSTC MARCH-QUARTER CONSOL PROFIT 758.3 MILLION RUPEES VERSUS PROFIT 47.1 MILLION RUPEES YEAR AGO (Source : Reuters)
2. MSTC MARCH-QUARTER CONSOL TOTAL REVENUE FROM OPERATIONS 3.11 BILLION RUPEES VERSUS 1.94 BILLION RUPEES YEAR AGO (Source : Reuters)
▢ Feel free to suggest your view on this as learning is earning here.
▢ Drop a follow here😉 @GokulHari
Good Luck Investors❗
-- GokulHari
❗❗ Disclosure : I am not a SEBI registered analyst. The information provided here is for education purposes only. I will not be responsible for any of your profit/loss with this suggestions. Consult your financial advisor or do your own analysis before taking any decision ❗❗

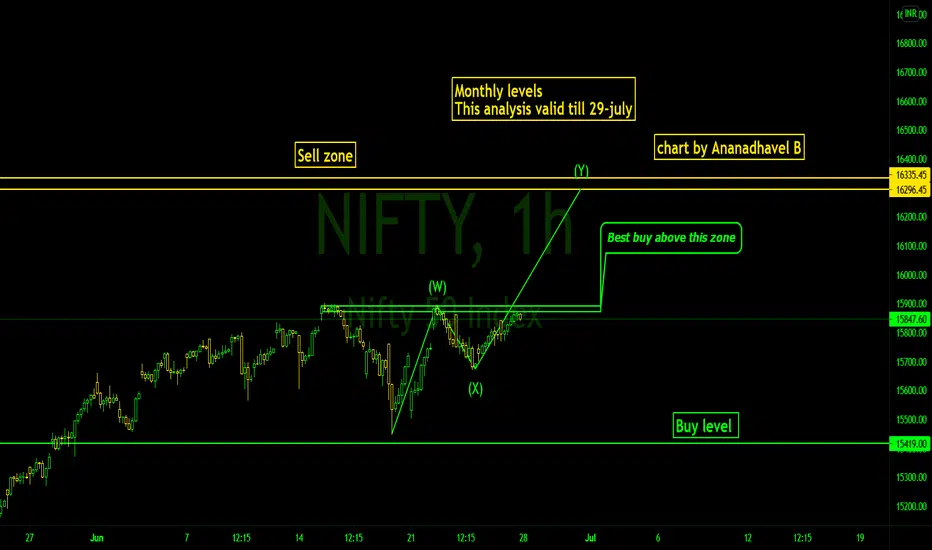
NIFTY 50 MONTLY LEVELS Expecting huge selloff at the range of (16250-16300 ) if Nifty break the level of 15400 and sustain for the day we can expect a downside side move for the coming month (a small correction)
If Nifty close above 15900 it can reach 16250++ (Buy only after the breakout from the resistance zone )
Personally, I'm expecting Nifty to reach 17000 by this financial year.
Disclaimer: Please consult your financial advisor,
Investment/Trading in the securities market is subject to market risk, We are not responsible for your profit or loss
BEL : Strong Breakout with Strong Q4 Results 🔥🔥🔥BHARAT ELECTRONICS (BEL)
About Company :
Bharat Electronics Ltd. engages in the manufacture and supply of strategic electronic products to defense services. Its products are weapon systems, radar and fire control systems, electro optics and communication, vacuum interrupters, electronic voting, telecom and SATCOM systems, semiconductor devices, microwave and transmitting tubes, solar products and systems. The company was founded on April 21, 1954 and is headquartered in Bangalore, India.
Analysis :
BEL has formed Cup & Handle kind of a chart pattern on Daily Chart and has given a strong breakout, hits over 3-year high.
Strong Q4 Results:
BEL reported a strong all-round performance in Q4FY21 despite a challenging environment. Robust order inflows at Rs 15,280 crore, up 15.8 per cent on YoY and order book at Rs 53,434 crore for the year provide good revenue visibility over the medium to long term. Also, strong balance sheet provides confidence about the continued accelerated business trajectory for the company
Looking good at CMP for further upside movement :)

UBL Disinvestment & Downtrend Start !!TREND ANALYSIS & TRADE SETUP !
WAVE ANALYSIS !!
Follow Chart Instruction.
Do not be Hurry for entry.
Wait for Proper Entry Setup.
Buy/Sell with Best Risk Reward.
Educational Chart Only.
Wait for ENTRY CONFIRMATION !
Risk:Reward: 8-10 times.

GMR INFRA Expiry Trend Analysis !!TREND ANALYSIS & TRADE SETUP !
WAVE ANALYSIS !!
Follow Chart Instruction.
Do not be Hurry for entry.
Wait for Proper Entry Setup.
Buy/Sell with Best Risk Reward.
Educational Chart Only.
Wait for ENTRY CONFIRMATION !
Risk:Reward: 8-10 times.

Hindalco Updated Chart ! Uptrend !TREND ANALYSIS & TRADE SETUP !
WAVE ANALYSIS !!
Follow Chart Instruction.
Do not be Hurry for entry.
Wait for Proper Entry Setup.
Buy/Sell with Best Risk Reward.
Educational Chart Only.
Wait for ENTRY CONFIRMATION !
Risk:Reward: 8-10 times.

wabag can look for tp of 328-330 on weekly tfwabag can look for tp of 328-330 on weekly tf positional basis
kindly support us by giving likes and cheers so we can bring more setups
Disclaimer: Only for educational and learning purpose

TCS Trade Setup 1st June !!TREND ANALYSIS & TRADE SETUP !
WAVE ANALYSIS !!
Follow Chart Instruction.
Do not be Hurry for entry.
Wait for Proper Entry Setup.
Buy/Sell with Best Risk Reward.
Educational Chart Only.
Wait for ENTRY CONFIRMATION !
Risk:Reward: 4-6 times.

NIFTY 50 BUY ON DIPS MARKET Buy on dips
1.wave analysis
2.uptrend
3.market structure
4.higher high and lower low
Disclaimer: Please consult your financial advisor,
Investment/Trading in the securities market is subject to market risk, We are not responsible for your profit or loss

Titan Wave Analysis !TREND ANALYSIS & TRADE SETUP !
WAVE ANALYSIS !!
Follow Chart Instruction.
Do not be Hurry for entry.
Wait for Proper Entry Setup.
Buy/Sell with Best Risk Reward.
Educational Chart Only.
Wait for ENTRY CONFIRMATION !
Reward is 8-10 times .
Regards @MohitArora

Petronet H&S, Retailer vs InstitutionalTREND ANALYSIS & TRADE SETUP !
WAVE ANALYSIS !!
HEAD 7 SHOULDER CHART PATTERN !!
Follow Chart Instruction.
Do not be Hurry for entry.
Wait for Proper Entry Setup.
Buy/Sell with Best Risk Reward.
Educational Chart Only.
Wait for ENTRY CONFIRMATION !
Reward is 5-7 times .

Nifty 50 Bearish harmonics Looking For shorts keep an eye
Disclaimer: Please consult your financial advisor,
Investment/Trading in the securities market is subject to market risk, We are not responsible for your profit or loss

Nifty sell on Rise market Avoid long position or swing position
Try to short (downtrend & correction not yet done in the weekly chart)
1.Global crisis
2.Market sentiments
3.Data analysis
Disclaimer: Please consult your financial advisor,
Investment/Trading in the securities market is subject to market risk, We are not responsible for your profit or loss
