Bharat Electronics Ltd. - Stock AnalysisDate : 16-Sep-2025
LTP : Rs. 402.90
Technical View:
• NSE:BEL is in primary uptrend since Apr 2025 and was recently going through it's secondary downtrend within primary uptrend.
• From it's all time high of 436 on 1-Jul-2025, it has retraced 17% to 361.20 on 28-Aug-2025 which is also close to Fibonacci retracement level 0.382 placed at 367.00.
• NSE:BEL has breakout from it's secondary downtrend with higher than average volume on 10-Sep-2025. Volume has also increased in last few sessions.
• NSE:BEL has closed above 20 DEMA and 50 DEMA on 10-Sep-2025 and is trading above 20 DEMA and 50 DEMA since last few sessions. 20 DEMA has also crossed over 50 DEMA on 16-Sep-2025.
• MACD has crossed over 0 and entered into bullish zone. It is trading at 2.58.
• RSI has crossed over 50 and trading in buy zone at 66.02.
• Looking good to start a new swing from here.
• Resistance Levels : (R1) Rs. 436 --> (R2) Rs. 480
• Support Level : Rs. 361
If you have liked this analysis, please Like/Boost this idea and follow me for more ideas.
Disclaimer : I am not a SEBI registered analyst/consultant and not recommending anyone to take any BUY or SELL position in stock market. Investing in stock market is risky and one should do a self analysis and validation before investing in stock market. My ideas are published for learning purpose only and are available to everyone at no cost/charge.
Bharatelectronicstrendanalysis

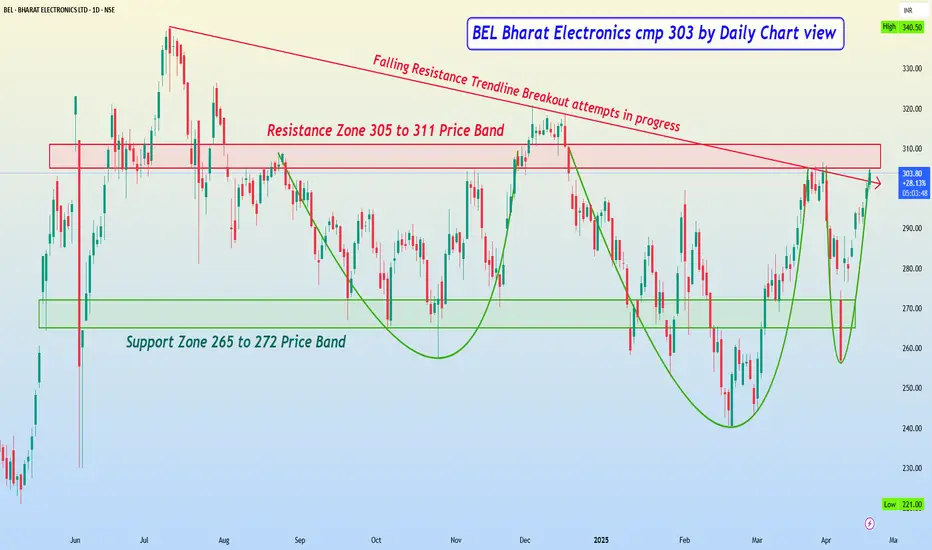
Bharat Electronics cmp 303 by Daily Chart viewBEL Bharat Electronics cmp 303 by Daily Chart view
- Support Zone 265 to 272 Price Band
- Resistance Zone 305 to 311 Price Band
- Falling Resistance Trendline Breakout attempts in progress
- Bullish Rounding Bottoms repeated with a false breakout in between
- Resistance Zone neckline acting as a strong hurdle to pass for fresh breakout
Bharat Electronics cmp 289.50 by Daily Chart viewBharat Electronics cmp 289.50 by Daily Chart view
- Falling Resistance Trendline Breakout done
- Stock chart has formed Bullish "W" or Double Bottom
- Volumes are seen timidly rising over the past few days
- Daily Support at 270 > 250 > 229 with Resistance at 302 > 324 > ATH 340.50
- Technical Indicator parameters like EMA, MACD, RSI seem to be getting on the positive front once again
- Stock was trading well between the 265 to 309 price range before making breakout but retraced back by profit booking
