Bhel - LongThis is a daily chart of BHEL. Earlier, the stock faced strong resistance at the marked level, where price failed to move higher in the past. When the price approached this area again, it broke above the resistance with a sharp upward move, showing strength and strong buying interest. After this breakout, the price is now trading above the resistance zone, which is a positive sign for the overall trend.
The same resistance level has now turned into support. You can see that whenever the price comes down near this support area, buyers step in and the price holds above it. This shows that the breakout level is being respected and sellers are not able to push the stock back below this zone. As long as the price stays above this support, the trend remains bullish.
One important point highlighted on the chart is that volumes are missing. After a strong breakout, ideally volumes should remain high to support further upside. Here, volumes have reduced during consolidation, which means aggressive buying is not visible at the moment. This does not make the structure weak, but it suggests that the next big move may need fresh volume confirmation.
Looking at the MACD indicator, the earlier up move is followed by cooling momentum. The MACD lines are close to each other and trying to stabilize near the zero line. This indicates that selling pressure is reducing and momentum is trying to shift again. If MACD turns up along with an increase in volume, it can support another upward move.
Overall, the chart shows a strong breakout structure with price holding above support, but volumes need to improve for a confident continuation. For learners, this is a good example of how breakout, support, volume behavior, and momentum should be read together before expecting the next move.
BHEL

BHEL : Price action update
📊 Bharat Heavy Electricals Limited – UPDATE
Timeframe: 1D
Trend Structure: Impulsive uptrend with Wave-4 corrective phase
Current Price Zone: ~₹263
Market Phase: Corrective pause after strong momentum rally
🔍 Big Picture Structure (What the Chart Is Telling Us)
BHEL has already completed a strong impulsive move (Wave 1–3), followed by a healthy correction (Wave 4).
This correction is time-consuming, not price-damaging, which is a bullish characteristic.
📘 Strong stocks correct sideways or shallow — weak stocks collapse.
🟦 Wave-4 Completion Zone: ₹243–267 (High-Probability Demand)
This zone is crucial and not random.
🧠 Why price reacts here (Trading Psychology):
Traders who missed the rally are waiting for a pullback to value
Early buyers defend this zone to protect unrealised profits
Short sellers start booking profits near prior breakout areas
👉 This creates a demand cluster, often leading to trend resumption
📌 That’s why this zone is marked as Correction Wave-4 completion area.
🔑 Key Levels & Their Psychological Importance
🟢 Support / Buy Zone: ₹243–267
• Prior consolidation + retracement value
• Risk-reward becomes favorable for positional buyers
🔴 Invalidation / Stop-Loss: ₹194
• Deep retracement beyond acceptable Wave-4 limits
• Below this, structure weakens and confidence breaks
📉 Below this level, buyers turn into sellers.
🔵 First Resistance / Target: ₹300–308
• Previous supply & liquidity zone
• Swing traders book profits here
• Causes temporary pullbacks
🟢 Breakout / Expansion Zone: ₹330–368
• Fresh highs attract momentum traders
• Stop-losses of shorts fuel upside
• Psychological FOMO zone
📈 New highs = emotional acceleration.
🔥 Extended Target: ₹345+
• Trend continuation zone
• Only achievable if volume supports price
🟢 Bullish Scenario (Primary Probability)
If price:
Holds above ₹243–267
Shows stabilization or higher-low formation
Then:
First move toward ₹300–308
Break & sustain → ₹330–368
Momentum extension possible toward ₹345+
📘 This is classic Wave-5 behavior after a healthy Wave-4 correction.
🔴 Bearish Risk Scenario (Low Probability but Important)
If price:
Breaks below ₹243 decisively
Fails to reclaim support quickly
Then:
Selling pressure may increase
Next major demand near ₹194
Structure becomes range-bound or corrective for longer
📉 This reflects loss of conviction, not trend reversal immediately.
🎓 Educational Takeaways (Very Important)
Corrections are where wealth is built, not breakouts
Strong stocks give second chances, weak ones don’t
Levels work because traders remember pain & opportunity
Price moves when crowd psychology aligns, not indicators
🧠 Why This Setup Is Educationally Powerful
Zone Crowd Emotion
Highs Greed & FOMO
Pullback Hope & Fear
Support zone Opportunity
Breakdown Panic
New highs Momentum chase
📘 Charts are a map of emotions, not lines.
🔮 Price Outlook (Educational Projection)
Above ₹267: Bullish bias intact
Above ₹308: Momentum resumes
Above ₹330: Expansion phase begins
Below ₹243: Patience required
Below ₹194: Structure weakens
🧾 Conclusion
BHEL is undergoing a textbook Wave-4 correction within a larger uptrend.
The ₹243–267 zone is a make-or-break region that can define the next multi-week move.
📌 Strong trends pause to shake weak hands — not to reverse.
⚠️ Disclaimer
This analysis is for educational purposes only.
I am not a SEBI registered analyst. Markets involve risk, and I may be wrong.
Please consult your financial advisor before making any trading or investment decisions.

BHEL: Long Setup OnThe stock of Bharat Heavy Electricals Limited (BHEL) recently tested a significant resistance level near ₹265 and has since begun a retracement phase. Current price action suggests a pullback toward a demand zone around ₹278 , which may act as a short-term support area.
The initial resistance at ₹265 served as a barrier to further upside, prompting the current retracement. The previous resistance level may now function as a support zone, a common occurrence when price breaks above and then retests prior resistance.
If the stock resumes its upward trajectory after consolidating near the demand zone, the next major resistance is projected around ₹321 , based on historical price action and chart structure.
The area near ₹278 is being monitored as a potential demand zone, where buying interest could emerge to support the price.
Immediate Support: ₹265
Demand Zone: Around ₹278
Next Resistance: ₹321
Disclaimer: This analysis is provided for educational and informational purposes only. It does not constitute investment advice or a recommendation to buy, sell, or hold any financial instrument. Market conditions can change rapidly; traders should conduct their own research or consult a licensed financial advisor before making any decisions.

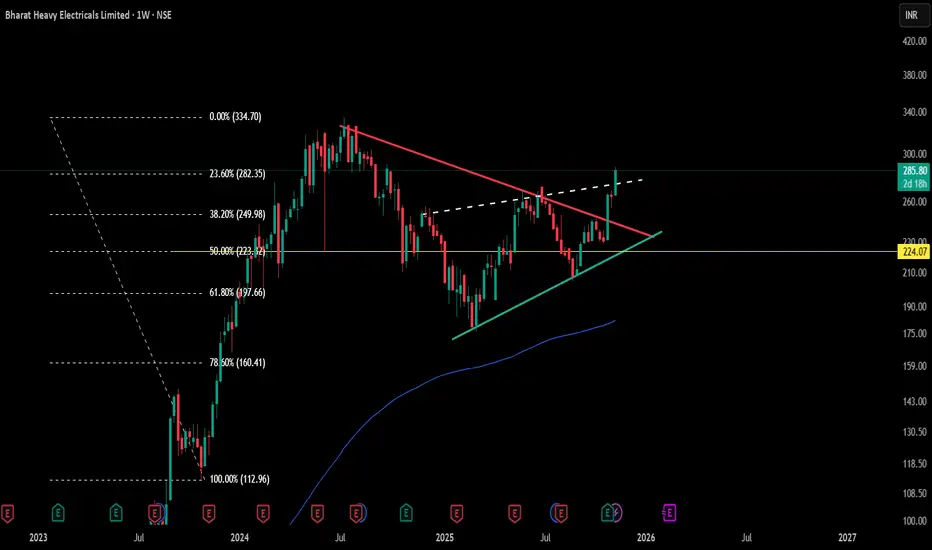
Symmetrical Triangle Structure & Key EquilibriumEditorial Insights
- Symmetrical triangles signal a balanced tug-of-war between buyers and sellers; this compression, as mapped here, often precedes significant expansions in volume and volatility.
- The triangular structure’s edges—CT (red) and trendline (green)—have been tested repeatedly over months, reflecting both supply absorption and demand resilience.
- The hidden white line adds a subtle layer of convergence, useful for traders identifying areas of potential liquidity concentration.
- The yellow 50% Fibonacci level frames the equilibrium for this market phase, offering a snapshot of price discovery dynamics within the triangle.
- Price positioning relative to all these lines is best seen as a way to monitor evolving order flow and market intent, without any explicit forecasting or directional bias.
Key Levels & Reference
- CT (Red): Major supply test points.
- Trendline (Green): Demand and higher low sequence.
- Hidden Line (White): Structural convergence not visibly obvious but influential.
- Fibonacci 50% (Yellow): Core equilibrium reflecting price agreement zone.
This post is for educational and analytical purposes, respecting the principle that all information is a visual observation—not a prediction or directional signal, but a live structure map to enrich your pattern playbook.
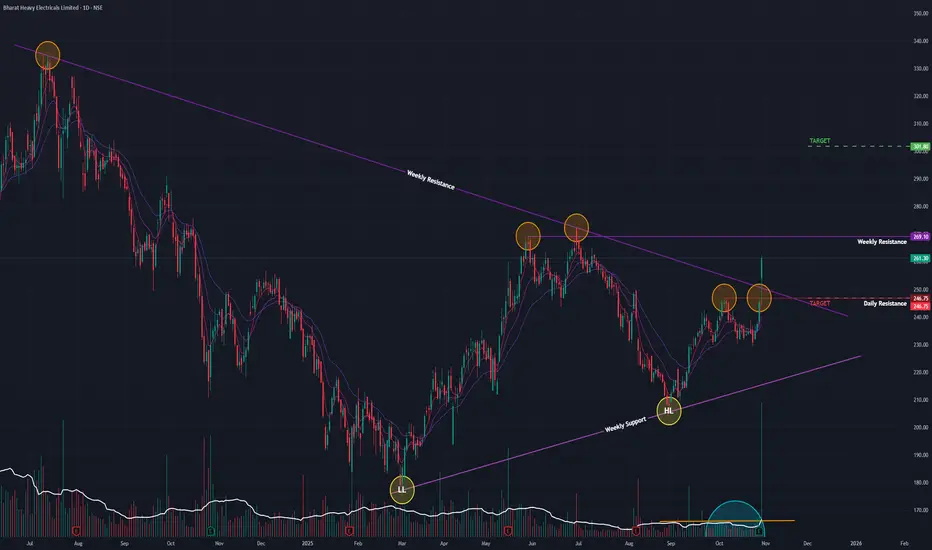
BHEL (D): Strongly Bullish, on a high-volume trendline breakoutThe stock has shown a significant character change, breaking a long-term corrective downtrend with exceptional force. All short-term and long-term indicators are aligning, suggesting a new bullish leg has begun.
📉 1. The Long-Term Context (The "Big Picture")
- Massive Run-Up: After a parabolic 1,720% surge from its March 2020 bottom, the stock hit a major peak in July 2024.
- Corrective Downtrend: This was followed by a healthy 8-month correction (Jul 2024 – Feb 2025), which allowed the stock to build a new base.
- Reversal Pattern: In recent months, the stock has reversed this trend by forming a clear pattern of Higher Lows , indicating that selling pressure has been absorbed and accumulation has taken place.
🚀 2. The Current Breakout (Today's Decisive Action)
Today's price action is the most significant bullish signal for the stock this year.
- High-Volume Surge: The stock surged +6.48% on massive volume of 75.43 Million shares, indicating strong institutional interest.
- Major Trendline Break: The price gapped up above the angular resistance trendline (formed since the July 2024 high) and, most importantly, closed firmly above it .
- Short-Term Breakout: This move also broke and closed above a minor, short-term resistance, adding to the bullish conviction.
📊 3. Key Technical Indicators
The underlying momentum across all timeframes supports this breakout:
- RSI: The Relative Strength Index is rising on the Daily, Weekly, and Monthly charts, showing broad-based, building momentum.
- EMAs: Short-term Exponential Moving Averages are in a "PCO" (Price Crossover) state on all three timeframes, confirming the trend is strongly bullish.
🎯 4. Future Scenarios & Key Levels to Watch
The path forward is now defined by two clear levels:
🐂 The Bullish Case (Breakout Confirmation)
- Immediate Hurdle: The next major test is the horizontal resistance at ₹265 .
- Confirmation: A decisive close above ₹265 would confirm the breakout and open the door for a significant rally.
- Target: If this momentum is sustained, the next logical price target is the ₹300 level.
🐻 The Bearish Case (Fake Breakout)
- Trigger: If today's move is a "fakeout," the price will fail to breach ₹265 and fall back below the broken angular trendline.
- Confirmation: A close back below the gap-up level (today's open) would be a bearish sign.
- Target: This failure would likely see the stock fall to retest its closest support at ₹245 .
Conclusion
Today's high-volume, gap-up breakout above a multi-month downtrend line is a powerful bullish event. The indicators are all aligned, suggesting this is the start of a new upward move. The key level to watch for confirmation is ₹265 .
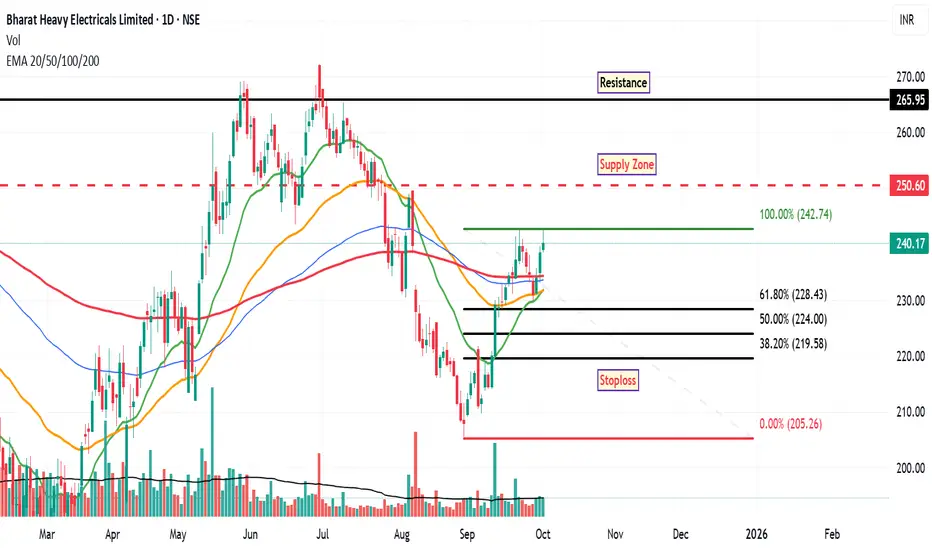
BHEL: Prospective InsightFollowing a recent retracement from a previously identified discount zone, the stock of Bharat Heavy Electricals Limited (BHEL) is exhibiting signs of potential bullish momentum. This outlook is supported by several technical indicators observed on the daily chart:
Fibonacci Retracement:
The stock has retraced to the 61.8% Fibonacci level from its recent swing high, a zone often regarded by technical analysts as a potential area of price support and reversal.
Exponential Moving Averages (EMAs):
Price action has moved above the 20-day, 50-day, 100-day, and 200-day EMAs, which may suggest strengthening bullish sentiment and a shift in medium- to long-term trend dynamics.
Golden Crossover Setup:
The shorter-term moving averages appear to be converging toward a golden crossover (typically when the 50-day EMA crosses above the 200-day EMA), a pattern that historically has been associated with bullish continuation, though confirmation is still pending.
Relative Strength Index (RSI):
The RSI has crossed above the 60 level, indicating increasing buying momentum. While not yet in overbought territory, this move may reflect growing investor interest.
Immediate Supply Zone:
Based on historical price action and volume profile, the stock may encounter resistance near the ₹250 level, with a stronger resistance band around ₹265 .
Support Zone:
Should the price face selling pressure, a potential support area lies near the 38.2% Fibonacci retracement level, approximately around ₹219 .
Disclaimer: This analysis is intended for informational and educational purposes only and does not constitute investment advice or a recommendation to buy or sell any securities. Market conditions can change rapidly, and traders should conduct their own due diligence or consult with a registered financial advisor before making any investment decisions.
Investment Stock Analysis - BHEL Strong BuyTechnical Aanalysis
After making HH in July 24. Stock came to Prev Breakout Levels to Retest
and currently in Accumulation before making fresh Higher High.
1) Inverted Head & SHoulder in formation. Pattern will be active when Strong closing above 261. Inactive if Closes below 179.
2) Currently within falling wedge resistance. Confirmative entry will be above candle closing above 264.
3) Multiple and Confirmed Patterns on Weekly and Monthly Charts
4) Hidden Divergence formed in a weekly Tf, confirm Trend Conformation towards prev high and Fresh Higher High.
4) Strong candidate to hold for Better returns on Short to Long term Investment.
Disclaimer: Views shared are for Educational purpose only. Initiate your own analysis before taking any trades.

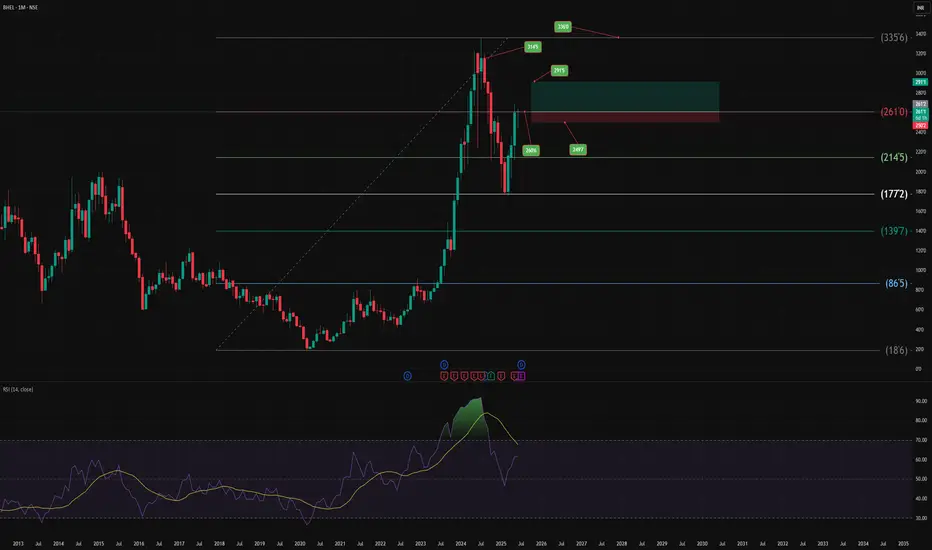
BHEL, Monthly chart analysis.Range-bound bounce: The chart shows a rebound from the ~₹250 support zone toward the key resistance around ~₹261–₹262. A clean breakout above ₹262–₹265 would confirm bullish continuation.
A right setup to enter a paper trade.
Not an SEBI registered RA.
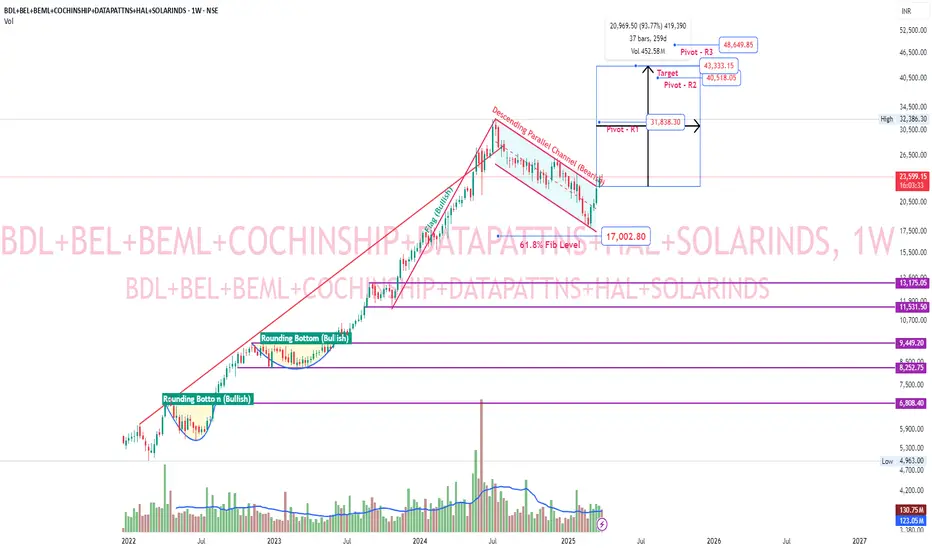
Aerospace & Defence bullish flag breakoutCreated custom index with following scrips. BDL, BEL, BEML, COCHINSHIP, DATAPATTNS, HAL, SOLARINDS. These are some major aerospace-defence companies. This custom index gave a bullish flag breakout. Huge upside potential based on flag pole as target. Pivot R1 itself has approximately 34.5% upside potential.
BHEL#BHEL
The company has just posted stellar earning this quarter, we have got a positive earning from the company after 5 consecutive negative earnings. The stock price of the company is still down 30 percent from its highs.
I fundamentally believe in the sectors the company is working on and after strong financial result this quarter BHEL has turned a buy on dips for me. I had previously shared a long term investment analysis on BHEL, if you already have a position on BHEL higher than its price currently I would suggest averaging.
BHEL still seems like a bullish investment opportunity for the future. Average at :
1) 230
2) Buy on every 5 to 10 percent dip.
Nearest target of *330.

BHEL Picture Abhi Baki Hai (The Show is not Over Yet)BHEL has been in impulse wave since 2020 & is completing Wave 3 of lager wave (3) so 1 more wave looks pending a close above 280 would be first sign of correction has ended & the recent low was wave 4 which ended in ABC in a irregular flat or we might make a new low but should end between 234-224 right now shorts are not a good idea in current wave structure.

NMDC CHART IS LOOKING BULLISHNMDC chart is turned bullish after trend line breakout. These all my views are personal, not a buy sell .

BEL IS LOOKING BULLISHBEL is looking bullish as its reacted from strong zone. If if closes above 295 more bullishness will be added. These all views are my personal and posting here only for educational purposes. These are not buy/sell recommendations. Better contact your personal financial advisor before go are investing into any stock.

check out my 4 sept 2024 analysis for more detailed info .👑BHEL👑 ₹270 Entry now active in BHEL , entry on the basis of fibbonacchiretracement , check out my 4 sept 2024 analysis for more detailed info .

BHEL was in sideways trend last week Stocks to Keep in Radar for Next Week
⏩ SBIN
⏩ NMDC
⏩ BHEL
⏩ DLF
BHEL is in corrective moce after making recenrt highs
If sustains above 300 level, it may try to test recent highs
However in case of Bearish pattern at higher level, it may come back to prev week's range
Important downside support is around 280 & then 270 level
whereas upside hurdle is aroud 320 level
*Election Results can create Volatility in the Maket
Keep Tracking Charts
*For Educational Purpose
Learn & Practice Price Action setups


BHEL: High Return Idea upto 52%BHEL is moving higher in impulse trend.
The Trend for BHEL is positive and the best of the trend is behind us.
Prices are currently moving in the form of wave 4 retracement.
Time cycle are the crucial areas of reversal and for Bhel it is due on 25th march.
So the up move has still more room to cover and we can expect the stock to reach towards the level of 300/320+ in the form of wave 5 by next 4/5 months.
Over short term dips can be used as accumulating opportunity with 200 as immediate support with a stop below 170 on weekly closing basis.

BHEL - SWING TRADE - 28th December #stocksBHEL (1D TF)
Swing Trade Analysis given on 28th December, 2023
Pattern: RECTANGLE BOX BREAKOUT
- Volume Spike Buildup at Resistance - Done ✓
- Breakout of Resistance - Done ✓
- Retracement & Consolidation - In Progress
#stocks #swingtrade #chartanalysis #priceaction #traderyte

BHEL LONG#BHEL is setting up.
If it crosses 52week High & monthly trendline also. It is ready to go 100 & above.
SL - stop loss
T1 - Target
W - weekly resistance/support
ATH - All time high
NSE:BHEL

BHEL: Riding the Reversal Wave? Chart Analysis Inside!Hello traders!
Today’s spotlight is on NSE:BHEL stock, which recently surged but is now flashing a reversal candle pattern. Here’s a quick rundown:
Rapid Ascension: BHEL experienced a swift climb, catching the market’s attention.
Reversal Indicators: A reversal candle pattern has emerged, suggesting a potential shift in the stock’s trajectory.
Chart Insights: Check out the chart for my marked levels around 220 to 230 – potential key zones.
Derivative Play: Derivative traders, consider exploring ITM PE options based on your research.
Due Diligence: Always a reminder to conduct your research before making any trading decisions.
Stay Informed: Let’s stay informed and navigate these market movements together. Your insights are valuable!
See you in the next post, traders!
Best regards,
Alpha Trading Station

BHEL Analysis(Flag and Pole)BHEL Analysis Weekly Timeframe
Flag and Pole Pattern in BHEL
Flag Breakout in BHEL
Bullish view on BHEL
Projected Target = 165.80
Stop Loss = Below 67.95

BHEL - a sure sign to go upNo further words …. Pic shows I am ready
But any chance of pullback on blue lines is a better price

BHEL F&P PATTERN BREAKOUTBHEL breaking F&P PATTERN
with good volume and rsi
trading above key ema
educational idea
