Part 5 Institutional Trading Types of Options
American vs. European Options
American Options: Can be exercised anytime before expiry.
European Options: Can only be exercised at expiry.
Index Options vs. Stock Options
Stock Options: Based on individual stocks (e.g., Reliance, Infosys).
Index Options: Based on indices (e.g., Nifty, Bank Nifty).
Weekly vs. Monthly Options
Weekly Options: Expire every Thursday (India).
Monthly Options: Expire on the last Thursday of the month.
Key Players in the Options Market
Option Buyers (Holders): Pay premium, have rights.
Option Sellers (Writers): Receive premium, have obligations.
Retail Traders: Use options for speculation or hedging.
Institutions: Use advanced strategies for income or risk management.
Billgates

AI-Powered Algorithmic Trading Introduction
Algorithmic trading—once a secret weapon of elite hedge funds—has evolved dramatically over the past decade. The new frontier in this space is AI-powered algorithmic trading, where artificial intelligence, machine learning (ML), and deep learning algorithms are reshaping how markets are analyzed, trades are executed, and profits are optimized.
As financial markets become increasingly data-driven, traders are now leveraging AI to process billions of data points in real time, uncover hidden patterns, and make faster, more precise decisions. The rise of AI in trading isn’t just evolution—it’s a full-scale revolution.
This article explores the depths of AI-powered algorithmic trading, its core mechanisms, real-world applications, benefits, challenges, and its role in shaping the future of financial markets.
1. Understanding Algorithmic Trading
Algorithmic trading, also known as algo-trading or automated trading, uses computer programs to execute trades based on pre-defined instructions such as timing, price, volume, or other mathematical models.
Traditionally, these rules were hard-coded and relied on historical data and technical indicators. The goal? Eliminate human emotion, speed up execution, and exploit even the smallest market inefficiencies.
Key Benefits:
Faster trade execution
Reduced transaction costs
Improved accuracy and consistency
Lower human intervention
While algorithmic trading alone brought efficiency, adding AI takes it to a new level by making the system adaptive, predictive, and context-aware.
2. What Is AI-Powered Algorithmic Trading?
AI-powered algorithmic trading refers to the integration of artificial intelligence, machine learning, and natural language processing (NLP) into the trading algorithm’s decision-making process.
What Makes It Different?
Self-learning: AI systems can learn from data and adapt their models.
Real-time processing: Ability to handle massive data streams instantly.
Non-linear modeling: Understand complex relationships traditional algorithms can’t capture.
Rather than merely following pre-programmed rules, AI algorithms can observe, learn, and evolve, making them far superior in today’s volatile and complex markets.
3. How AI Transforms Trading Strategies
AI enhances every stage of the trading lifecycle:
a. Data Analysis
Structured data: Price, volume, technical indicators
Unstructured data: News articles, social media sentiment, earnings calls
AI can process these varied data types, allowing traders to identify signals that would otherwise remain hidden.
b. Signal Generation
Using ML models such as:
Decision Trees
Random Forest
Support Vector Machines (SVM)
Neural Networks
These models detect patterns and forecast potential price movements with high precision.
c. Trade Execution
AI algorithms optimize order routing using reinforcement learning. They adapt to changing liquidity, volatility, and bid-ask spreads to minimize slippage and transaction costs.
d. Risk Management
AI models assess risk dynamically, adjusting portfolio positions in real time based on:
VaR (Value at Risk)
Tail risk
Black swan events
Correlations across asset classes
4. Machine Learning Models in Trading
AI trading models typically rely on supervised, unsupervised, and reinforcement learning techniques.
a. Supervised Learning
Trained on labeled historical data to predict future outcomes:
Linear regression for price prediction
Classification models to label bullish or bearish signals
b. Unsupervised Learning
Used for anomaly detection, pattern discovery, and clustering:
Detecting fraud or irregular trading behavior
Grouping stocks with similar behavior (sector rotation)
c. Reinforcement Learning
The model learns through trial and error. It’s particularly useful in:
Trade execution strategies
Portfolio optimization
Dynamic hedging
Notably, reinforcement learning has been central to deep reinforcement learning bots—like those used by top quant hedge funds.
5. Natural Language Processing (NLP) in Trading
NLP is revolutionizing sentiment analysis and event-driven trading. AI systems can now:
Analyze financial news and extract sentiment
Scan Twitter feeds for market-moving chatter
Interpret central bank statements or earnings reports
Example:
A sentiment score can be assigned to a company based on news, which can then influence trade decisions. If positive sentiment coincides with technical strength, the system may go long.
6. Real-World Applications
AI-powered algorithmic trading is already used by:
a. Hedge Funds & Institutions
Firms like Renaissance Technologies, Two Sigma, Citadel, and Bridgewater use AI for market prediction and automated trading across equities, forex, and commodities.
b. Retail Trading Platforms
Platforms like QuantConnect, Kavout, and Trade Ideas offer AI-backed strategy builders for individual traders.
c. High-Frequency Trading (HFT)
AI reduces latency, improves arbitrage, and enhances quote-matching in microseconds.
d. Robo-Advisors
While not trading-focused, robo-advisors like Wealthfront or Betterment use AI for portfolio management, rebalancing, and tax-loss harvesting.
7. Case Studies: AI in Action
Case Study 1: JPMorgan’s LOXM
JPMorgan launched LOXM, an AI-powered trading engine, designed for high-speed execution of large equity trades in Europe. LOXM uses historical and real-time data to minimize market impact and improve execution quality.
Case Study 2: BlackRock’s Aladdin
BlackRock’s Aladdin platform uses AI to manage trillions in assets. It helps in portfolio risk assessment, trade execution, and compliance—all using AI-driven analytics.
Case Study 3: Sentiment-Based Trading at Bloomberg
Bloomberg terminals offer NLP-based sentiment scores derived from news headlines. These scores can be integrated into algorithmic models for smarter trade triggers.
8. Benefits of AI-Powered Trading
✅ Speed & Efficiency
AI can make trading decisions in milliseconds, faster than any human or traditional algorithm.
✅ Accuracy
AI improves signal-to-noise ratio by filtering out irrelevant data and focusing on predictive patterns.
✅ Emotion-Free Trading
AI doesn’t panic, overtrade, or get greedy. It sticks to statistical logic, improving consistency.
✅ Scalability
An AI model can be deployed across multiple assets, strategies, and geographies with minimal incremental cost.
✅ Adaptive Learning
AI continues to improve itself over time—something rule-based models can't do.
9. Challenges and Risks
Despite its promise, AI-powered trading faces several challenges:
❌ Black Box Problem
AI models, especially deep learning ones, lack transparency. Traders may not fully understand why a decision was made, which creates risk in highly regulated environments.
❌ Overfitting
AI can sometimes memorize historical patterns rather than generalize them, leading to poor real-world performance.
❌ Data Bias
Garbage in, garbage out. If the training data is flawed or biased, the model will inherit those flaws.
❌ Flash Crashes & Cascading Failures
AI systems can amplify volatility when multiple bots react simultaneously to the same signal, triggering flash crashes.
❌ Regulatory Scrutiny
Regulators are still catching up. The opacity and complexity of AI models raise concerns around market manipulation and unfair advantages.
10. The Future of AI in Trading
a. Explainable AI (XAI)
Future models will be more transparent and interpretable, helping traders understand decision-making and comply with regulations.
b. Quantum Computing Integration
Quantum algorithms may further accelerate AI model training, enabling real-time analysis of massive datasets.
c. AI-Powered ESG Trading
Traders are increasingly factoring in environmental, social, and governance (ESG) metrics. AI can analyze non-financial data like sustainability reports or social sentiment.
d. Democratization of AI Tools
No longer exclusive to hedge funds, AI trading platforms are being made accessible to retail traders, thanks to cloud computing and open-source frameworks.
e. Collaborative AI Models
Swarm AI or hybrid models combining human intuition with machine precision will likely define the next generation of trading.
Conclusion: The Future Is Now
AI-powered algorithmic trading is not a futuristic dream—it’s today’s reality. From institutional behemoths to nimble retail traders, those who embrace AI are gaining a decisive edge in markets that reward speed, insight, and adaptability.
But success doesn’t come just from deploying fancy models. It requires a deep understanding of both markets and machine learning, a robust data infrastructure, ethical practices, and a sharp eye for evolving risks.
India’s SME IPO BoomIntroduction
Over the last few years, India’s stock market has witnessed a dramatic surge in initial public offerings (IPOs) from the Small and Medium Enterprises (SME) sector. In 2024 and 2025, SME IPOs have become one of the most sought-after investment themes among retail investors, High-Net-Worth Individuals (HNIs), and even seasoned traders. What once was a niche corner of the financial market has now taken center stage, with hundreds of companies getting listed and raising capital from the public.
However, beneath the glitz of multi-bagger returns and oversubscription records lies a highly volatile, high-risk zone that demands careful scrutiny. This article explores the India SME IPO boom—its drivers, opportunities, pitfalls, investor psychology, regulatory landscape, and long-term sustainability. It unpacks the high-risk, high-reward nature of these offerings and provides insight into how investors can navigate this evolving frontier.
1. What is an SME IPO?
Before diving into the boom, it's essential to understand what SME IPOs are.
An SME IPO is a public issue by a Small or Medium Enterprise—defined under government and SEBI guidelines—seeking to raise capital by listing on a stock exchange. Unlike mainboard IPOs, which cater to large-cap companies, SME IPOs are specifically designed for businesses with modest turnover and market capitalization.
Key characteristics:
Listed on separate SME platforms like NSE Emerge or BSE SME
Minimum application size is generally higher (₹1-2 lakh)
Lower compliance and listing requirements
Typically have post-issue market caps under ₹25 crore
2. Why the SME IPO Boom Now?
Several factors have converged to create the current SME IPO wave:
a) Bullish Retail Sentiment
Retail investors, flush with liquidity and optimism, are hunting for quick profits. The success of earlier SME listings—some delivering 5x–10x returns—has led to FOMO (Fear of Missing Out).
b) Ease of Listing & SEBI Norms
Over the past decade, SEBI has streamlined the process for SMEs to go public. Companies now face lower costs, fewer disclosure norms, and quicker approvals, encouraging many to test the IPO waters.
c) High Liquidity in Broader Markets
With India’s market cap crossing $4 trillion and broader indices booming, a trickle-down effect is felt in smaller companies. Many entrepreneurs see the IPO route as a viable way to raise growth capital.
d) Strong Promoter Appetite
SMEs often use IPOs to:
Repay debt
Fund working capital
Increase brand visibility
Offer exit to early investors
3. By the Numbers: A Snapshot of the Boom
Here are some eye-opening statistics:
Metric 2023 2024 (Est.)
SME IPOs launched 146 200+
Funds raised ₹2,600 crore ₹3,800+ crore
Average oversubscription 120x 150x+
No. of multi-baggers (2x+) 50+ 70+
Popular names like Droneacharya Aerial, Srivasavi Adhesive, and E Factor Experiences have gained cult-like status among IPO investors.
4. The Allure: Why Investors Are Hooked
SME IPOs are like financial lottery tickets with much higher odds than regular IPOs. Here’s what attracts investors:
a) Massive Listing Gains
Many SME stocks debut with 100–500% gains on listing day. This immediate return attracts momentum traders and short-term players.
b) Low Institutional Participation
With limited or no QIB allotments, retail and HNI investors dominate, making the market highly sentiment-driven.
c) Under-the-Radar Opportunities
Some SMEs operate in niche or sunrise sectors—EVs, drones, niche manufacturing—where the potential is untapped.
d) Buzz on Social Media & Finfluencers
Telegram groups, Twitter/X threads, and YouTube channels hype SME IPOs, creating speculative frenzy.
5. Risks Involved: The Flip Side of the Boom
While the returns look glamorous, SME IPOs carry considerable risks:
a) Lack of Business Transparency
Many SMEs have:
Limited operational history
Unverified or unaudited financials
Unclear business models
Due diligence is often difficult.
b) Low Liquidity Post-Listing
Trading volumes tend to vanish post-listing. Investors may get trapped in illiquid counters with no exit route.
c) Overvaluation Risk
Many IPOs are priced at exorbitant P/E multiples based on speculative projections. When hype fades, stock prices crash.
d) Pump and Dump Concerns
Several SME IPOs exhibit signs of manipulation—over-subscription via connected entities, sudden spikes, followed by sharp falls.
e) Lack of Research Coverage
SMEs don’t attract analyst attention, leaving investors flying blind.
6. Real-Life Examples: Successes and Warnings
Success Story: Droneacharya Aerial
IPO Price: ₹54
Listing Price: ₹102
Current Price (2025): ₹425
Sector: Drone Technology
Outcome: Massive 8x return in under 2 years
Cautionary Tale: XYKOT Oils Ltd (Hypothetical)
IPO Price: ₹90
Listing Price: ₹150
Current Price: ₹34
Sector: Agro-based oil products
Outcome: Illiquid, sharp post-IPO correction
7. Who Should Invest? And Who Should Avoid?
✅ Suitable For:
High-risk-tolerant investors
Experienced IPO traders
HNIs who can deploy funds in multiple issues
Portfolio diversifiers with small allocation to high-risk plays
❌ Should Avoid:
Conservative investors
Retirees or income-focused investors
Those without access to solid research
Traders who can't monitor positions actively
8. How to Analyze an SME IPO
Here’s a checklist to assess the credibility of an SME IPO:
Parameter What to Look For
Promoter Track Record Any prior frauds? Industry experience?
Financials Are revenues growing? Are margins stable?
Sector Sunrise sector or saturated industry?
Peer Comparison How is it priced vs. similar listed peers?
Use of Proceeds Will the capital be used for growth or debt repayment?
Market Making Is there a good market maker with liquidity assurance?
Allotment Data Who’s applying—only retailers or HNIs too?
9. Role of SEBI and Exchanges
SEBI, BSE, and NSE have taken several steps to ensure the SME segment remains healthy:
Mandatory market makers to maintain liquidity for 3 years
Migration path to mainboard for companies that grow past ₹25 crore market cap
Minimum 50 allottees in IPO to ensure broad participation
Periodic audits and disclosures
Still, enforcement remains a challenge in certain cases.
10. The HNI Mania: IPO Leverage Craze
One of the biggest trends in SME IPOs is the explosion in HNI funding, where investors borrow money from NBFCs or brokers to apply for large IPO lots.
Interest Cost: 7–15% annually, recovered if listing gains are strong
Margin Funding: Investors use 1:4 to 1:10 leverage
Risks: A poor listing can erode capital, especially when funded
This HNI frenzy has caused oversubscriptions to hit 300x–800x levels, pushing allotments to lottery-like odds.
Conclusion
India’s SME IPO boom is one of the most exciting developments in the market today. It represents the rise of entrepreneurship, capital market democratization, and a vibrant risk-taking investor class. But behind the glitter lies real risk—of capital erosion, volatility, and corporate governance failures.
For the smart investor, SME IPOs can be a treasure chest of high-alpha opportunities, if navigated with discipline, due diligence, and a level head. For the reckless speculator, it could become a graveyard of broken bets.
Like any high-reward game, it’s not about avoiding risk—it’s about managing it wisely.

AI-Powered Algorithmic TradingIntroduction
Financial markets are evolving faster than ever. Amidst volatile price action, split-second decisions, and the growing complexity of data, AI-powered algorithmic trading has emerged as a game-changer. No longer limited to Wall Street giants, this technology is now reshaping how institutions, hedge funds, and even retail traders operate.
In this article, we’ll take a deep dive into what AI-powered algorithmic trading is, how it works, the technologies behind it, its benefits and risks, and what the future holds for this rapidly growing field.
1. What is AI-Powered Algorithmic Trading?
Algorithmic trading, also known as algo trading, refers to the use of pre-programmed instructions or algorithms to execute trades. These algorithms are based on various parameters such as price, volume, timing, or other mathematical models.
When combined with Artificial Intelligence (AI) and Machine Learning (ML), these trading systems evolve to become smarter and more adaptive. They can analyze vast datasets, learn from past patterns, adapt to changing market dynamics, and make autonomous trading decisions without human intervention.
In simple terms: AI-powered trading doesn’t just follow rules—it learns, adapts, and evolves.
2. Core Components of AI-Powered Algo Trading
To understand how AI-powered trading works, let’s break down its key components:
a. Algorithms
These are step-by-step instructions for performing trading tasks. They include strategies like mean reversion, trend following, momentum, arbitrage, etc.
b. Artificial Intelligence (AI)
AI allows the system to "think" like a human trader. It can make decisions based on real-time and historical data, even in uncertain or volatile conditions.
c. Machine Learning (ML)
ML models analyze historical data to identify patterns. These models improve over time through training and backtesting.
d. Natural Language Processing (NLP)
Used to analyze news articles, earnings calls, tweets, and other textual content to gauge market sentiment.
e. Big Data & Alternative Data
AI systems process both traditional data (price, volume) and alternative data (social media, satellite images, weather data, etc.) to gain a competitive edge.
3. How AI Algo Trading Works
Let’s walk through the typical process:
Step 1: Data Collection
Market data (price, volume, order book)
Fundamental data (financial statements, earnings)
Alternative data (news, social media, weather)
Step 2: Data Preprocessing
Cleaning and normalizing data to remove noise.
Feature engineering to identify key indicators or patterns.
Step 3: Model Training
Using ML algorithms like decision trees, neural networks, or reinforcement learning.
Backtesting against historical data to test the strategy’s performance.
Step 4: Strategy Deployment
The AI model goes live and starts executing trades.
Models adjust dynamically to new market conditions.
Step 5: Performance Monitoring & Optimization
Regularly track metrics like Sharpe ratio, win rate, drawdown, etc.
Continuously retrain the model with new data.
4. Key AI Techniques Used in Trading
a. Supervised Learning
Algorithms learn from labeled historical data.
Used for predicting price movements, stock returns, etc.
b. Unsupervised Learning
Detects hidden patterns or clusters in data.
Used for anomaly detection, regime shifts, market segmentation.
c. Reinforcement Learning
The AI "agent" learns by interacting with the environment.
Used for optimal order execution and dynamic strategy selection.
d. Deep Learning
Involves neural networks with multiple layers.
Can recognize complex, nonlinear relationships in price action.
5. Common AI Trading Strategies
1. Sentiment-Based Trading
Uses NLP to analyze news headlines, social media, analyst reports.
Determines whether the overall sentiment is bullish or bearish.
2. Statistical Arbitrage
Finds pricing inefficiencies between correlated assets using AI.
AI can execute thousands of trades per second to capture micro profits.
3. Momentum & Trend Following
AI models detect sustained price trends and ride the momentum.
Often used with technical indicators like moving averages or RSI.
4. High-Frequency Trading (HFT)
Involves extremely fast trades using AI-powered systems.
Profits are made on minuscule price changes across thousands of trades.
5. Mean Reversion
AI identifies assets that deviate from historical norms and expects a reversion.
Works well in range-bound markets.
6. Advantages of AI in Algorithmic Trading
✅ Speed and Efficiency
AI systems can analyze millions of data points in seconds and execute trades faster than humans can blink.
✅ Emotionless Trading
AI removes human biases like fear, greed, and overconfidence. It sticks to the strategy with discipline.
✅ Scalability
AI can manage hundreds of trading strategies and thousands of assets simultaneously across global markets.
✅ Adaptive Learning
Unlike static models, AI-based systems adapt to new market regimes, breaking news, and evolving trends.
✅ Backtesting and Risk Management
AI can simulate thousands of market scenarios to stress test strategies and optimize risk-reward profiles.
The Future of AI in Trading
Here’s what the future likely holds:
🔮 Real-Time AI Decision-Making
AI will increasingly be used not just for execution but for strategy generation in real time.
🔮 Explainable AI (XAI)
Efforts are underway to make AI decision-making more transparent and interpretable to regulators and users alike.
🔮 Quantum AI Trading
As quantum computing matures, it could take algorithmic trading to a whole new level—analyzing vast datasets in milliseconds.
🔮 AI in Decentralized Finance (DeFi)
AI is now being explored in crypto and DeFi ecosystems to enhance automated trading, risk assessment, and portfolio balancing.
Getting Started: Tools for Aspiring AI Traders
If you're interested in building your own AI trading system, here are some tools and platforms:
👨💻 Programming Languages
Python (most popular)
R
C++ (for high-speed systems)
🧠 AI Libraries
TensorFlow, PyTorch, Scikit-learn, Keras
📊 Backtesting Platforms
QuantConnect
Backtrader
Zipline
📈 Data Providers
Alpaca, Polygon.io, Yahoo Finance, Quandl
Conclusion
AI-powered algorithmic trading is no longer a futuristic concept—it’s the present and rapidly becoming the norm in financial markets. From hedge funds to retail traders, those who leverage AI effectively are gaining a decisive edge.
However, it's not a magic wand. While AI brings speed, efficiency, and adaptability, it also introduces complexity, risk, and ethical questions.
Volume Profile & Market Structure AnalysisIntroduction
In the dynamic world of financial markets, traders constantly seek tools and methodologies that provide an edge. Two powerful and complementary concepts in technical analysis are Volume Profile and Market Structure Analysis. Together, they offer a multi-dimensional view of market behavior, revealing where market participants are most active and how price reacts at key levels.
This guide dives deep into both tools, explaining their principles, interrelation, and how traders can practically apply them to enhance trade decisions.
Part 1: Understanding Volume Profile
What Is Volume Profile?
Volume Profile is an advanced charting study that shows trading activity over a specified time period at specified price levels. Unlike traditional volume indicators that display volume by time (per bar), Volume Profile displays volume by price.
It helps traders understand:
Where the majority of trading volume occurred
Which prices attracted the most attention
Potential support and resistance zones
Key Components of Volume Profile
Point of Control (POC):
The price level with the highest traded volume during the selected period. It indicates the fairest price—where buyers and sellers agreed the most.
High Volume Nodes (HVN):
Areas where volume spikes significantly. These zones often act as magnets for price.
Low Volume Nodes (LVN):
Areas with little trading activity. Price tends to reject these zones or move through them quickly due to lack of interest.
Value Area (VA):
The price range within which 70% of volume was traded. It gives a sense of where the market believes value lies.
Volume Profile Shapes:
D-shape (Balanced Market): Even distribution around the POC. Expect range-bound behavior.
P-shape (Bullish Profile): Indicates short covering or accumulation.
b-shape (Bearish Profile): Reflects long liquidation or distribution.
Benefits of Volume Profile
Highlights institutional activity zones
Defines precise entry/exit areas
Identifies strong support/resistance
Filters out low-probability trades
Part 2: Understanding Market Structure Analysis
What Is Market Structure?
Market Structure is the framework of how price moves—trending, consolidating, breaking out, or reversing. It defines the pattern of highs and lows and helps determine the overall direction of the market.
Key Elements of Market Structure
Swing Highs and Lows:
Higher Highs (HH) and Higher Lows (HL): Uptrend
Lower Highs (LH) and Lower Lows (LL): Downtrend
Break of Structure (BoS):
A significant break of a previous swing high or low, signaling trend continuation or change.
Change of Character (ChoCh):
The first signal that a trend may reverse. For example, in an uptrend, if the price fails to make a higher high and drops below the last higher low.
Liquidity Zones:
Areas where stop-loss orders are commonly placed. These can become targets for price.
Order Blocks:
Last bullish/bearish candle before a strong move. These are often zones of institutional entries.
Market Phases:
Accumulation: Range-bound price action at the bottom.
Markup: Uptrend begins.
Distribution: Price consolidates near the top.
Markdown: Downtrend follows.
Part 3: Combining Volume Profile with Market Structure
Why Combine Both?
Used together, Volume Profile and Market Structure offer a layered understanding of price action. While market structure defines the direction and nature of price moves, Volume Profile identifies the strength and conviction behind those moves.
Synergistic Insights
Validating Breakouts with Volume:
A break of market structure (BoS) with high volume at the breakout level (confirmed by Volume Profile) is more reliable.
Refining Entry/Exit:
Use order blocks and structure points to define trade direction; Volume Profile helps fine-tune entry within these zones.
Avoiding False Moves:
Price may appear to break a structure but returns if there’s no volume support—Volume Profile helps filter these traps.
Identifying Smart Money Activity:
Institutions often build positions at HVNs and manipulate price around LVNs. Structure helps spot their intent; volume confirms their footprints.
Part 4: Practical Trading Applications
1. Trading Reversals
Strategy:
Identify a ChoCh (change of character)
Validate with low volume at new highs/lows (showing exhaustion)
Look for entry at the order block aligned with the Value Area Low (VAL) or High (VAH)
Example:
In an uptrend, a lower high forms and breaks the prior higher low. Volume Profile shows declining volume at new highs → Confirm reversal.
2. Trading Breakouts
Strategy:
Wait for price to break a consolidation zone
Ensure breakout happens through LVN (low resistance)
Confirm increasing volume above POC
Entry:
Retest of broken zone aligned with order block or POC.
3. Trend Continuation (Pullback Entries)
Strategy:
Identify trending market using HH/HL or LL/LH
Wait for pullback to HVN or Value Area
Look for confluence with bullish/bearish order block
Confirmation:
Rejection candle with volume absorption at the node.
4. Scalping in Ranges
Strategy:
Use intraday Volume Profile to define value area
Fade moves from VAH to VAL (range-bound play)
Confirm with microstructure shifts (e.g., lower time frame ChoCh)
Part 5: Advanced Concepts
1. Volume Profile Timeframes
Daily/Weekly Profiles: Best for swing trades.
Intraday (15m/30m): Best for day trading and scalping.
2. Volume Profile vs TPO Profile
TPO (Time Price Opportunity) adds time dimension (Market Profile)
Volume Profile is volume-focused—better for spotting real order flow
3. Liquidity Sweeps and Smart Money
Price often sweeps above a swing high to trigger stops, then reverses
Volume Profile helps spot whether the sweep was real (high volume) or a fakeout (low volume)
4. Auction Market Theory
Market is an auction: buyers and sellers find value via volume
Imbalance leads to trend, balance leads to consolidation
Part 6: Tools & Platforms for Volume Profile & Market Structure
Popular Platforms
TradingView: Has built-in volume profile tools (fixed range, visible range)
Sierra Chart & NinjaTrader: Advanced volume analysis
ThinkOrSwim: Offers Volume Profile and Market Profile
Bookmap: For real-time order flow + volume bubbles
Recommended Indicators
Volume Profile (fixed/visible)
Session Volume (for intraday)
Market Structure tools (e.g., Swing High/Low auto-detection)
Order Block indicators (custom or manual markups)
Conclusion
Volume Profile and Market Structure Analysis are individually powerful but together form a holistic trading approach that aligns price, volume, and institutional behavior. Mastering these tools allows traders to:
Identify high-probability trade zones
Detect institutional footprints
Avoid false breakouts
Time entries and exits with greater precision
As with any strategy, the key is practice, backtesting, and developing a system that fits your risk tolerance and trading style. Combined, these tools offer a potent framework for navigating modern markets with clarity and confidence.
Part8 Trading Masterclass Taxes on Options Trading (India)
Income Head: Classified under business income.
Tax Rate: Taxed as per income slab or presumptive basis.
Audit: Required if turnover exceeds ₹10 crore or loss is claimed.
GST: Not applicable to retail option traders.
Always consult a CA or tax expert for compliance and accurate filing.
Risk Management in Options
Key rules for managing risk:
Position Sizing: Never risk more than 1–2% of capital per trade.
Diversification: Avoid putting all capital in one strategy.
Stop Losses: Predefined exit points reduce emotional trading.
Avoid Illiquid Contracts: Wider bid-ask spreads hurt profitability.
Avoid Overleveraging: Leverage can magnify both gains and losses.

Trading Masterclass Options Trading Strategies
For Beginners:
Buying Calls: Bullish on the stock/index.
Buying Puts: Bearish on the stock/index.
For Intermediate Traders:
Covered Call: Holding the stock + selling a call for income.
Protective Put: Holding stock + buying a put to limit losses.
For Advanced Traders:
Iron Condor: Neutral strategy with limited risk/reward.
Straddle: Buy a call and put at the same strike; profits from big moves.
Strangle: Buy a call and put at different strikes.
Spreads:
Bull Call Spread: Buy a lower call, sell a higher call.
Bear Put Spread: Buy a higher put, sell a lower put.
These strategies balance risk and reward across different market outlooks.

Part4 Institution Trading Types of Options
American vs. European Options
American Options: Can be exercised anytime before expiry.
European Options: Can only be exercised at expiry.
Index Options vs. Stock Options
Stock Options: Based on individual stocks (e.g., Reliance, Infosys).
Index Options: Based on indices (e.g., Nifty, Bank Nifty).
Weekly vs. Monthly Options
Weekly Options: Expire every Thursday (India).
Monthly Options: Expire on the last Thursday of the month.

Part 4 Trading InstitutionHow Options Work
Example of a Call Option
Suppose a stock is trading at ₹100. You buy a call option with a ₹110 strike price, expiring in 1 month, and pay a ₹5 premium.
If the stock rises to ₹120: Your profit is ₹120 - ₹110 = ₹10. Net gain = ₹10 - ₹5 = ₹5.
If the stock stays at ₹100: The option expires worthless. Your loss = ₹5 (premium).
Example of a Put Option
Suppose the same stock is ₹100, and you buy a put option with a ₹90 strike price for ₹5.
If the stock drops to ₹80: Your profit = ₹90 - ₹80 = ₹10. Net gain = ₹10 - ₹5 = ₹5.
If the stock stays above ₹90: The option expires worthless. Your loss = ₹5.

Part 6 Learn Institution Trading1. Introduction to Options Trading
Options trading is a fascinating and powerful segment of the financial markets. Unlike buying stocks directly, options offer flexibility, leverage, and a wide variety of strategic choices. But with that power comes complexity and risk.
What Are Options?
An option is a contract that gives the buyer the right (but not the obligation) to buy or sell an underlying asset (like a stock, index, or ETF) at a specific price (strike price) before or on a specific date (expiry date).
Two Types of Options:
Call Option – Right to Buy
Put Option – Right to Sell
🧩 2. The Key Components of an Option Contract
Before diving into strategies and profits, let’s break down the essential parts of any option:
Component Description
Underlying Asset The stock, index, or commodity the option is based on
Strike Price The pre-defined price at which the buyer can exercise the option
Expiry Date The date on which the option contract expires
Premium The price paid by the buyer to purchase the option

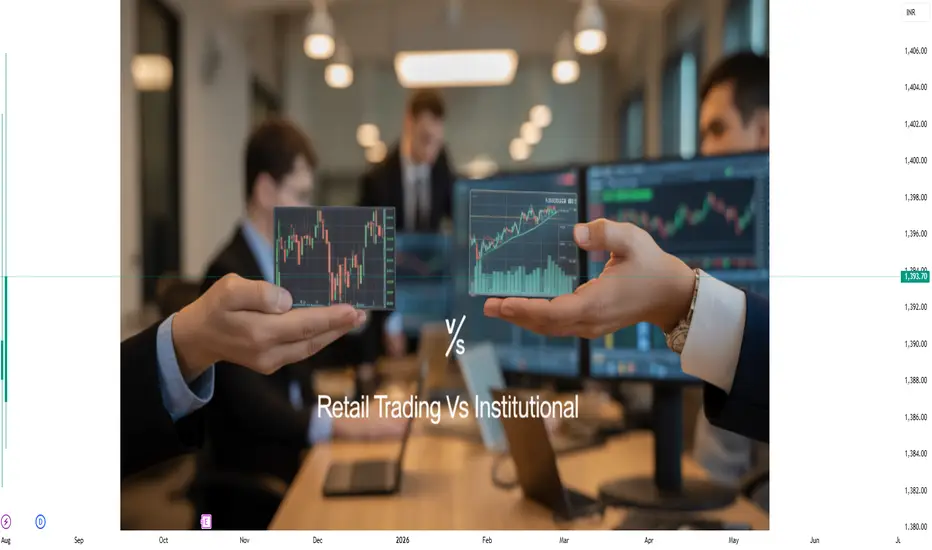
Retail Trading vs Institutional TradingIntroduction
The financial markets have evolved into complex ecosystems where various participants operate with diverse objectives, capital sizes, and strategies. Among the most significant of these players are retail traders and institutional traders. While both engage in the buying and selling of financial assets such as stocks, bonds, derivatives, and currencies, their influence, behaviors, tools, and market access differ substantially.
This comprehensive article explores the nuanced differences between retail and institutional trading, shedding light on their advantages, limitations, and the evolving dynamics of global financial markets.
1. Understanding Retail and Institutional Traders
Retail Traders
Retail traders are individual investors who buy and sell securities for their personal accounts. They typically operate through online brokerage platforms and use their own money. These traders range from beginners experimenting with small amounts of capital to seasoned individuals managing sizable portfolios.
Key Characteristics:
Small to medium trade sizes
Access via retail brokerage accounts (Zerodha, Upstox, Robinhood, etc.)
Limited resources and data access
Mostly short- to medium-term strategies
Emotion-driven decision-making is common
Influenced by news, social media, and trends
Institutional Traders
Institutional traders, on the other hand, are professionals trading on behalf of large organizations such as:
Mutual funds
Pension funds
Hedge funds
Insurance companies
Sovereign wealth funds
Banks and proprietary trading desks
Key Characteristics:
Trade in large volumes (millions or billions)
Use high-level algorithmic and quantitative models
Employ teams of analysts and economists
Have access to privileged market data and direct market access (DMA)
Trade globally across asset classes
Execute trades with minimal market impact using advanced strategies
2. Capital & Trade Volume
Retail Traders
Retail traders operate with relatively small capital. Depending on the geography and economic status of the individual, a retail account may hold anywhere from a few hundred to a few lakh rupees or a few thousand dollars. Their trades typically involve smaller quantities, which means their impact on the broader market is minimal.
Institutional Traders
Institutions move massive amounts of capital, often in the hundreds of millions or even billions. Because such large orders can distort market prices, institutions split their trades into smaller chunks using algorithms and dark pools to avoid slippage and reduce impact costs.
3. Tools & Technology
Retail
Retail platforms have improved significantly over the last decade, offering:
User-friendly interfaces
Real-time charts
Technical indicators
News integration
Mobile apps
However, they lack the speed, depth, and accuracy of institutional platforms. Most retail traders use:
Discount brokers (e.g., Zerodha, Robinhood)
Retail APIs
Community forums (e.g., TradingView, Reddit)
Limited access to Level 2 data
Institutional
Institutions use high-frequency trading (HFT) platforms and low-latency networks. Tools include:
Bloomberg Terminals
Reuters Eikon
Custom-built execution management systems (EMS)
Direct market access (DMA)
High-frequency data feeds
Co-location near exchanges for speed advantage
They also use advanced machine learning models, AI-based analytics, and massive databases for fundamental and alternative data (like satellite images or credit card data).
4. Strategy & Trading Style
Retail
Retail traders often rely on:
Technical analysis
Chart patterns
Price action
Social media sentiment
Short-term scalping or swing trades
Due to lack of resources, retail traders are more susceptible to emotional decisions, overtrading, and following the herd.
Institutional
Institutions use a diverse mix of strategies, such as:
Statistical arbitrage
Event-driven strategies
Global macro
Quantitative models
Portfolio optimization
Algorithmic execution
Market making and hedging
They combine fundamental analysis, quant models, and econometric forecasting, managing risk in far more sophisticated ways.
5. Market Access & Order Execution
Retail
Retail traders execute orders through brokers who route trades through stock exchanges. These orders often face:
Latency delays
Higher spreads
No access to wholesale prices
Some brokers use Payment for Order Flow (PFOF), which may slightly impact execution quality.
Institutional
Institutions enjoy:
Direct Market Access (DMA)
Dark pools for anonymous large orders
Block trading facilities
Access to interbank FX markets, OTC derivatives, and custom structured products
Execution is often automated via algorithms that optimize for speed, price, and impact.
6. Regulation and Compliance
Retail
Retail traders face limited regulatory burdens. While they must comply with basic Know Your Customer (KYC) and taxation norms, their trades are not scrutinized as closely as institutions.
Institutional
Institutions are heavily regulated, facing:
SEBI (India), SEC (USA), FCA (UK), and others
Mandatory reporting (e.g., Form 13F in the U.S.)
Audits and compliance frameworks
Risk management systems
Anti-money laundering (AML) and know-your-client (KYC) rules
Any violation can lead to massive fines or suspension.
7. Costs & Fees
Retail
Retail brokers now offer zero-commission trades for many products, but:
There are hidden costs in bid-ask spreads
Brokerage fees for options/futures still apply
Data fees, platform charges, and leverage costs may apply
Institutional
Institutions negotiate custom pricing with exchanges and brokers. Their costs include:
Execution fees
Custodial charges
Co-location fees
Quant infrastructure costs
Trading technology and development costs
However, their costs per trade are lower due to volume, and they may receive rebates from exchanges for providing liquidity.
8. Impact on Markets
Retail
Retail trading has grown massively post-2020, especially in India and the U.S. (Robinhood, Zerodha). While they may move small-cap or penny stocks, they rarely influence blue-chip stocks on their own.
However, coordinated action (e.g., GameStop short squeeze) showed that retail can disrupt markets when acting collectively.
Institutional
Institutions are primary drivers of market movements.
Their trades shape volume, volatility, and price trends
They influence index movements
Their strategies arbitrage mispricings, increasing market efficiency
They are market makers, liquidity providers, and long-term holders of capital.
Conclusion
While retail and institutional traders operate in the same financial markets, they play very different roles. Institutional traders, backed by massive capital, advanced tools, and strategic discipline, dominate the landscape. Retail traders, despite having fewer resources, bring agility, grassroots sentiment, and unexpected market force—especially in the age of social media.
The line between them is slowly blurring as retail gets smarter and better equipped, while institutions adapt to retail dynamics. The future will likely see greater collaboration, retail data monetization, and increased hybrid models (e.g., social trading, copy trading).
Inflation Nightmare Introduction: What Is the Inflation Nightmare?
Inflation is often described as a slow-burning fire in the economy, but when it accelerates uncontrollably, it becomes a nightmare — distorting prices, eroding purchasing power, and triggering unpredictable market reactions. Traders, investors, and policymakers all dread this scenario, as inflation doesn't just change the numbers — it reshapes the economic landscape. From commodity spikes and interest rate hikes to sector rotations and recession fears, inflation is a force no one can ignore.
This article explores the anatomy of an inflation nightmare, its impact on various asset classes, central bank responses, and how traders can navigate this storm.
1. The Anatomy of Inflation
Inflation refers to the general rise in the price level of goods and services over time. While moderate inflation is considered normal in a growing economy, hyperinflation or sustained high inflation poses significant threats.
Types of Inflation:
Demand-pull inflation: Too much money chasing too few goods.
Cost-push inflation: Rising input costs (e.g., oil, labor) drive up prices.
Built-in inflation: Wage-price spiral — workers demand higher wages to keep up with inflation, causing costs to rise further.
Stagflation: A toxic mix of high inflation and stagnant growth (e.g., 1970s U.S. economy).
2. Causes of the Modern Inflation Nightmare
a. Supply Chain Disruptions
The COVID-19 pandemic and geopolitical conflicts (e.g., Russia-Ukraine war) created bottlenecks in supply chains, leading to shortages and surging prices for essential goods like semiconductors, food, and energy.
b. Monetary Policy & Stimulus
Central banks flooded economies with easy money and stimulus packages, particularly in 2020–2021. Low interest rates and quantitative easing increased liquidity — but once demand returned, supply couldn’t keep up.
c. Energy & Commodity Spikes
Natural gas, oil, wheat, and metals saw explosive price rallies due to global shortages, sanctions, and war-related disruptions, feeding directly into CPI inflation.
d. Wage Pressures & Labor Shortages
Post-pandemic labor shortages pushed wages higher in developed economies, particularly in service and logistics sectors, adding fuel to inflation.
3. How Inflation Distorts Financial Markets
a. Equity Markets: Sector Rotation & Volatility
Growth stocks (especially tech) suffer due to rising interest rates lowering the present value of future earnings.
Value stocks (e.g., banks, energy, industrials) gain favor as they often benefit from higher rates or pricing power.
Consumer discretionary gets hit hard; consumers cut spending on non-essentials as prices rise.
b. Fixed Income: Bond Yields Surge
Inflation erodes the real returns of fixed-income securities.
Investors demand higher yields → bond prices fall.
Central banks raise benchmark interest rates, making existing bonds less attractive.
c. Commodities: Inflation Hedges
Gold, silver, oil, wheat, and copper surge during inflationary periods.
Traders flock to commodities as real assets that hold value when fiat currencies weaken.
d. Currency Markets: Dollar Dominance or Decline
Inflation differentials between countries impact currency strength.
A hawkish U.S. Fed can cause dollar appreciation, pressuring emerging market currencies and debt.
4. Central Banks vs. Inflation: A Battle of Credibility
When inflation surges, central banks become market movers. Their policies have enormous implications for all asset classes.
Key Tools:
Interest rate hikes: Make borrowing costlier → reduce demand.
Quantitative tightening (QT): Reduces liquidity in the system.
Forward guidance: Sets expectations for future policy moves.
Inflation Targeting & Credibility
Central banks like the U.S. Federal Reserve, ECB, and RBI aim for 2% inflation targets. When inflation consistently overshoots, credibility is at risk, potentially unanchoring expectations and accelerating inflation further.
Soft Landing vs. Hard Landing
Soft landing: Cooling inflation without triggering a recession.
Hard landing: Aggressive tightening causes economic contraction, job losses, and market crashes.
5. Inflation's Psychological Impact on Trading
a. Uncertainty & Volatility
Unpredictable inflation leads to whipsaw price action. A single CPI or PPI print can send indices soaring or crashing.
b. Changing Correlations
Traditional correlations (e.g., stocks up when bonds up) break down.
Traders must adapt quickly to new inter-market relationships.
c. Fear vs. Greed
Inflation triggers fear-driven trading, especially in leveraged positions like options or futures. This fuels intraday volatility and wider bid-ask spreads.
6. How Traders Can Survive the Inflation Nightmare
a. Watch the Data Closely
Key indicators:
CPI & Core CPI
PPI (Producer Price Index)
Wage growth
Commodity indices
PMIs & Retail Sales
Economic calendars become vital. “Macro data trading” becomes the norm, with markets swinging based on even minor surprises.
b. Focus on Inflation-Resistant Assets
Commodities: Gold, oil, agricultural products
TIPS: Treasury Inflation-Protected Securities
Dividend stocks with pricing power
Real estate/REITs in inflation-tolerant regions
c. Sector Rotation Strategy
Shift from rate-sensitive growth stocks to:
Energy
Basic materials
Industrial goods
Financials
d. Use Derivatives Strategically
Options allow hedging against downside volatility.
Commodity and bond futures help in speculating or hedging inflation trends.
Volatility products (e.g., VIX futures) can offer short-term profits during CPI days.
e. Position Sizing & Risk Management
High volatility demands tight stops, smaller positions, and more disciplined exits.
Leverage must be managed conservatively — inflation-driven moves can be fast and brutal.
7. Real-World Examples: Historical Inflation Nightmares
a. The 1970s U.S. Stagflation
Oil embargo + policy missteps = soaring inflation and unemployment.
Fed eventually raised interest rates to 20% under Paul Volcker, causing a recession but taming inflation.
b. Zimbabwe (2000s)
Hyperinflation reached 79.6 billion percent per month.
Currency collapsed, barter and USD became alternatives.
c. Turkey & Argentina (2018–2024)
Currency depreciation and loose monetary policy led to double- and triple-digit inflation.
Savings wiped out; capital flight intensified.
8. Inflation & Geopolitics: A Dangerous Mix
Inflation can topple governments. Rising food and fuel prices have historically triggered protests and revolutions.
It increases global inequality, disproportionately hurting the poor.
Inflation linked to war and sanctions becomes even harder to control, as seen in energy and grain prices during the Ukraine conflict.
Conclusion: Turning Nightmare into Opportunity
Inflation may be a nightmare for governments and central banks, but for savvy traders and investors, it can also present unique opportunities. The key is to stay informed, flexible, and disciplined. Understanding macroeconomic indicators, adjusting asset allocation, rotating sectors, and using hedging instruments are critical.

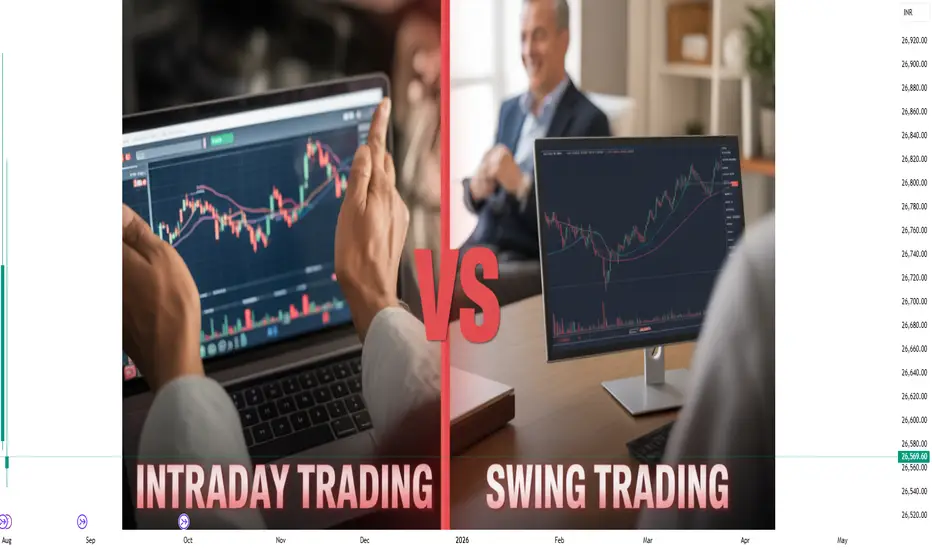
Intraday vs Swing Trading TechniquesTrading the financial markets is all about timing, strategy, and discipline. Among the most popular trading styles are Intraday Trading and Swing Trading—two techniques with distinct characteristics, goals, and risk profiles. While both aim to profit from short- to medium-term price movements, their approaches differ in terms of holding periods, analytical tools, risk management, and psychological demands.
This comprehensive guide explores the core principles, strategies, tools, and pros and cons of Intraday and Swing Trading, helping you determine which suits your goals and trading style best.
1. Understanding the Basics
Intraday Trading (Day Trading)
Definition: Intraday trading involves buying and selling securities within the same trading day. No positions are carried overnight.
Objective: Capitalize on small price movements using high frequency trades.
Holding Period: Minutes to hours (always closed by market close).
Markets Used In: Stocks, options, forex, futures, and indices.
Swing Trading
Definition: Swing trading is a strategy where positions are held for several days to weeks, aiming to capture price swings.
Objective: Benefit from medium-term trends and technical patterns.
Holding Period: Typically 2–10 days, sometimes longer.
Markets Used In: Equities, ETFs, forex, commodities, and crypto.
2. Key Differences Between Intraday and Swing Trading
Criteria Intraday Trading Swing Trading
Time Commitment High (Full-time or active daily) Moderate (Few hours per day)
Holding Duration Minutes to hours Days to weeks
Risk per Trade Lower (smaller moves, tight SL) Higher (wider SL for swings)
Return Potential Small gains per trade; adds up Bigger moves per trade
Stress Level High (quick decisions needed) Moderate (decisions after hours)
Tools Required Live charts, fast execution EOD analysis, less screen time
Capital Requirements Higher for active trading Moderate
3. Intraday Trading Techniques
A. Scalping
Goal: Capture small profits multiple times a day.
Strategy: Quick entries/exits based on tick or 1-min charts.
Tools: DOM (Depth of Market), momentum indicators (e.g., RSI, MACD), VWAP.
B. Momentum Trading
Goal: Ride strong directional moves caused by news or volume spikes.
Strategy: Enter when price breaks out of range on high volume.
Indicators: Moving averages, Bollinger Bands, volume analysis.
C. Reversal or Mean Reversion
Goal: Profit from overbought/oversold conditions.
Strategy: Fade extremes using RSI divergence or candlestick patterns (e.g., pin bar, engulfing).
Tools: RSI/Stochastics, support-resistance, Fibonacci levels.
D. VWAP Strategy
Goal: Enter long below VWAP or short above, expecting price to revert to average.
Strategy: Combine VWAP with price action near key levels.
Indicators: VWAP, volume, moving averages.
4. Swing Trading Techniques
A. Trend Following
Goal: Capture multi-day price trends.
Strategy: Buy on pullbacks in an uptrend or sell on rallies in a downtrend.
Indicators: 20/50/200 EMA, MACD, trendlines.
B. Breakout Trading
Goal: Enter on breakouts from consolidation or chart patterns.
Strategy: Identify key resistance/support levels, wait for breakout + volume confirmation.
Tools: Chart patterns (flags, triangles), volume, RSI.
C. Pullback Trading
Goal: Buy temporary dips in a bullish trend or sell rallies in bearish moves.
Strategy: Wait for retracement to Fibonacci level or support zone.
Indicators: Fibonacci retracements, candlestick patterns, moving averages.
D. Range Bound Swing
Goal: Trade within horizontal support/resistance.
Strategy: Buy at support, sell at resistance, exit before breakout.
Tools: RSI/Stochastic, Bollinger Bands, price action.
5. Technical Tools and Indicators
Common to Both:
Candlestick Patterns: Doji, Hammer, Engulfing
Support/Resistance Zones
Moving Averages (SMA/EMA)
Volume Analysis
More Used in Intraday:
VWAP, SuperTrend, Tick Charts, Order Flow
Lower timeframes: 1min, 5min, 15min
More Used in Swing Trading:
Daily/4H/1H Charts
RSI, MACD, Fibonacci, Trendlines, Bollinger Bands
6. Risk Management Techniques
Intraday:
Stop Loss (SL): Tight SLs (0.3%–1%)
Risk per Trade: Typically 1% of capital
Trade Size: Smaller targets, more frequent trades
Position Sizing: Scalability matters due to liquidity and slippage
Swing Trading:
Stop Loss: Wider SLs (1.5%–5%)
Risk per Trade: Still capped at 1–2% capital
Trade Size: Fewer trades, but larger moves expected
Gap Risk: Overnight gaps can trigger stop-loss or slippage
7. Pros and Cons
Intraday Trading
Pros:
No overnight risk
Daily profit potential
Frequent learning opportunities
High leverage usage in derivatives
Cons:
High stress and screen time
Requires fast execution and discipline
Brokerage and transaction costs add up
Risk of overtrading
Swing Trading
Pros:
Less screen time needed
Better suited for part-time traders
Higher reward-to-risk per trade
Uses EOD data, less noise
Cons:
Exposure to overnight risk (gaps, news)
Patience needed
Less frequent trades
Holding through volatility can be psychologically tough
8. Psychology of Trading Styles
Intraday Trader Mindset:
Fast decision-making
Ability to manage multiple trades under pressure
Accepting frequent small wins/losses
High emotional discipline to avoid revenge trading
Swing Trader Mindset:
Patience to wait for setups
Comfort with holding trades overnight
Ability to withstand market noise and temporary drawdowns
Strategic thinking and planning ahead
Case Example
Intraday Example:
Stock: Reliance
Event: Breakout above day’s high at ₹2,500 with high volume
Entry: ₹2,505
Stop Loss: ₹2,490 (tight)
Target: ₹2,525
Trade Duration: 45 minutes
Outcome: Quick 20-point gain, exited same day
Swing Trade Example:
Stock: TCS
Pattern: Cup and Handle on daily chart
Entry: ₹3,850 after breakout
SL: ₹3,720 (below handle)
Target: ₹4,200
Trade Duration: 8 trading days
Outcome: ₹350 gain, partial profit booked on trailing stop
Conclusion
Both Intraday and Swing Trading are powerful trading methods, each with its own merits and risks. The key to success lies in choosing a style aligned with your time availability, risk appetite, and personality.
If you enjoy fast-paced decision-making and have full-time availability, Intraday Trading might suit you.
If you prefer a calmer, more strategic approach with less screen time, Swing Trading is a strong choice.
Ultimately, both styles can be profitable when paired with solid risk management, proper strategy, and emotional discipline. The best traders often master one style first—then expand or blend techniques as their skill evolves.
Part 2 Institution Trading Options Trading Strategies
For Beginners:
Buying Calls: Bullish on the stock/index.
Buying Puts: Bearish on the stock/index.
For Intermediate Traders:
Covered Call: Holding the stock + selling a call for income.
Protective Put: Holding stock + buying a put to limit losses.
For Advanced Traders:
Iron Condor: Neutral strategy with limited risk/reward.
Straddle: Buy a call and put at the same strike; profits from big moves.
Strangle: Buy a call and put at different strikes.
Spreads:
Bull Call Spread: Buy a lower call, sell a higher call.
Bear Put Spread: Buy a higher put, sell a lower put.
These strategies balance risk and reward across different market outlooks.

Part6 Institution Trading Types of Options
American vs. European Options
American Options: Can be exercised anytime before expiry.
European Options: Can only be exercised at expiry.
Index Options vs. Stock Options
Stock Options: Based on individual stocks (e.g., Reliance, Infosys).
Index Options: Based on indices (e.g., Nifty, Bank Nifty).
Weekly vs. Monthly Options
Weekly Options: Expire every Thursday (India).
Monthly Options: Expire on the last Thursday of the month.

Part5 Institution Trading Stratergy1. Introduction to Options Trading
Options trading is a powerful financial strategy that allows traders to speculate on or hedge against the future price movements of assets such as stocks, indices, or commodities. Unlike traditional investing, where you buy or sell the asset itself, options give you the right, but not the obligation, to buy or sell the asset at a specific price before a specified date.
Options are widely used by retail traders, institutional investors, and hedge funds for various purposes—ranging from hedging risk, generating income, or leveraging small amounts of capital for high returns.
2. Basics of Options
What is an Option?
An option is a derivative contract whose value is based on the price of an underlying asset. It comes in two forms:
Call Option: Gives the holder the right to buy the underlying asset.
Put Option: Gives the holder the right to sell the underlying asset.
Key Terms
Strike Price: The price at which the option can be exercised.
Premium: The price paid to buy the option.
Expiry Date: The last date the option can be exercised.
In-the-Money (ITM): Option has intrinsic value.
Out-of-the-Money (OTM): Option has no intrinsic value.
At-the-Money (ATM): Strike price is equal or close to the current market price.

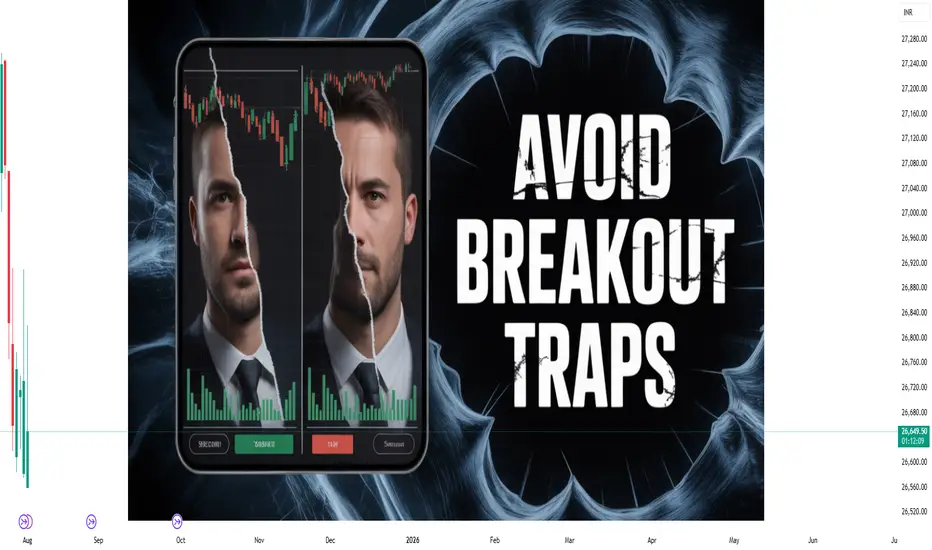
Avoiding Breakout Traps Like a ProIntroduction
Breakouts are among the most exciting setups in technical trading. The concept is simple: a stock or index moves beyond a defined support or resistance level, signaling the beginning of a new trend. Traders rush to enter the trade in the direction of the breakout, hoping to ride the wave. However, not all breakouts are genuine. Many are traps — known as false breakouts — that lure traders in, only to reverse sharply, causing losses. These are commonly referred to as breakout traps.
In this guide, we’ll break down how breakout traps occur, how professionals avoid them, and provide actionable techniques to help you recognize and filter high-probability breakouts like a pro.
What Is a Breakout Trap?
A breakout trap occurs when price moves beyond a key level — like resistance or support — triggering entries for breakout traders, only to reverse direction soon after. This creates a trap for those who entered the trade expecting continuation, leading to losses or forced exits.
Example:
Price breaks above a resistance of ₹100.
Traders enter long expecting a breakout.
Price quickly falls back below ₹100 and drops to ₹95.
Traders are trapped; stop losses are hit.
These traps are often the result of:
Smart money manipulation (stop hunting).
Retail trader overenthusiasm.
Low-volume confirmations.
Fake news or premature entries.
Why Do Breakout Traps Happen?
1. Lack of Volume Confirmation
Breakouts without volume are suspect. Volume represents participation. If the price breaks out without sufficient volume, it's likely driven by a small group of traders or algorithms — not sustainable strength.
2. Liquidity Grabs (Stop Loss Hunting)
Market makers and large institutions often push the price just beyond a key level to trigger stop losses and breakout entries, then reverse the move to trap traders.
3. Overcrowded Trades
When too many traders spot the same setup, it becomes a self-fulfilling trap. Everyone buys the breakout, but without new demand, the price can’t sustain, leading to a reversal.
4. News-Driven Spikes
Sometimes a breakout is fueled by news or rumors. If the news is already “priced in” or not fundamentally strong, the move may not hold.
How Pros Avoid Breakout Traps
Professional traders understand that timing, context, and confirmation are crucial. Here’s how they navigate breakout environments:
1. Analyze the Bigger Picture (Multi-Timeframe Analysis)
A breakout on a 15-minute chart might be noise in the daily chart. Always zoom out.
If a 1-hour breakout occurs against a higher-timeframe trend, it's riskier.
Look for alignment: a breakout on 15-min, 1-hour, and daily = higher conviction.
Tip: Use weekly and daily resistance levels to filter “true” breakouts.
2. Wait for a Retest
One of the most effective techniques is waiting for a retest of the breakout level.
After breaking out, does the price come back to test the level?
If the breakout level turns into support (in long trades) or resistance (in shorts), it confirms strength.
Example:
Resistance at ₹200 breaks.
Price moves to ₹205, then comes back to ₹200.
If it holds ₹200 and reverses upward — it's likely a true breakout.
This method reduces false entries and gives better risk-reward.
3. Watch Volume Like a Hawk
Volume should increase during the breakout.
Low volume = lack of interest = high chance of trap.
Look for above-average volume bars during or immediately after the breakout.
Smart Tip:
Compare breakout volume to the 20-day average volume. If it’s significantly higher, institutions may be participating.
4. Use Traps to Your Advantage (Trap Trading Strategy)
Smart traders counter-trade false breakouts. Here’s how:
Wait for a breakout.
Let the price break the level and then reverse sharply.
Enter in the opposite direction, using the breakout level as a stop.
Example:
Stock breaks ₹500 resistance and quickly falls back below ₹500.
You enter short at ₹495.
Stop loss = ₹505.
Target = Previous support zone.
This is a high-probability setup because trapped buyers are forced to exit, pushing prices further down.
5. Use Indicators for Confluence
Indicators are not magic, but they help filter trades.
RSI Divergence: If price breaks out, but RSI shows divergence (new high in price, not in RSI), caution is needed.
Bollinger Bands: Breakouts outside the upper/lower bands with a quick return = potential trap.
MACD Crossovers: Confirm breakout with bullish/bearish crossovers near the breakout level.
6. Time of Day Matters
Breakouts during market open (first 15–30 min) are often fake due to volatility.
Mid-session or closing breakouts are more reliable.
Breakouts after consolidation during the day tend to have higher success rates.
7. News and Events Awareness
Avoid breakout trades just before earnings, budget announcements, Fed meetings, etc.
Breakouts during such periods can be whipsaw-prone.
Let the dust settle — then trade the direction of confirmation.
Common Breakout Trap Patterns
Let’s review visual patterns where breakout traps are common:
1. False Break + Engulfing Candle
Price breaks out, then prints a strong engulfing candle in the opposite direction.
This is a clear sign of rejection and trapping.
2. Rising Wedge into Resistance
Price narrows in a rising wedge, breaks out, then collapses.
Often seen in stocks with weak fundamental backing.
3. Breakout with Doji or Shooting Star
A breakout with indecision candles at the top (like doji or shooting star) signals potential reversal.
Breakout Trap Risk Management
Even with all filters, traps can still occur. That’s why risk management is essential.
Use tight stop losses just below (or above) the breakout level.
Scale in — enter partially at the breakout and more after retest.
Risk only 1–2% of your capital per trade.
Consider hedging with options if you trade larger positions.
Breakout Traps in Different Markets
Stocks
Often trap retail traders, especially low-float or penny stocks.
Watch for news-driven moves and low-volume breakouts.
Indices (Nifty, Bank Nifty)
Breakouts around round numbers (like 20,000) often get trapped.
Institutional flow (FII/DII) data helps validate direction.
Crypto
Extremely volatile. Trap breakouts are frequent due to 24/7 trading.
Use 4H and daily levels + sentiment analysis for confirmation.
Conclusion
Avoiding breakout traps isn't about avoiding all breakouts — it's about trading only the best ones with context and confirmation. Breakouts can offer explosive profits, but only if you're disciplined, patient, and skilled in filtering.
By focusing on volume, retests, multi-timeframe analysis, and risk management, you elevate your breakout trading to a professional level. Traps will still happen, but with a strategic approach, you’ll learn to either avoid them or profit from them.
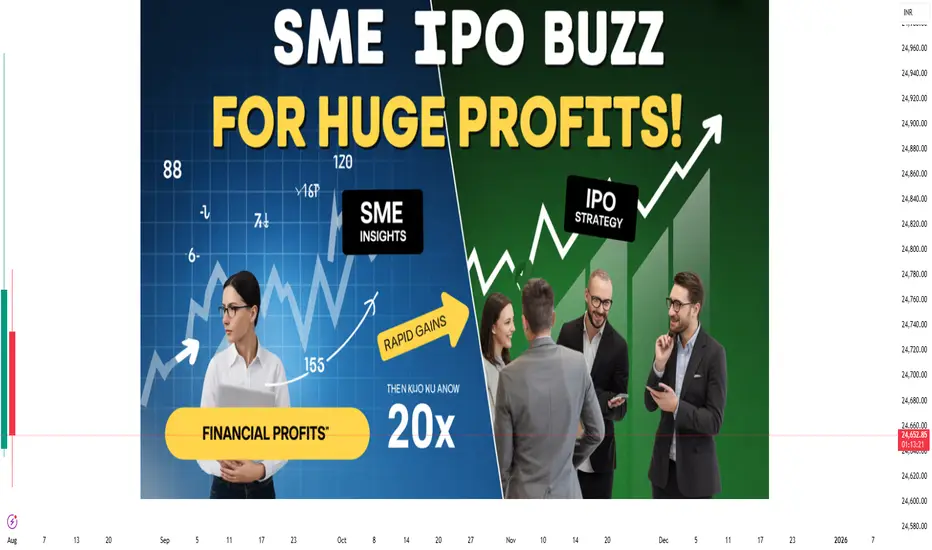
India’s SME IPO Boom: High-Risk, High-Reward TradingIntroduction
India’s Small and Medium Enterprise (SME) IPO market has exploded in popularity over the past few years, particularly post-2022. With rapid digitization, increasing retail investor participation, favorable government policies, and rising entrepreneurial spirit, SME IPOs are now a major talking point in the stock market world.
But investing or trading in SME IPOs isn't all sunshine and rainbows—it comes with unique risks, potential for high returns, and several nuances retail traders need to understand. In this detailed piece, we’ll break down India’s SME IPO boom, the reasons behind its rise, the high-risk-high-reward nature of such trades, and the trading strategies one might consider.
What is an SME IPO?
An SME IPO is an initial public offering by a small or medium-sized company listed on platforms like the NSE Emerge or BSE SME. These platforms were created to provide growth-stage businesses easier access to public markets, with relaxed compliance norms compared to mainboard listings.
Key characteristics of SME IPOs:
Lower issue size (as small as ₹5–₹50 crores).
Book-building or fixed-price offerings.
Limited number of investors (min. application size is often ₹1–₹2 lakhs).
100% underwriting is often mandatory.
Restricted liquidity (traded in lot sizes initially).
India’s SME IPO Boom: Timeline & Stats
Let’s look at the momentum:
2021-22: ~60 SME IPOs were listed.
2023: Over 100 SME IPOs hit the market, raising more than ₹2,300 crores.
H1 2024: Over 70 SME IPOs launched, with many multibagger returns.
Q2 2025 (est.): Continuing the pace, 100+ expected by year-end.
Many IPOs gave listing gains of 100% to 300%, fueling further retail interest. But this excitement comes with elevated volatility and lower institutional oversight, increasing risk.
Why the SME IPO Boom in India?
1. Ease of Listing
BSE and NSE have made it easier for small companies to list through relaxed eligibility norms:
Minimum post-issue capital as low as ₹3 crores.
3-year operational track record.
Simplified IPO documentation.
2. Retail Investor Participation
Platforms like Zerodha, Upstox, and Groww have democratized market access. A younger investor base is more open to taking risks, especially in high-return SME IPOs.
3. High Returns from Previous IPOs
Investors have seen mind-blowing returns from certain SME stocks. For example:
Sah Polymers: ~150% listing gain.
Drone Destination: >200% returns in 6 months.
Essen Speciality Films: 300% returns post-listing.
This has triggered a "gold rush" mentality among new traders.
4. Government Push
Initiatives like Startup India, Make in India, and Digital India have nurtured the SME ecosystem.
5. FOMO + Social Media Hype
Telegram, Twitter, and YouTube influencers regularly hype up SME IPOs, sometimes without transparency—drawing in less-informed retail traders looking to get rich quick.
The High-Reward Side: Multibagger Stories
Many SME stocks have turned ₹1 lakh into ₹3–5 lakhs within months. The reasons:
1. Undervalued Pricing
Small companies often price their IPOs modestly to ensure full subscription. This creates room for listing gains.
2. Growth Potential
Many SMEs operate in niche or emerging sectors—like drones, EV, renewable energy, tech manufacturing—where growth can be exponential.
3. Low Float, High Demand
Limited number of shares in SME IPOs means demand-supply imbalance can spike prices dramatically.
4. Thin Liquidity = Large Swings
With fewer buyers and sellers, any institutional or HNI interest can skyrocket prices.
Example:
Baweja Studios IPO (2024): Issue price ₹82 → hit ₹400+ within weeks.
Net Avenue IPO (2023): Listed at ₹18 → touched ₹150+ within 6 months.
But every multibagger comes with dozens of flat or failed IPOs—this brings us to the risk side.
Trading Strategies for SME IPOs
A. Pre-IPO Allotment Strategy
Apply in IPOs with strong fundamentals (look at net profit growth, debt/equity ratio, sector tailwinds).
Monitor subscription data—especially QIB and HNI categories.
Exit on listing day, especially if GMP (Grey Market Premium) is high.
Avoid chasing after listing unless there is sustained delivery volume.
B. Post-Listing Momentum Trading
Watch for delivery percentage, not just price movement.
Use tools like Volume Shockers or SME IPO Watchlists on NSE/BSE.
Only enter if you see sustained buying across multiple sessions.
Use stop-loss, even if it’s wide (due to volatility).
C. Breakout/Technical Trade
Once SME stocks are moved to mainboard after 2–3 years, they may see institutional coverage.
Use chart patterns like breakout above recent swing highs or support on major moving averages (20EMA/50EMA).
Indicators: RSI >60 and MACD crossovers work decently in low-float stocks.
Future of SME IPOs in India
The segment is likely to grow, but with caveats:
Positive Outlook
Government push for startups and MSMEs.
Rising investor awareness.
Many SMEs shifting to mainboard after performance proof.
Challenges
Quality dilution as more companies rush to list.
Potential scams/manipulations if oversight is weak.
Oversaturation could reduce listing gains.
Conclusion
The SME IPO boom in India represents both an opportunity and a cautionary tale.
For informed traders and investors, it offers multibagger potential and early access to India's rising business stars. But for the uninformed or emotionally driven, it can quickly turn into a nightmare of locked capital, manipulation, and losses.
In a high-risk-high-reward setup like SME IPOs, education, research, and discipline matter far more than hype. The Indian market is giving small businesses a big stage—just make sure you’re not caught in the spotlight for the wrong reasons.
Global Market Impact on Indian EquitiesIntroduction
Global financial markets are a tightly interconnected web of economies, financial institutions, businesses, and individual traders. In this interconnected environment, events occurring in one part of the world can rapidly ripple through others — impacting prices, influencing trader sentiment, and shaping investment decisions. This phenomenon is referred to as global market impact in trading.
For traders, understanding global market impact is critical. Whether you are a retail intraday trader, a swing trader, or a fund manager dealing with derivatives or equities, global events, policies, and economic conditions shape the outcomes of your trades more than ever before.
This article breaks down the various dimensions of global market impact in trading, its causes, mechanisms, and the tools traders use to monitor and manage it.
1. What Is Global Market Impact in Trading?
Global market impact refers to the influence of international events, policies, macroeconomic data, or market sentiment on financial markets across the globe. In today’s trading world, markets no longer operate in isolation. A U.S. Federal Reserve rate hike, a geopolitical crisis in the Middle East, or a slowdown in Chinese manufacturing can impact the price of Indian equities, European bonds, or Japanese yen.
Key aspects include:
Cross-border capital flows
Currency fluctuations
Commodity price changes
Global monetary policy alignment
Political and economic stability
2. Key Global Factors That Impact Trading
a) Central Bank Policies
Major central banks like the U.S. Federal Reserve, European Central Bank (ECB), Bank of Japan, and People’s Bank of China drive interest rates and liquidity across the globe.
Example:
If the Federal Reserve hikes interest rates, it strengthens the U.S. dollar. Emerging markets like India or Brazil may see capital outflows as investors pull money out in favor of U.S. assets.
A dovish stance, on the other hand, promotes risk-taking, benefiting equity markets globally.
b) Macroeconomic Indicators
Economic indicators such as:
U.S. Jobs Report (NFP)
China's GDP growth
EU Inflation Rates
India’s Trade Deficit
...are closely watched.
These data points shape market sentiment about growth, inflation, and monetary tightening or easing.
Example:
A better-than-expected U.S. jobs report often boosts the U.S. dollar and Treasury yields while negatively affecting risk-sensitive assets like tech stocks or emerging market equities.
c) Geopolitical Events
Political tensions, wars, trade conflicts, and sanctions are major disruptors in financial markets.
Examples:
Russia-Ukraine conflict affected global energy prices.
Israel-Palestine tensions spike oil prices.
U.S.-China trade war caused volatility in tech and commodity sectors.
Geopolitical risks lead to risk-off sentiment where investors flock to safe-haven assets like gold, USD, or U.S. Treasuries.
d) Commodity Prices
Global commodity prices affect trade balances, inflation, and corporate profitability.
Crude Oil: Impacts inflation, logistics, airline costs, and government subsidies.
Gold: A safe haven in uncertain times.
Copper & Industrial Metals: Indicators of industrial growth.
Agricultural Commodities: Affect food inflation and FMCG stocks.
e) Global Stock Market Movements
Global indices like Dow Jones, Nasdaq, S&P 500, FTSE, DAX, Nikkei, and Shanghai Composite influence local indices.
Example:
If the U.S. market falls sharply due to inflation data, expect Asian and European markets to open lower the next day.
3. Market Interlinkages and Transmission Mechanism
a) Time Zone Transmission
Asian markets react first to U.S. events overnight.
European markets adjust mid-day.
U.S. markets close the global trading loop.
b) Sectoral Interconnections
Global tech sell-offs affect Indian IT stocks (Infosys, TCS).
Crude oil spikes benefit ONGC but hurt aviation stocks like Indigo.
Weak Chinese industrial demand hits metals and mining stocks globally.
c) Currency Impact
Foreign investors convert capital into local currencies to invest. Currency fluctuations due to global sentiment affect:
Import/export cost structures
Inflation levels
FII/DII inflows and outflows
4. Case Studies: Real-World Global Market Impacts
Case 1: COVID-19 Pandemic (2020)
Global lockdowns crashed demand.
Equity markets worldwide fell 30-40%.
Central banks slashed interest rates, started QE.
Commodity prices, especially oil, collapsed.
Gold hit record highs due to risk aversion.
Case 2: Russia-Ukraine War (2022)
Crude oil and natural gas prices spiked.
European energy crisis erupted.
Indian markets saw massive FII outflows.
Defense, energy, and fertilizer stocks surged globally.
Case 3: Silicon Valley Bank Collapse (2023)
Triggered fears of a banking crisis.
Tech-heavy indices like Nasdaq corrected.
Central banks slowed rate hikes.
Bank stocks fell across Europe and Asia.
5. Tools to Track Global Market Impact
a) Economic Calendars
Track global macroeconomic events:
Fed decisions
ECB policy meetings
GDP releases
CPI, PPI, PMI data
Popular tools: TradingEconomics, Forex Factory, Investing.com
b) Global Market Indices
Track global indices pre-market:
Dow Futures
Nasdaq Futures
GIFT Nifty (India)
FTSE, DAX (Europe)
c) Currency Pairs
Watch major FX pairs:
USD/INR
USD/JPY
EUR/USD
USD/CNH
Currency trends show global capital movement and risk appetite.
d) Commodities Prices
Crude Oil (WTI, Brent), Gold, Silver, Copper, Natural Gas
These commodities impact inflation expectations and sector-specific moves.
e) VIX – Volatility Index
The "Fear Gauge" of global markets.
U.S. VIX rising = risk aversion = global sell-off.
India VIX = local market fear indicator.
6. Impact on Indian Markets
a) FII/DII Flows
Foreign Institutional Investors (FIIs) react to global yields, risk, and currency strength.
When U.S. bond yields rise, FIIs often withdraw from Indian markets.
DII flows often stabilize markets in FII-driven volatility.
b) Currency & Bond Market
USD/INR volatility is affected by global trade deficits, oil prices, and dollar strength.
RBI intervenes to prevent sharp rupee depreciation.
c) Sector-Specific Impact
IT Sector: Linked to U.S. tech spending.
Pharma: Impacted by U.S. FDA approvals and global demand.
Oil & Gas: Affected by Brent Crude prices.
Metals: Linked to Chinese industrial demand.
Conclusion
In today’s trading ecosystem, no market is an island. Global market impact is real, dynamic, and powerful. Traders and investors who ignore international developments risk being blindsided by overnight crashes, unexpected rallies, or economic shocks.
Being globally aware doesn’t mean you have to trade every event — it means integrating global understanding into your risk management, trade planning, and market expectations.
From the Fed's interest rate policy to geopolitical tensions in the Middle East, from a commodity rally in China to currency devaluation in Japan — everything is interconnected. Smart trading today requires a global lens with a local execution strategy.

GIFT Nifty & Global Index Correlations1. Introduction
The Indian financial ecosystem has undergone a significant transformation with the emergence of GIFT Nifty, a rebranded and relocated avatar of the former SGX Nifty. As India sharpens its global financial ambitions through GIFT City (Gujarat International Finance Tec-City), the GIFT Nifty has become a key component of the country’s market-linked globalization strategy.
But how does GIFT Nifty correlate with global indices like the Dow Jones, NASDAQ, FTSE 100, Nikkei 225, Hang Seng, and others? What signals can traders extract from global market trends before the Indian markets open?
This article explores in detail the correlation dynamics, strategic trading implications, and macroeconomic interlinkages between GIFT Nifty and major global indices.
2. Understanding GIFT Nifty
2.1 What is GIFT Nifty?
GIFT Nifty is the derivative contract representing the Nifty 50 index, now traded on the NSE International Exchange (NSE IX), based in GIFT City, Gujarat. It replaced SGX Nifty, which was earlier traded on the Singapore Exchange.
2.2 Trading Timings (as of 2025)
GIFT Nifty offers nearly 21 hours of trading, split into:
Session 1: 06:30 AM to 03:40 PM IST
Break: 03:40 PM to 04:35 PM IST
Session 2: 04:35 PM to 02:45 AM IST (next day)
This extended timing gives Indian and global investors the chance to react to major international events before the NSE opens.
3. Why GIFT Nifty Matters in Global Context
3.1 Price Discovery
Previously, SGX Nifty was used globally to gauge early cues on Indian markets. Now, GIFT Nifty fulfills that role and is even more significant because it's regulated by Indian authorities.
3.2 Liquidity Bridge
Foreign investors prefer GIFT Nifty because of:
Tax neutrality (IFSC jurisdiction)
Global accessibility
Ease of hedging and arbitrage opportunities
3.3 Strategic Global Position
Being open almost all day, GIFT Nifty trades during:
Asian trading hours
European sessions
Part of US session
This makes it a strategic derivative bridge between Indian equity markets and global macro flows.
4. Global Indices Overview: Benchmarks that Influence
Index Country Nature
Dow Jones USA Blue-chip, Industrial
NASDAQ USA Tech-heavy, Growth
S&P 500 USA Broad-market gauge
FTSE 100 UK Multinational, Export-led
DAX Germany Industrial + Auto-heavy
Nikkei 225 Japan Export, Tech-heavy
Hang Seng Hong Kong/China China proxy
Kospi South Korea Semiconductors & Auto
ASX 200 Australia Commodities & Finance
5. Key Correlation Patterns: GIFT Nifty & Global Indices
5.1 US Markets (Dow, NASDAQ, S&P 500)
Time Lag Advantage:
GIFT Nifty's evening session overlaps with the US market opening hours, making it sensitive to Dow/NASDAQ moves.
Risk-On/Risk-Off Trends:
If the NASDAQ or S&P 500 is sharply rising or falling due to earnings, inflation data, or Fed policy, GIFT Nifty reacts instantly.
Example:
Fed raises interest rates → US markets drop → GIFT Nifty falls in Session 2 → Nifty 50 opens gap-down next day.
Correlation Type:
Short-term positive correlation, especially during high-volatility events like CPI data or FOMC meetings.
5.2 European Markets (FTSE 100, DAX, CAC 40)
Mid-Day Influence:
European indices open in the afternoon IST, during GIFT Nifty’s Session 1. Their influence is moderate, often acting as early signals.
Macroeconomic Impact:
German or UK GDP data, ECB policy, or political issues (e.g., Brexit) affect GIFT Nifty during Session 1.
Example:
Weak PMI in Europe → FTSE falls → Risk aversion spreads → GIFT Nifty may drift lower.
Correlation Type:
Indirect correlation; significant during global crises or common central bank themes (e.g., inflation).
5.3 Asian Markets (Nikkei 225, Hang Seng, Kospi, ASX 200)
Morning Cue Providers:
Asian indices open before or along with GIFT Nifty’s Session 1, providing the first directional hint for Indian markets.
China Sentiment Impact:
Hang Seng and Shanghai Composite are highly sensitive to China policy. Their movements impact EM sentiment, which includes India.
Example:
Weak China export data → Hang Seng crashes → GIFT Nifty opens weak → Nifty follows suit.
Correlation Type:
Early session leading indicators, often showing short-term correlation due to regional capital flow sentiments.
6. Real Market Scenarios (Case Studies)
6.1 Fed Rate Hike Day – March 2025
US Market:
Dow fell 500 points post-Fed hawkish tone.
GIFT Nifty Reaction:
Dropped 120 points in the 2nd session.
Next Day NSE Open:
Nifty 50 gapped down by 110 points.
Inference:
Strong US market correlation, with GIFT Nifty acting as a real-time risk indicator for Indian markets.
6.2 China Lockdown News – July 2024
Asian Markets:
Hang Seng fell 4% due to Beijing lockdown.
GIFT Nifty Session 1:
Opened weak and stayed under pressure.
European Markets:
Added to risk-off mood.
Inference:
GIFT Nifty reflected immediate EM sentiment decline, even before Indian equities opened.
7. Correlation Statistics (Indicative)
Index Average Correlation Coefficient (6-Month Daily Returns)*
S&P 500 +0.55 (moderate positive)
NASDAQ +0.47 (tech-led directional link)
Dow Jones +0.52 (risk sentiment)
Nikkei 225 +0.41 (Asian correlation)
Hang Seng +0.48 (China-linked flows)
FTSE 100 +0.35 (weak to moderate)
Note: Correlation coefficients range from -1 (inverse) to +1 (perfect positive). Above +0.4 shows moderate correlation.
8. Correlation Factors: What Drives Interlinkage
8.1 Global Risk Sentiment
Markets move together when there is either extreme fear (e.g., war, recession) or exuberance (e.g., tech rally, global rate cuts).
8.2 Dollar Index (DXY) & US Bond Yields
When the Dollar rises, emerging markets like India often see outflows, affecting GIFT Nifty.
8.3 Crude Oil
India imports >80% of its oil. Rising crude → inflation risk → negative for Indian markets → reflected in GIFT Nifty.
8.4 Institutional Flows
Foreign Institutional Investors (FIIs) hedge positions through GIFT Nifty based on global triggers like Fed policy or earnings in the US.
8.5 Tech & IT Linkage
Indian IT stocks (Infosys, TCS) are correlated with NASDAQ performance due to global outsourcing demand.
Conclusion
The GIFT Nifty’s correlation with global indices is not just statistical—it’s strategic. It acts as a real-time risk barometer for Indian markets, influenced by global capital flows, geopolitical risks, tech trends, and central bank moves. While the correlations vary across geographies, they offer a powerful predictive framework for active traders and investors alike.
By mastering how GIFT Nifty reflects or diverges from global benchmarks like the Dow Jones, NASDAQ, Nikkei, or FTSE, traders can make more informed entry-exit decisions, especially during pre-market and overnight sessions.
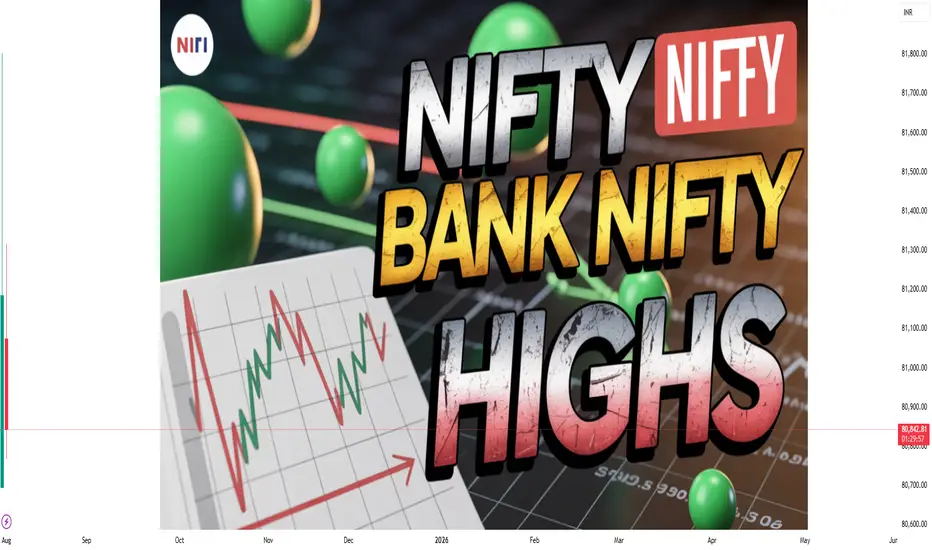
Part 6 Institution Trading Introduction
In the world of financial markets, Options Trading has emerged as one of the most powerful instruments for traders and investors alike. While traditional stock trading involves buying or selling shares, options give you the right—but not the obligation—to buy or sell a stock at a certain price within a certain time. This opens up a wide range of possibilities: from hedging your risks to speculating on market moves with limited capital.
But as exciting as options trading is, it also carries complexity. This detailed guide will explain what options are, how they work, key terminologies, strategies, risks, and how you can practically start trading options in India.
Chapter 1: What Are Options?
An option is a financial contract between two parties—the buyer and the seller.
There are two types of options:
Call Option: Gives the buyer the right to buy the underlying asset at a specified price (strike price) before or on expiry.
Put Option: Gives the buyer the right to sell the underlying asset at a specified price before or on expiry.
Unlike stocks, options do not represent ownership. They are derivatives, meaning their value is derived from the price of an underlying asset (like Nifty 50, Bank Nifty, or Reliance stock).

Part 8 Institutional TradingTable of Contents
Introduction to Options Trading
Structure of the Indian Options Market
Types of Options
Key Terminologies in Options
How Options are Priced
Option Trading Strategies (Basic to Advanced)
Understanding Open Interest and Option Chain
Weekly & Monthly Expiry Trends in India
FII/DII Participation in Options
Role of SEBI, NSE & Regulatory Oversight

Sector Rotation & Thematic TradingIntroduction
In today's fast-moving and highly dynamic markets, investors and traders are always on the lookout for strategies that help them stay ahead of the curve. Two of the most effective approaches to identifying timely opportunities are sector rotation and thematic trading. While both aim to capitalize on broader economic trends and market cycles, they operate with different focuses and time frames.
In this in-depth guide, we’ll break down:
What sector rotation and thematic trading are
The economic and market logic behind them
How institutional and retail traders apply these strategies
Tools, indicators, and data used
Advantages and limitations
Real-world examples from Indian and global markets
1. What is Sector Rotation?
Sector rotation is a strategy based on the idea that different sectors of the economy perform better at different stages of the business or economic cycle. It involves shifting capital from one sector to another depending on macroeconomic indicators, interest rates, inflation expectations, and growth forecasts.
📊 The Four Phases of the Business Cycle:
Early Expansion (Recovery)
Best sectors: Financials, Consumer Discretionary, Industrials
Features: Low interest rates, improving earnings
Mid Expansion
Best sectors: Technology, Industrials, Materials
Features: Strong GDP growth, rising profits
Late Expansion (Peak)
Best sectors: Energy, Utilities, Consumer Staples
Features: Inflation rises, interest rates peak
Recession or Contraction
Best sectors: Healthcare, Utilities, Consumer Staples
Features: Falling GDP, layoffs, declining earnings
🎯 The Strategy:
A sector rotation strategy attempts to anticipate which sectors will benefit from upcoming economic shifts and reallocate capital accordingly. It's especially popular among mutual funds, hedge funds, and large institutions.
2. What is Thematic Trading?
Thematic trading, on the other hand, is less about economic cycles and more about long-term secular trends. Investors identify themes driven by structural, technological, demographic, or policy changes and then invest in companies and sectors that are best positioned to benefit from those trends.
🌍 Examples of Popular Themes:
Renewable energy and ESG (Environment, Social, Governance)
Artificial Intelligence and Automation
Urbanization and Infrastructure
Digital India or Rural India
5G and Telecom expansion
EV (Electric Vehicles) adoption
Defence and National Security
🧠 The Mindset:
Thematic investors think long-term—often holding investments for 3-5 years or longer—based on the belief that once a theme gains traction, it will become a structural trend that outlasts short-term market volatility.
3. Key Differences: Sector Rotation vs Thematic Trading
Feature Sector Rotation Thematic Trading
Time Frame Short to medium-term (quarterly/yearly) Medium to long-term (multi-year)
Based on Economic cycles and interest rates Structural or societal changes
Risk Exposure More cyclical risk Trend/innovation risk
Asset Allocation Dynamic and tactical Strategic and focused
Participants Institutional investors, mutual funds Retail investors, fund managers, ETFs
4. Tools & Indicators Used
🔧 Tools for Sector Rotation:
Economic Indicators: GDP, CPI, interest rates, PMI
Intermarket Analysis: Bond yields vs equity performance
Relative Strength Analysis: Compare sectors (e.g., Nifty Auto vs Nifty IT)
ETFs & Sectoral Indices: Used to gain diversified exposure
🔧 Tools for Thematic Trading:
Trend Identification Tools: News, policy announcements, budget allocations
Sectoral Fund Flows: Track DII/FII interest in certain sectors
Story-based Investing: Read into “narratives” shaping industries
Backtesting Themes: Evaluate past performance of similar themes
5. Institutional Use Case
🏦 Sector Rotation by Institutional Investors:
Large institutions like mutual funds and pension funds actively use sector rotation to outperform benchmarks. They analyze:
Quarterly earnings patterns
Interest rate hikes by RBI/Fed
Inflation readings and credit growth
For example, in 2023–24, when inflation was sticky and rates were high, many funds shifted exposure from rate-sensitive sectors (like banks) to FMCG and pharma.
🧠 Thematic Investing by Institutions:
Asset management companies (AMCs) launch thematic mutual funds around emerging stories. For instance:
ESG funds for sustainable investing
EV and mobility funds for green energy plays
PSU funds betting on disinvestment and policy push
6. Retail Investor Approach
📈 Sector Rotation for Retail:
Retail traders can rotate between:
Nifty sectoral indices (Auto, Pharma, FMCG, IT, etc.)
Sectoral ETFs or index futures
Stock baskets like smallcase
But they must remain more agile. For example, if GDP data is weak, they might move away from capital goods to consumer staples within days.
🚀 Thematic Trading for Retail:
Retail participation in themes has grown massively:
Platforms like Smallcase and Zerodha offer thematic portfolios
Many invest in the “India Infra” or “Make in India” themes
Others bet on sunrise sectors like defence or green hydrogen
7. Real-World Examples
🇮🇳 Sector Rotation in Indian Markets:
Post-COVID Recovery (2021):
IT and Pharma led the market due to global tech demand and healthcare spending.
2022 Rate Hike Cycle:
Financials performed well in rising rate environment; auto recovered with rural demand.
2023–24 Consolidation:
Defensive sectors like FMCG, PSU Banks, and Capital Goods outperformed due to policy tailwinds and infra push.
🌐 Global Sector Rotation:
In the US, sector ETFs like XLK (Tech) or XLF (Financials) are rotated based on Fed policy or earnings guidance.
2020–21 saw massive rotation from Energy to Tech, and later to Industrials and Defence due to geopolitical tensions.
🧵 Indian Thematic Trades:
EV Boom (2021–2023):
Stocks like Tata Motors, Amara Raja Batteries, and Minda Industries rallied on the EV narrative.
Defence & Atmanirbhar Bharat (2022–2024):
BEL, HAL, Bharat Dynamics soared due to increased defence budget allocations.
Green Energy (2023–ongoing):
NTPC, JSW Energy, and Adani Green attracted investor interest due to renewable targets and PLI schemes.
8. Benefits of Sector Rotation
✅ Performance Enhancement:
By shifting to outperforming sectors, investors can generate alpha.
✅ Risk Reduction:
Avoid underperforming sectors during downturns.
✅ Macro Alignment:
Matches portfolio allocation with macroeconomic realities.
✅ Short-Term Opportunities:
Can be used for weekly/monthly trading themes.
Conclusion
Both sector rotation and thematic trading are powerful frameworks to navigate the stock markets. Where sector rotation helps align with market cycles, thematic investing allows one to ride megatrends and transformational shifts. The smartest investors often use both in their strategies—riding long-term themes while tactically rotating sectors to improve returns.
The key lies in timely analysis, proper risk management, and grounded expectations. Whether you're a day trader watching sector moves or a long-term investor backing India’s green energy future, mastering these strategies can significantly boost your performance in the markets.