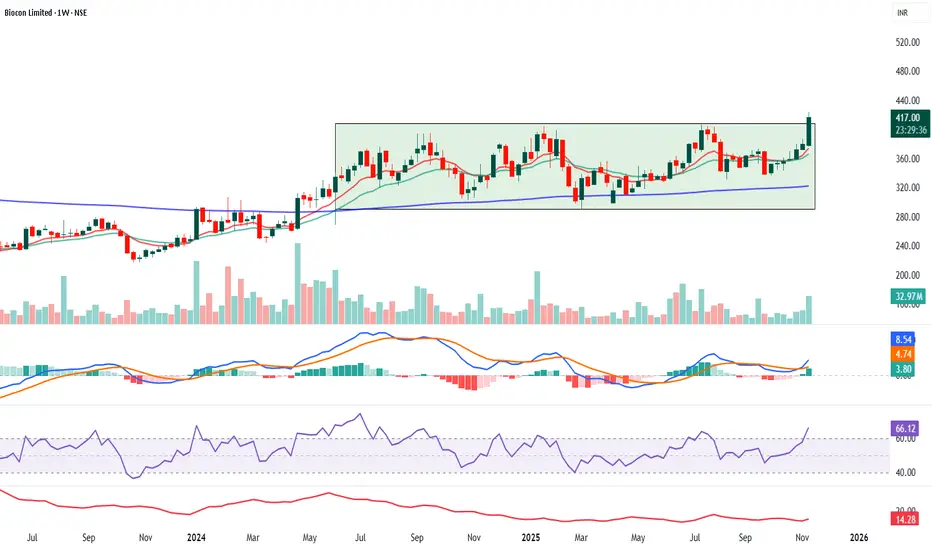
Biocon: Range to Trend Expansion in ProgressBiocon’s weekly chart highlights a well-structured range-bound consolidation transitioning into a rising trend. Over the past several quarters, the stock has repeatedly faced supply near the upper resistance zone around 400–420, as marked by multiple rejections. This clearly establishes a strong overhead resistance where sellers have historically dominated.
On the downside, price action has respected a rising support trendline, forming higher lows over time. Each dip toward this support zone has attracted fresh buying interest, indicating accumulation at lower levels. This combination of flat-to-rising resistance and rising support reflects improving demand strength and a gradual tightening of price structure.
The recent pullback toward the support area near 360–370 is technically healthy rather than bearish. Such retracements often act as retest phases, allowing the market to absorb supply before attempting the next directional move. As long as Biocon holds above this rising support, the broader bullish structure remains intact.
A decisive weekly close above the resistance band (420+) would confirm a breakout from this prolonged consolidation. Post-breakout, the chart opens room for a strong upside expansion, with projected targets gradually extending toward the 460–500 zone based on the height of the prior range and trend continuation principles.
From a risk perspective, the setup stays valid while price sustains above the rising trendline. A breakdown below this support would delay the bullish thesis and could push the stock back into consolidation. Until then, Biocon remains in a favorable positional structure, where patience around support and confirmation near resistance can offer high-quality risk–reward opportunities for medium- to long-term traders and investors.
BIOCON

BIOCON LTD ANALYSISTHIS IS MY CHART OF THE WEEK PICK
FOR LEARNING PURPOSE
BIOCON LTD- The current price of BIOCON LTD is 41.15 rupees
I am going to buy this stock because of the reasons as follows-
1. It gave a good breakout and made a 4 year new high.
It's coming out from a big base.
2. It got a good buying force and went up by almost 40% from March 2026 low.
3. It is showing better relative strength as it stood strong in volatile times including last few weeks.
4. The risk and reward is favourable.
5. The stock has got a good catalyst and that is- Mutual Funds and FIIs have got some decent holding and they have increased their stake in recent times.
6. Another good part- The stock has been of the laggards and it has done almost nothing in last 5 years, if it breaks 487.25 rupees then we can see more strength.
I am expecting more from this in coming weeks.
I will buy it with minimum target of 35-40% and then will trail after that.
My SL is at 366.75 rupees.
I will be managing my risk.

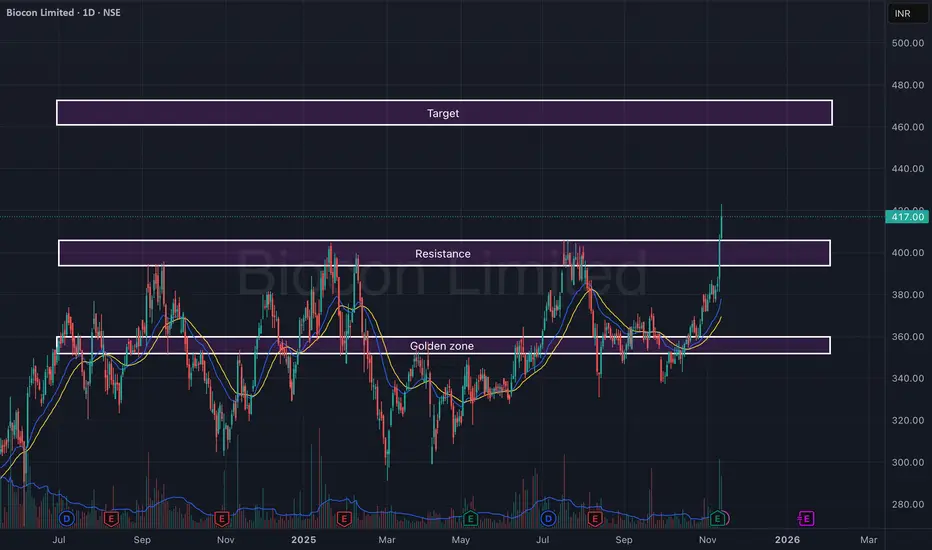
Biocon Ltd – Breakout from Resistance with Strong Volume SurgeBiocon has delivered a powerful breakout above its key resistance zone of ₹395–₹405, backed by a sharp volume expansion and strong follow-through candles. After months of consolidation within the golden zone (₹355–₹370), the stock has finally regained momentum, suggesting a potential trend reversal.
The structure now favors continuation toward the upper target zone, with EMAs aligning positively and momentum indicators supporting strength.
🎯 Key Levels:
CMP: ₹417.00 (+2.73%)
Golden Zone (Base Support): ₹355 – ₹370
Resistance (Now Support): ₹395 – ₹405
Target Zone: ₹460 – ₹475
Stop-Loss: ₹385 (on daily close basis)
📊 Technical View:
Resistance breakout with strong bullish candle and high volume.
EMA crossover (20 > 50) confirms short-term bullish trend.
Sustaining above ₹405 may lead to a momentum rally toward ₹460+.
Golden zone remains a reliable base for any pullback opportunities.
🧠 View:
Biocon has confirmed a breakout after a prolonged consolidation phase. Sustained momentum above ₹405 could lead to a steady move toward ₹470 levels in the short to medium term.
Biocon Weekly AnalysisBiocon is moving inside a Darvas Box for many weeks. This means the stock is trading in a range and buyers and sellers are balanced.
Recently, the price has moved up from the lower side of the box with good strength. Volumes are also increasing, which shows more participation from buyers.
RSI is around 56, which tells us momentum is improving but not overbought. It is a healthy zone.
MACD is turning positive. This signals that the trend may be shifting from sideways to upward.
ADX is around 14. This means the trend is still weak, but slowly gaining strength. If price continues upward, ADX can rise more.
Overall, the chart shows early signs of a possible breakout. Buyers are becoming active, and momentum indicators are improving.
Biocon (D): Strongly BullishThis is a high-conviction breakout in progress. A major fundamental catalyst (record-breaking earnings) is providing the "great momentum", driving the price to challenge a critical multi-year resistance. All indicators are aligned for a major new uptrend.
🚀 1. The Fundamental Catalyst
The primary driver for today's move is a blowout Q2 2026 earnings report :
- Net Profit: Surged 392% year-over-year.
- Revenue: Grew 20% year-over-year.
- Today's Action: The market reacted with a gap-up open , a +5.40% surge , and massive 16.38 Million in volume, confirming strong institutional interest.
📈 2. The Long-Term Context
- The 2020 Peak: After its ATH in December 2020, the stock entered a multi-year downtrend.
- The 2023 Bottom: This trend found its bottom in March 2023 .
- The Reversal: Since then, the stock has been in a 2.5-year reversal, forming a bullish base of Higher Lows .
- The "Lid": This entire recovery has been capped by the key horizontal resistance zone formed back in June-December 2020 .
📊 3. The Decisive Breakout
Today's earnings-driven surge is challenging this multi-year resistance zone right now .
- Failed Attempts: There were multiple failed attempts to break this level in the past.
- Drying Volume: The consolidation phase before today's move saw volume dry up , a classic sign of seller exhaustion.
- The Breakout: Today's high-volume gap-up is the most powerful and fundamentally-backed attempt to break this "lid" to date.
🎯 4. Confluence of Bullish Indicators
This breakout is supported by a rare "trifecta" of bullish signals across all timeframes:
- EMAs: Short-term Exponential Moving Averages are in a "PCO" (Price Crossover) state on the Daily, Weekly, and Monthly charts .
- RSI: The Relative Strength Index is rising on the Daily, Weekly, and Monthly charts .
This alignment indicates that the long-term, medium-term, and short-term trends are all in sync for the first time in years.
🧠 5. Future Scenarios & Key Levels to Watch
The price action in the coming sessions is critical.
🐂 The Bullish Case (Confirmation)
- Trigger: The stock must get a decisive daily or weekly close above the 2020 resistance zone.
- Target: This would confirm the start of a new, long-term bull market, and ₹470 target is the logical next objective.
🐻 The Bearish Case (Breakout Failure)
- Trigger: If this move is a "bull trap" (e.g., profit-taking overpowers the good news).
- Confirmation: The stock fails to hold its gains and falls back below the resistance zone.
- Target: This failure would likely see the stock fall to retest the immediate support level at ₹375 .

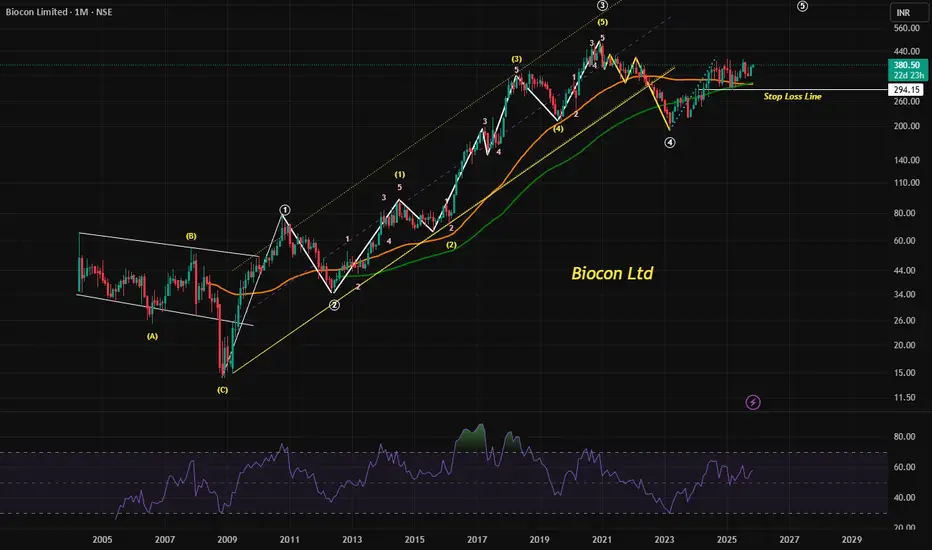
Understanding Biocon’s Bullish Setup Through Elliott Wave & RSIBiocon Limited is showing signs of a long-term bullish trend, supported by Elliott Wave theory and RSI strength above 50. Its current price action above key moving averages reinforces the momentum.
📈 Understanding Biocon’s Bullish Setup Through Elliott Wave and RSI
Biocon Limited, a prominent player in the biotechnology sector, is currently trading around ₹380.50. Technical analysis suggests that the stock is in the midst of a long-term bullish cycle, potentially targeting levels above ₹720. This projection is grounded in the principles of Elliott Wave Theory and supported by the Relative Strength Index (RSI) and moving average trends.
🔹 Elliott Wave Theory: Mapping Market Psychology
Elliott Wave Theory is a powerful tool used to analyze market cycles and investor psychology. It posits that prices move in repetitive wave patterns—five waves in the direction of the main trend followed by three corrective waves.
Wave 1 to 5: These represent the primary trend. In Biocon’s case, the current movement appears to be in the midst of this five-wave structure.
Wave 3 is typically the strongest and longest, often driven by fundamental catalysts and broad market participation.
Wave 5, which Biocon is believed to be entering or progressing through, often reflects the final push of bullish sentiment before a correction.
Given the current price and technical setup, the projection toward ₹720+ aligns with the completion of this five-wave pattern.
🔹 RSI: Momentum Confirmation
The Relative Strength Index (RSI) is a momentum oscillator that measures the speed and change of price movements. A reading above 50 typically indicates bullish momentum.
Since early 2024, Biocon’s RSI has consistently remained above the 50 mark, suggesting sustained buying interest and upward momentum.
This RSI behavior supports the Elliott Wave interpretation, reinforcing the idea that the stock is in a strong uptrend.
🔹 Moving Averages: Trend Validation
Moving averages help smooth out price data and confirm trends. Biocon’s price currently trades above both its:
50-day moving average (DMA): Indicates short- to mid-term bullishness.
100-day moving average (DMA): Suggests longer-term strength and investor confidence.
Trading above these key levels often acts as a support zone, reducing downside risk and attracting trend-following investors.
📊 Conclusion: A Technically Sound Rally
Biocon’s current technical landscape paints a compelling picture for long-term investors and swing traders:
The Elliott Wave structure suggests a continued rally toward ₹720+.
The RSI above 50 confirms bullish momentum.
Trading above 50 DMA and 100 DMA validates the trend.
While technical analysis offers valuable insights, investors should also consider fundamental developments and broader market conditions before making decisions.
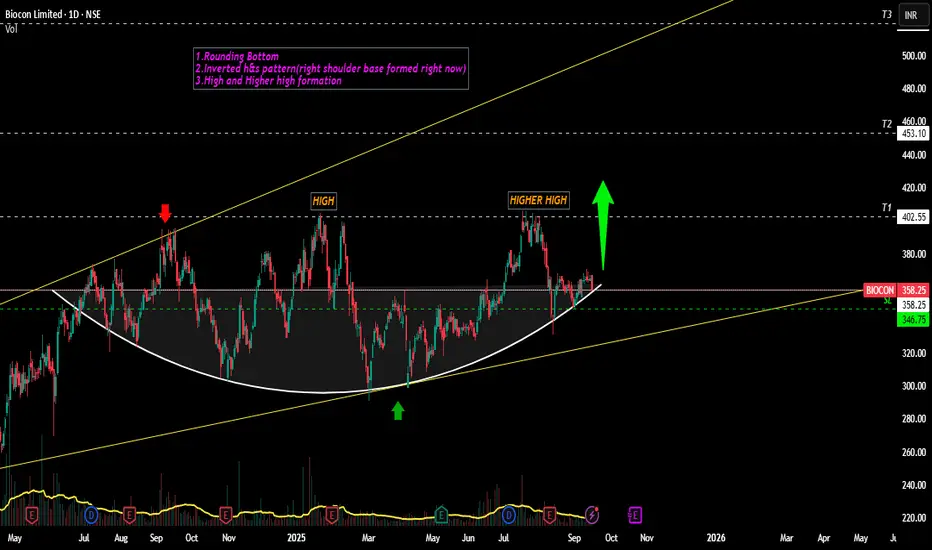
Biocon likely to see Bulls Surge!!!Yes, Charts give the indications for the upcoming long move in Biocon
Below is the daily timeframe wholesome look -
( Expanding Triangle pattern above chart)
(Inverted H&S pattern - above chart)
other points ,target, sl levels mentioned in the chart.
We can expect a Breakout (most likely)/Breakdown(less likely) by this week!!!!
Just sharing my view...not a tip nor advice!!!
Thank you,
mmjimm
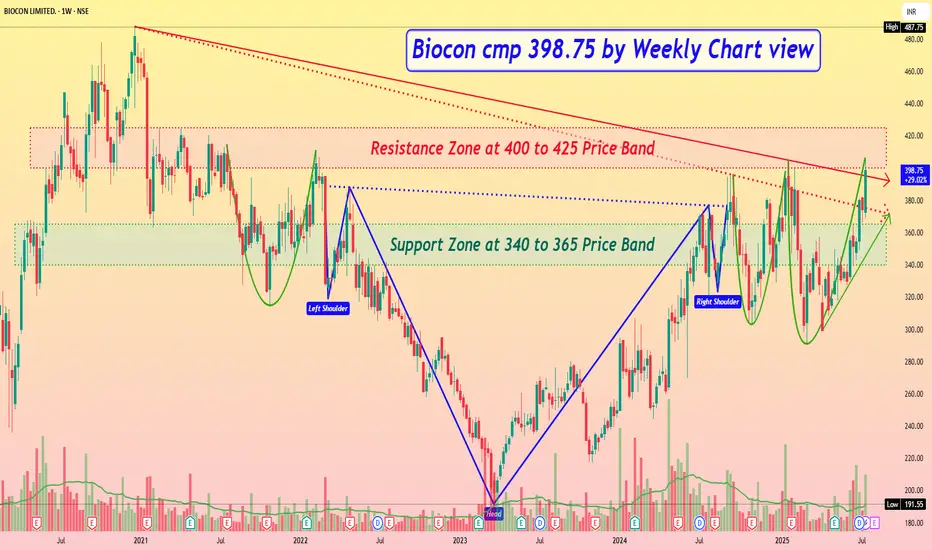
Biocon cmp 398.75 by Weekly Chart viewBiocon cmp 398.75 by Weekly Chart view
- Support Zone at 340 to 365 Price Band
- Resistance Zone at 400 to 425 Price Band
- 2nd Falling Resistance Trendline Breakout attempted
- 1st Falling Resistance Trendline Breakout done and sustained
- Stock Price restrained below Resistance Zone after ATH 487.75 in Dec 2020
- Volumes seen galloping heavily and surging well above the avg traded quantity
- Multiple Bullish Technical patterns completed under Resistance Zone Price Band
- *SUBJECT TO*..... Resistance Zone crossover by few days sustained closure, *ONLY then FRESH BREAKOUT* maybe expected*
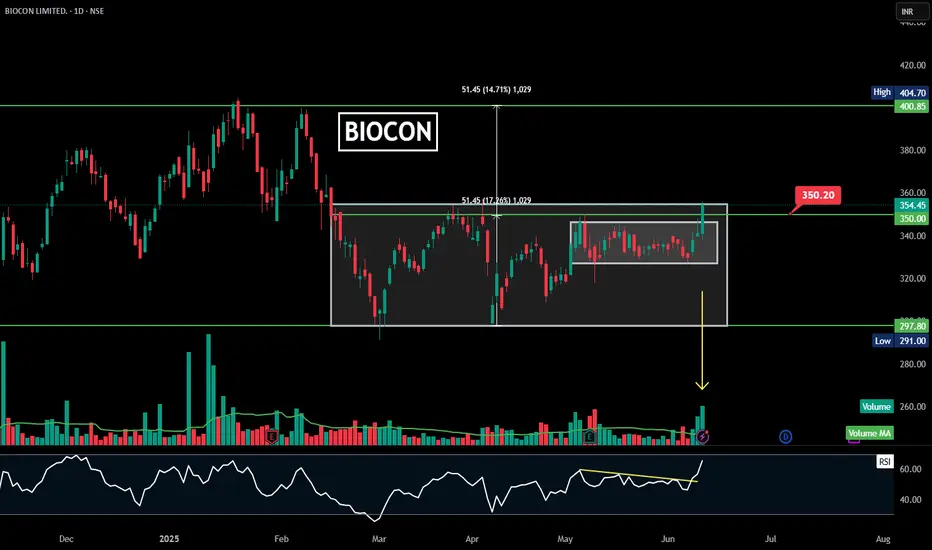
BIOCON |Rectangle | Consolidation Breakout | Daily
### 🏺 **Pattern Overview:**
✅ **Horizontal Rectangle / Consolidation Breakout:**
* **Range:** ₹297.80 (support) to ₹350.20 (resistance).
* **Breakout Price:** ₹350.20 confirmed (recent candle closed above it).
* **Current Price:** ₹354.45, showing a breakout and potential further upside.
---
### 🎯 **Measured Move Target:**
* **Measured height of the rectangle:** \~₹51.45.
* **Target price zone:** ₹400–₹405 in the medium-term.
* **Resistance levels:** ₹400.85–₹404.70 (previous swing highs).
---
### 📊 **Volume & RSI Insights:**
* **Volume:** Surge in breakout session – confirms buyers’ strength.
* **RSI:** Clear breakout of a downward-sloping RSI trendline (marked in yellow).
* **Volume MA:** Above average, which adds to breakout reliability.
---
### 💡 **Key Takeaway:**
Biocon has **broken out of a consolidation range** at ₹350.20 with healthy volume and RSI confirmation. A potential **upside target is ₹400–₹405** in the coming weeks if the breakout sustains.
---
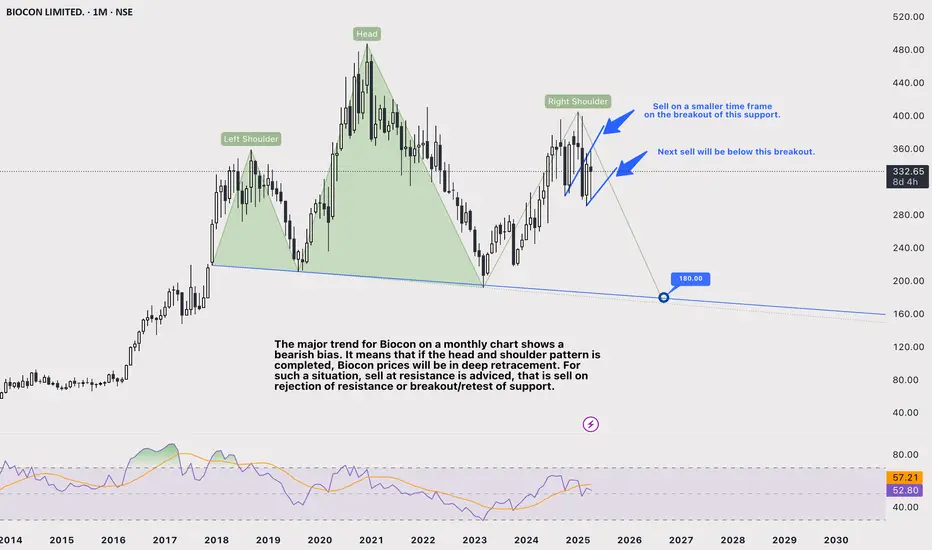
Biocon monthly analysis: Bearish on breakoutThe major trend for Biocon on a monthly chart shows a bearish bias. It means that if the head and shoulder pattern is completed, Biocon prices will be in deep retracement. For such a situation, sell at resistance is advised, that is, sell on rejection of resistance or breakout/retest of support.
Step down on lower time-frame for immediate trendline supports for entry strategies.
BIOCON : A Cup and Handle BreakoutIn this falling market BIOCON is showing a cup and handle Breakout with good amount of volume. Upside potential is 45% (approx.) ...
CMP : 388
TG1 : 485 (High)
TG2 : 570
SL : 329
TSL : Below 9 EMA
Stock's selection based on 5 Point Analysis:
1: Idea : Breakout.
2: Support : Volume, Delivery .
3: Technical : 21/55/200-EMA, Super trend up, RS>0 RSI.
4: Fundamental : PE, PAT, Industry & peer PE and sector performance.
5: Timing : Entry Timing on Daily chart.
Disclaimer : It is my personal view as a trader and for educational purpose only. Equity market involves risk .
Please consult your financial adviser before taking any decision.

Biocon Higher Lows and Key Levels Broken.NSE:BIOCON today made higher Lows and Broke Out Key Levels, with RSI and MACD showing a Bullish Momentum, a Swing up to 400 Looks Good and Postionally 450.
📌Thank you for exploring my idea! I hope you found it valuable.
🙏FLLOW for more
👍BOOST if useful
✍️COMMENT Below your views.
Meanwhile, check out my other stock ideas below until this trade is activated. I would love your feedback.
Disclaimer: This analysis is intended solely for informational and educational purposes and should not be interpreted as financial advice. It is advisable to consult a qualified financial advisor or conduct thorough research before making investment decisions.

Stocks in Focus: Biocon, Bharat Dynamics & Apollo Micro Systems1. Biocon NSE:BIOCON
● The stock reached a peak of ₹483 in December 2020, then experienced a downturn, entered a prolonged consolidation phase.
● This phase led to the formation of an Inverted Head & Shoulder pattern.
● Following a recent breakout, the stock is now poised for upward movement.
2. Bharat Dynamics NSE:BDL
● After hitting an all-time high around ₹1,795, the stock saw a decline of nearly 50% and eventually found support at ₹890.
● From this point, the price rebounded and recently surpassed its trendline resistance, setting the stage for substantial future gains.
3. Apollo Micro Systems NSE:APOLLO
● The stock underwent significant consolidation after marking an all-time high near ₹161.
● With a fresh breakout, the price is now set to exceed its past high and make new highs.

BIOCON - Swing/Positional Trading opportunity This is a weekly chart to analyze the bigger picture in the stock
One can clearly see that stock is in Stage-2 uptrend with both Key MAs sloping up
Price bouncing from Key MAs (especially 40 week MA)
Volume activity is also favorable as of now
Relative strength of the stock is also high as compared to CNX500 on 52 week basis
Instead of just jumping on to the stock the very next day, I would prefer to wait for a low risk entry so that I can have bigger position with lower SL size.
This is not a recommendation. Pls do your own study before putting any money in any stock.
Share this with your friends if you find this useful.
For more learning stuff related to chart analysis, pls check out my other ideas (some of them are linked below)
You can always reach out to me anytime for any query or feedback.
Keep learning

BIOCON - TRADE IDEA ON SHORT SIDESymbol - BIOCON
BIOCON is currently trading at 371
I'm seeing a trading opportunity on sell side.
Shorting BIOCON Futures at CMP 371
I will be adding more position if 377 comes & will hold with SL 385
Targets I'm expecting are 360 - 347 & 333
Disclaimer - Do not consider this as a buy/sell recommendation. I'm sharing my analysis & my trading position. You can track it for educational purposes. Thanks!

BIOCON INVERSE H&S BREAKOUTBIOCON breaking inverse h&s pattern
with good volume building up
trading above 20 ema
#target 395 ,sl 333
NO BUY/SELL RECOMENDATION

Biocon Double bottom:BullishDouble Bottom with bullish signals.
Entry at 340
Target 348, 353
SL 335.50
Divergence in RSI at oversold zone.

Granules India for 35%+ gainsDate: 3 Oct’24
Stock: Granules
Timeframe: Daily chart
Granules India seems to have begun its up move in Wave V of 5 which could end around 810-820 (>35% from current price of 595) as seen in the chart. High volumes and strong reversal of RSI supports this stance.
This is not a trade recommendation. Please do your own analysis.
Aisa lagata hai ki Granules India ne 5 ke Wave V mein apni badhat shuroo kar dee hai, jo 810-820 (595 kee vartamaan keemat se 35%) ke aasapaas samaapt ho sakatee hai, jaisa ki chart mein dekh sakte hain. Achhi volume aur RSI ka majaboot ulataav is rukh ka samarthan karta hai.
Yeh koi vyaapaar ki rai nahin hai. Kripya apna vishleshan khud karein.

Biocon ready to fly; 25% Return; short term investmentHuge potential is there.
For short term investment ;
Leave a " Like If you agree ".👍
.
.
Wait for small retracement & daily candle to close above - "355"
.
.
If you are interested in investment now, go for it with proper risk,
.
.
Overall " biocon" fundamentally good stock.
.
.
Enter after market Breaks
"Yellow box" mentioned.
.
Wait for proper reversal and conformation.
.
Don't make complicated trade set-up.📈📉
Keep it " simple, focus on consistency "💹
Refer our old ideas for accuracy rate🧑💻
Valuable comments are welcomed-✌️
.
Refer over old posted idea attached below.

BIOCON LTD READY FOR A UPSWING (SWING TRADING SETUP)Since last weeks we have seen pharma sector is outperforming and this performance may continue.
As per price action biocon ltd
Has created a Cup but handle is still remaining. If this stock creates a handle which is highly possible then price can be bullish for few trading sessions.
Price should sustain above Trend line then it will be good.
For more confirmation wait for the price to come at resistance level and look for RSI above 70.
If fails and test previous support then this Overview will be considered as NULL.(Conditions not fulfilled)

BIOCON - Cup and Handle -Breakout-WklyBIOCON - Cup and Handle—Breakout—Wkly
Name - BIOCON
Pattern - Cup and Handle
Timeframe - Wkly
Status - Breakout
Volume - Good
Cmp - 379
Target - 555
SL - 372

BIOCON BULLISH BIGGER MOVE COMINGBIOCON BULLISH BIGGER MOVE COMING
Monthly View
Wave 1,2 bigger time frame completed
Wave 2 retraced to 61.8% percent
Wave 3 started, volume is also growing
Stock may show upmove
ELLIOTT WAVE ANALYSIS
Give your suggestions and reviews

Biocon cmp 359.10 by Weekly Chart view- Volumes seen as steadily traded
- Support Zone at 312.50 to 319.50 Price Band
- Resistance Zone seen at 377to 388 Price Band
- Price sustained well above Falling Resistance Trendline
- Weekly basis : Support at 325 > 292 > 260 with Resistance at 388 > 421 > 463 > ATH 487.75
- Double Bullish "W" pattern done with neckline at Support Zone and also at Resistance Zone, as one may consider
