Biocon Weekly: Don't get TrappedBIOCON
Price band marked is for ATH, in current week rejection is seen just below the lower band.
Be cautious for ur entries near to This band, it may trap for some time.
Some good entries would be btn 290-310; SL 280
BIOCON

BIOCON LOOKS BEARISH ON CHART AT 200 HOURLY EMAHello all..!!
Looking from the chart, Biocon have come near resistance zone. I have come to conclusion this stock would start downward journey.
What's your view on this stock write in comments ..
Disclaimer:
I am not a registered investment, legal or tax advisor or a broker/dealer. All investment/financial opinions expressed by me are from the personal research and experience. These are intended as educational material.


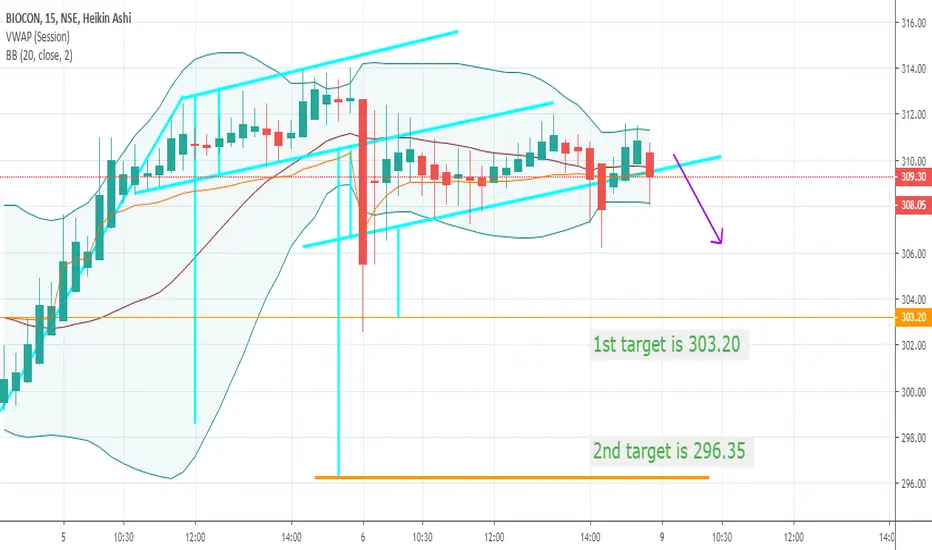
For tomarrow, Short biocon if red body crosses below flagbottomFor tomarrow, Short biocon if red body crosses below flagbottom, 15m
Target as marked..
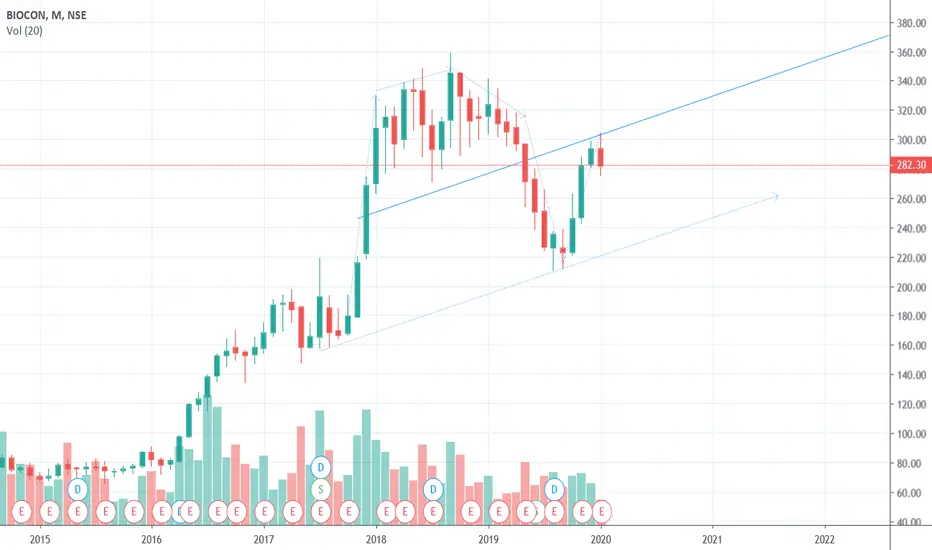
BIOCON - SYMMETRICAL TRIANGLE PATTERN AND LONG TERM LOOKOUTSYMMETRICAL TRIANGLE PATTERN
1)This is Long Term probability, based only on a Chart Pattern that I have found out.
2)We are refering to a Monthly Chart here.
3)This Is extremely good stock to accumulate for the long term.
4)Should accumulate if comes down to a level of 240-260, that is Point No. 5.
5)Expect a major Breakout then.
OR
6)It may Break the Trendline at Point No.4 and Travel Upwards.


Biocon , breakout !!!!!!!!!Good breakout on the weekly side ,go long on dips til 295-290 with the sl of 275 on clbs and tgts of 320/340 positionally .
twitter - @thesachinjain
telegram - @tradingbud
keep your charts simple as possible


BIOCON weekly chart analysis - Buy setup - Low risk high reward After a decisive close above resistance of 281+ Biocon is all set for a bullish rally
Buy at CMP 294+ and on dips upto 281
T1: 340
T2: 360
T3: 420
T4: 450
SL: 270

2020-01-21: BIOCON: SELL ONLY AT 299Please consult your financial advisor before taking a position in this.
SELL BIOCON at 299 with Stop-loss of 305 and Target of 286

Biocon 238 + Breakout, 210 Good Support ZoneBiocon bounced from the support area and now ready for a new breakout above 238 + level.

Biocon weekly chartBiocon
At channel support,
RSI suggest good entry point
Resistance may be seen at around 295 (Obesrve Weekly resistance trend line)

Biocon : Inverted Cup and Handle? Can someone please validate? Biocon price seems to have formed inverted Cup and Handle on a monthly candlestick chart. This is on the slanted price movement. Handle has reached 50% of depth of cup. Any significant upmove may invalidate inverted Cup and Handle. Need some more insights on Inverted Cup and Handle


BIOCON FIBONACCI LEVELSCURRENTLY AT 50 % LEVEL WHICH IS VERY IMPORTANT IF IT BREAKS IT ON CLOSING BASIS IN 30 MINUTE CANDLE GO SHORT TARGET GIVEN WITH ARROW
NOTE:TRADE AT YOUR OWN RISK


Biocon Repost !!!6th hourly candle near resistance zone ,Patten is completed, chances are high we are reaching first target

Breaking down from the accumulation Zone DownBroken the Accumulation zone
near 200 Daily SMA.
Braking shorter trend lines..
Likely to have a pullback down..

Biocon sell it !!Key resistance zone
Bat pattern completion on higher time frame
Would see some major pullback soon
Stop loss should not obvious
Follow if analysis is working or comment If not
Suggestions are welcome !!!
Just here spread good message among trading community


