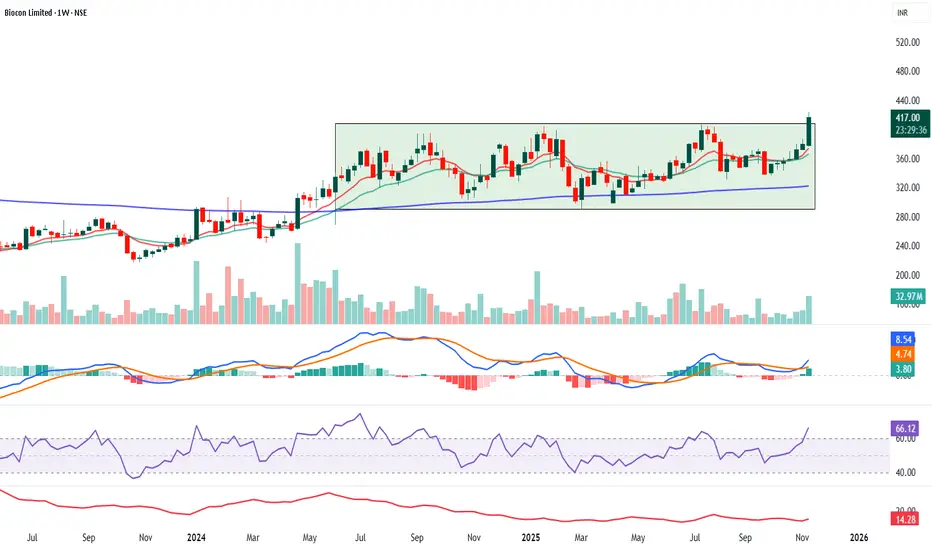
Biocon: Range to Trend Expansion in ProgressBiocon’s weekly chart highlights a well-structured range-bound consolidation transitioning into a rising trend. Over the past several quarters, the stock has repeatedly faced supply near the upper resistance zone around 400–420, as marked by multiple rejections. This clearly establishes a strong overhead resistance where sellers have historically dominated.
On the downside, price action has respected a rising support trendline, forming higher lows over time. Each dip toward this support zone has attracted fresh buying interest, indicating accumulation at lower levels. This combination of flat-to-rising resistance and rising support reflects improving demand strength and a gradual tightening of price structure.
The recent pullback toward the support area near 360–370 is technically healthy rather than bearish. Such retracements often act as retest phases, allowing the market to absorb supply before attempting the next directional move. As long as Biocon holds above this rising support, the broader bullish structure remains intact.
A decisive weekly close above the resistance band (420+) would confirm a breakout from this prolonged consolidation. Post-breakout, the chart opens room for a strong upside expansion, with projected targets gradually extending toward the 460–500 zone based on the height of the prior range and trend continuation principles.
From a risk perspective, the setup stays valid while price sustains above the rising trendline. A breakdown below this support would delay the bullish thesis and could push the stock back into consolidation. Until then, Biocon remains in a favorable positional structure, where patience around support and confirmation near resistance can offer high-quality risk–reward opportunities for medium- to long-term traders and investors.
Bioconanalysis

BIOCON LTD ANALYSISTHIS IS MY CHART OF THE WEEK PICK
FOR LEARNING PURPOSE
BIOCON LTD- The current price of BIOCON LTD is 41.15 rupees
I am going to buy this stock because of the reasons as follows-
1. It gave a good breakout and made a 4 year new high.
It's coming out from a big base.
2. It got a good buying force and went up by almost 40% from March 2026 low.
3. It is showing better relative strength as it stood strong in volatile times including last few weeks.
4. The risk and reward is favourable.
5. The stock has got a good catalyst and that is- Mutual Funds and FIIs have got some decent holding and they have increased their stake in recent times.
6. Another good part- The stock has been of the laggards and it has done almost nothing in last 5 years, if it breaks 487.25 rupees then we can see more strength.
I am expecting more from this in coming weeks.
I will buy it with minimum target of 35-40% and then will trail after that.
My SL is at 366.75 rupees.
I will be managing my risk.

Biocon Weekly AnalysisBiocon is moving inside a Darvas Box for many weeks. This means the stock is trading in a range and buyers and sellers are balanced.
Recently, the price has moved up from the lower side of the box with good strength. Volumes are also increasing, which shows more participation from buyers.
RSI is around 56, which tells us momentum is improving but not overbought. It is a healthy zone.
MACD is turning positive. This signals that the trend may be shifting from sideways to upward.
ADX is around 14. This means the trend is still weak, but slowly gaining strength. If price continues upward, ADX can rise more.
Overall, the chart shows early signs of a possible breakout. Buyers are becoming active, and momentum indicators are improving.
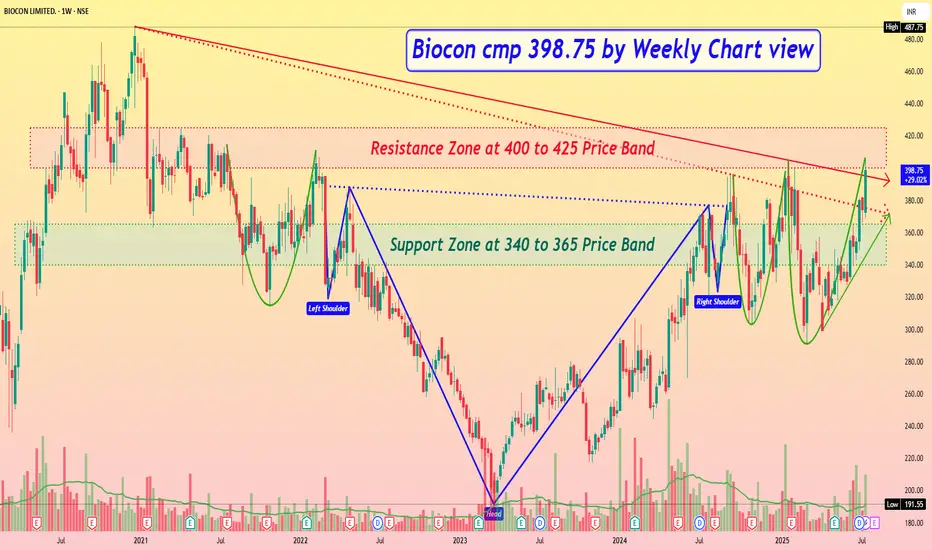
Biocon cmp 398.75 by Weekly Chart viewBiocon cmp 398.75 by Weekly Chart view
- Support Zone at 340 to 365 Price Band
- Resistance Zone at 400 to 425 Price Band
- 2nd Falling Resistance Trendline Breakout attempted
- 1st Falling Resistance Trendline Breakout done and sustained
- Stock Price restrained below Resistance Zone after ATH 487.75 in Dec 2020
- Volumes seen galloping heavily and surging well above the avg traded quantity
- Multiple Bullish Technical patterns completed under Resistance Zone Price Band
- *SUBJECT TO*..... Resistance Zone crossover by few days sustained closure, *ONLY then FRESH BREAKOUT* maybe expected*
Elliott Wave Insights: Clearly indicates the Analytical approachHello friends,
Welcome to RK_Chaarts,
Today we're going to attempt to analyze the chart of Biocon Limited. Clearly, on the monthly timeframe, we can see that we've completed wave ((3)) and wave ((4)), which are of primary degree, marked on chart in Black color. We're currently unfolding wave ((5)), which will have five sub-divisions on the weekly timeframe. The weekly chart also shows that we've completed wave (1) and wave (2) of intermediate degree which we've marked in Blue, and wave (3) has begun, possibly indicating a breakout on the weekly chart. This breakout, having good intensity of Volumes.
Similarly, on the daily chart, we can see that we've completed sub-divisions red 1 and red 2 within wave (3), and possibly started red 3 of (3).
So, based on wave analysis, the outlook appears highly bullish, snapshots are shared below.
Possible Wave counts on Monthly
Possible wave counts on Weekly
Possible wave counts on Daily
The breakout is also accompanied by excellent volume. If we see a dip on lower timeframes, such as Hourly chart, and the price reaches a reliable moving average like the 50-EMA or 200-EMA, it could be a great opportunity to enter. Additionally, friends, we can see on the daily timeframe that a reversal chart pattern has formed and is on the verge of a breakout, with the price standing at the neckline. As soon as this breakout occurs, we can expect further additions. Snapshots are shared below.
Reversal and Bullish Chart Pattern: Inverted Head n Shoulder
Furthermore, we can see that the RSI on the weekly chart has also broken out and is above 60, indicating a strong bullish momentum. Even the MACD has shown a bullish positive crossover and is moving above the zero line on the weekly chart. Additionally, the monthly MACD is also displaying a strong bullish trend, having given a positive crossover and remaining above the zero line. These are all very positive signs. Snapshots are shared below.
RSI Breakout & above 60 on Weekly
MACD on Weekly
MACD on Monthly
We can see that on the weekly chart, the price has crossed above the major EMAs, including the 50, 100, and 200-period EMAs. Now, as the price moves towards its target, these three major moving averages are not obstacles, but rather support levels below. The fact that the price is moving above all these moving averages is a sign in itself.
Looking at the monthly timeframe, we can see that the price has also crossed above the 50, 100, and 200-period EMAs and is moving above them. This is a strong indication of the trend's strength and direction. Snapshots are shared below.
Ema monthly
Ema weekly
So, friends, if our Elliott Wave analysis is correct, and our roadmap is accurate, then as we can see, the monthly chart's wave ((3)), which is of primary degree, marked as rounded three in black, has completed its rounded ((4)) correction or retracement. Now, we're moving upwards towards wave ((5)).
If our wave count is correct, and the structure is right, then according to the theory, wave ((4))'s low, which is around 192, should not be breached. This level will serve as an invalidation level. If the price breaches the invalidation level of 192, which seems unlikely given the positive signs, our wave count will be invalidated, and we'll need to reanalyze it.
On the other hand, based on Elliott Wave theory, the projected target for wave ((5)) is typically between 123.6% and 161.8% of the length of wave ((4)). So, the price may reach or consolidate between the levels of 559 and 672, which are the projected targets based on wave theory, marking the end of wave ((5)) on the monthly chart.
This post is shared purely for educational purpose & it’s Not a trading advice.
I am not Sebi registered analyst.
My studies are for educational purpose only.
Please Consult your financial advisor before trading or investing.
I am not responsible for any kinds of your profits and your losses.
Most investors treat trading as a hobby because they have a full-time job doing something else.
However, If you treat trading like a business, it will pay you like a business.
If you treat like a hobby, hobbies don't pay, they cost you...!
Hope this post is helpful to community
Thanks
RK💕
Disclaimer and Risk Warning.
The analysis and discussion provided on in.tradingview.com/u/RK_Chaarts/ is intended for educational purposes only and should not be relied upon for trading decisions. RK_Chaarts is not an investment adviser, and the information provided here should not be taken as professional investment advice. Before buying or selling any investments, securities, or precious metals, it is recommended that you conduct your own due diligence. RK_Chaarts does not share in your profits and will not take responsibility for any losses you may incur. So Please Consult your financial advisor before trading or investing.

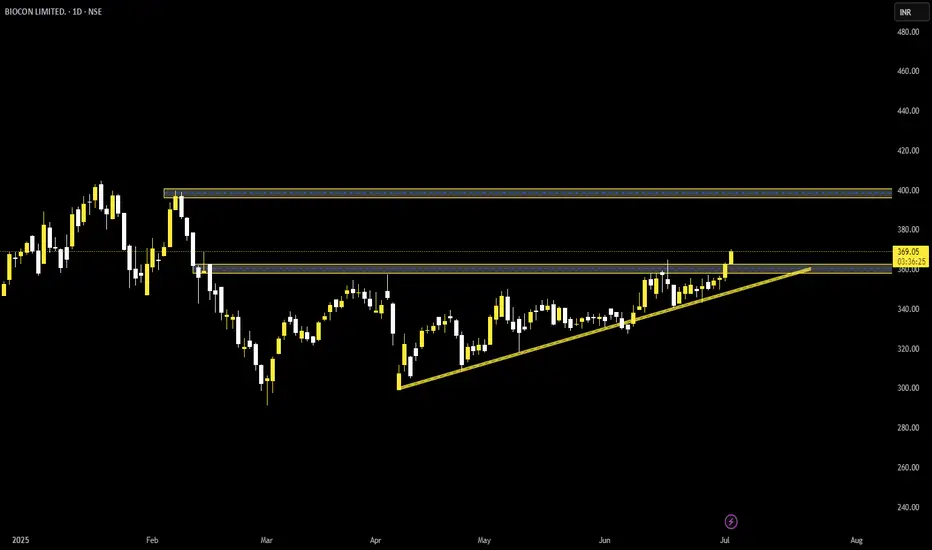
Biocon (Long)Price seen breaking out a resistance zone of 357-362
Expecting 9-10% Move Upside
Thanks
BIOCON : A Cup and Handle BreakoutIn this falling market BIOCON is showing a cup and handle Breakout with good amount of volume. Upside potential is 45% (approx.) ...
CMP : 388
TG1 : 485 (High)
TG2 : 570
SL : 329
TSL : Below 9 EMA
Stock's selection based on 5 Point Analysis:
1: Idea : Breakout.
2: Support : Volume, Delivery .
3: Technical : 21/55/200-EMA, Super trend up, RS>0 RSI.
4: Fundamental : PE, PAT, Industry & peer PE and sector performance.
5: Timing : Entry Timing on Daily chart.
Disclaimer : It is my personal view as a trader and for educational purpose only. Equity market involves risk .
Please consult your financial adviser before taking any decision.

Biocon Higher Lows and Key Levels Broken.NSE:BIOCON today made higher Lows and Broke Out Key Levels, with RSI and MACD showing a Bullish Momentum, a Swing up to 400 Looks Good and Postionally 450.
📌Thank you for exploring my idea! I hope you found it valuable.
🙏FLLOW for more
👍BOOST if useful
✍️COMMENT Below your views.
Meanwhile, check out my other stock ideas below until this trade is activated. I would love your feedback.
Disclaimer: This analysis is intended solely for informational and educational purposes and should not be interpreted as financial advice. It is advisable to consult a qualified financial advisor or conduct thorough research before making investment decisions.

Putting Price Action Altogether | BIOCON LIMITED ⚡️ Investing opportunity: Price Action Analysis Alert !!!⚡️
⚠️Education Purpose only!!!!
1️⃣Biocon Limited Overview
📍Founded: 1978 by Kiran Mazumdar-Shaw
📍Headquarters: Bengaluru, Karnataka, India
📍Markets: Over 120 countries, including the United States and Europe
2️⃣Key Business Divisions
👉Generics: Produces generic APIs for global markets.
👉Biosimilars: Focuses on biosimilar insulins and monoclonal antibodies.
👉Research Services: Contract research and development via subsidiary Syngene International.
👉Novel Biologics: Develops innovative therapies for diseases like cancer, diabetes, and autoimmune disorders.
3️⃣Financial Performance
✅Net Loss: ₹160 million
✅Revenue: ₹35.9 billion, up 3.7% YoY.
✅Biosimilars Revenue: Increased by 11% (U.S., Europe).
✅Generics Revenue: Declined by 7.7%
4️⃣Technical Reasons to trade or Strategy applied :-
⭕️50 Day Moving averages shows strong Bullishness in Long-Term
⭕️Head&Shoulder Pattern Breakout
⭕️Breakout with strong Volume
⭕️Channel Pattern Formation
⭕️Upward Trendline for Resistance
⭕️Higher-Lows Formation before Breakout
⭕️Trendline Breakout too
5️⃣Key Takeaways
⚠️Strengths: Strong global presence and diverse biopharmaceutical portfolio.
⚠️Challenges: Recent profitability concerns due to pricing pressures and tax adjustments.
⚠️Growth Potential: Biosimilars and novel biologics present significant long-term opportunities.
⚠️Investor Consideration: Combine fundamental and technical analyses to assess investment decisions.
✅Check out my Trading View profile to see how we analyze charts and execute trades.
🙋♀️🙋♂️If you have any questions about this stock, feel free to reach out to me.
📍📌Thank you for exploring our idea! We hope you found it valuable.
🙏FLLOW for more !
👍LIKE if useful !
✍️COMMENT Below your view

BIOCON - Swing/Positional Trading opportunity This is a weekly chart to analyze the bigger picture in the stock
One can clearly see that stock is in Stage-2 uptrend with both Key MAs sloping up
Price bouncing from Key MAs (especially 40 week MA)
Volume activity is also favorable as of now
Relative strength of the stock is also high as compared to CNX500 on 52 week basis
Instead of just jumping on to the stock the very next day, I would prefer to wait for a low risk entry so that I can have bigger position with lower SL size.
This is not a recommendation. Pls do your own study before putting any money in any stock.
Share this with your friends if you find this useful.
For more learning stuff related to chart analysis, pls check out my other ideas (some of them are linked below)
You can always reach out to me anytime for any query or feedback.
Keep learning

BIOCON - TRADE IDEA ON SHORT SIDESymbol - BIOCON
BIOCON is currently trading at 371
I'm seeing a trading opportunity on sell side.
Shorting BIOCON Futures at CMP 371
I will be adding more position if 377 comes & will hold with SL 385
Targets I'm expecting are 360 - 347 & 333
Disclaimer - Do not consider this as a buy/sell recommendation. I'm sharing my analysis & my trading position. You can track it for educational purposes. Thanks!

BIOCON LTD READY FOR A UPSWING (SWING TRADING SETUP)Since last weeks we have seen pharma sector is outperforming and this performance may continue.
As per price action biocon ltd
Has created a Cup but handle is still remaining. If this stock creates a handle which is highly possible then price can be bullish for few trading sessions.
Price should sustain above Trend line then it will be good.
For more confirmation wait for the price to come at resistance level and look for RSI above 70.
If fails and test previous support then this Overview will be considered as NULL.(Conditions not fulfilled)

Biocon Indicates Flag Pattern Breakout and Positive ResultsDetails:
Asset: Biocon Limited (BIOCON)
Breakout Level: Above 320
Expected Target: 340 and beyond
Stop Loss: Below breakout level or as per risk tolerance
Timeframe: Short to medium-term
Rationale: Biocon Limited (BIOCON) is displaying a flag pattern breakout potential alongside positive results. A breakout above the 320 level could signify a bullish momentum shift, especially supported by positive earnings results.
Market Analysis:
Technical Breakout: The breakout above 320 indicates a potential flag pattern breakout, suggesting increased buying interest and potential for further upside momentum.
Positive Results: Strong earnings results can act as a catalyst for bullish sentiment and further support the breakout scenario.
Expected Target:
The initial target for BIOCON is set at 340 and beyond, considering the potential momentum from the breakout and positive results.
Risk Management:
Implementing a stop loss strategy below the breakout level is crucial to manage risk in case of unexpected price reversals.
Timeframe:
The projected move for BIOCON is based on a short to medium-term outlook, considering both technical breakout and fundamental catalysts.
Risk-Reward Ratio: Consider individual risk tolerance and adjust position size accordingly to maintain a favorable risk-reward ratio.
As with any investment opportunity, conduct thorough analysis and consider factors such as market trends, company fundamentals, and risk ma


BIOCON NSEDate 28th Feb 2024
MACD showing HL while Price A. Showing HH,
This Indicates Sellers are Exhaust.
but still can't make new Higher Low in Price Action,
means buyers are in Command now.

Biocon : Bottomed out Stock#Biocon #Momentumstock #Swingtrade #BreakoutCandidate
BIOCON : 200 EMA Breakout Soon
>> Momentum Stock
>> Bottomed-out Stock
>> Good Strength & volumes in stock
>> Low Risk High Reward Trade
Swing Traders can lock 10% profit & keep trailing
Please give a Boost or comment if u r Liking the analysis & Learning from it. Keep showing ur Love by following
Disclaimer : This is not a Trade Recommendations & Charts/ stocks Mentioned are for Learning/Educational Purpose. Do your Own Analysis before Taking positions.

BIOCON BULLISHBIOCON looking is good
it is in strong trend line support
First target@295
Second target@318
Stop loss@255
Disclaimer:
I am not a SEBI Registered Analyst. Anything posted here is my own analysis and views. This is created for educational purposes only. Always consult your Financial Advisor before taking any decision or trade.
Happy trading.

BIOCON | 280 - 285 STRONG SELL ZONEBiocon made a strong bearish candle on 8th January and gave closing below candle on 12th Jan. The stocks is sell on rise as per our analysis around 280 - 285 with the SL above 295 on closing basis. Targets are marked on the chart with green lines.
Please like the idea If you agree with the analysis, your like will motivate us to share more ideas on Tradingview.
Happy Trading!
InvestPro India

Biocon to take long entryLong Biocon above 250 after the BO of marked resistance area. The stock holding the support area & high probability that stock will bounce back. All important levels have been marked on the charts. This is for your educational purpose only.


BIOCON flirting with trend line resistanceBIOCON is showing signs of a breakout, so far volumes are not supporting it. For any entry into longs it would be better to wait for a strong candle with good volume support.

BIOCON NEAR SUPPORT ZONESBiocon trading near it's hourly support zone @ 223 - 218 and expected to show a bounce towards marked targets on the chart.
To motivate us, Please like the idea If you agree with the analysis.
Happy Trading!
InvestPro India Team
