BIRLACABLE - Cup & Handle Breakout | Daily Chart📊 BIRLA CABLE LTD (BIRLACABLE) – Cup & Handle Breakout with Fibonacci Targets | RSI Overbought | Volume Spike | Daily Chart
📅 Chart Date: June 18, 2025
📈 CMP: ₹208.05 (+14.11%)
📍 Ticker: NSE:BIRLACABLE
🔍 Technical Chart Breakdown
☕ Cup & Handle Pattern Breakout
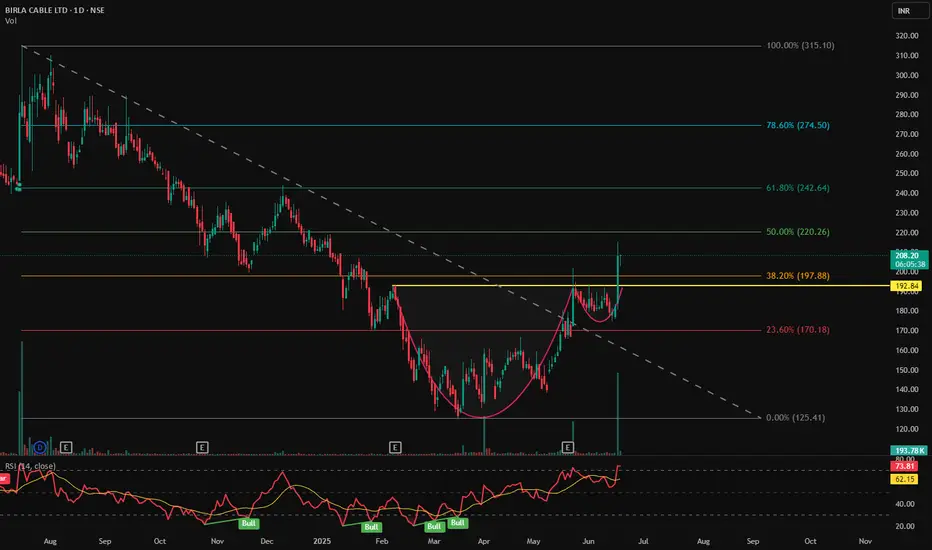
BIRLACABLE has confirmed a Cup & Handle breakout above the neckline at ₹197.88 (also 38.2% Fibonacci retracement level), suggesting bullish continuation after a long consolidation. The breakout is clean with a wide bullish candle.
📐 Fibonacci Retracement Levels (from swing high ₹315.10 to swing low ₹125.41)
38.2% (Breakout Zone): ₹197.88 ✅
50.0%: ₹220.26
61.8%: ₹242.64
78.6%: ₹274.50
Target: 100% Fibonacci: ₹315+
💹 RSI & Momentum
RSI at 73.75, entering overbought territory 🔼
Multiple RSI bullish crossovers visible during base formation
RSI suggests strong buying momentum, ideal for trend continuation
📉 Trendline Breakout
Downtrend resistance (dotted line) broken along with horizontal neckline
Aligns with volume-based breakout, confirming strength
🕯️ Volume Confirmation
Huge spike in volume (4.44M) on breakout day — highest in months
Suggests institutional or smart money activity
📍 Key Price Levels
✅ Breakout Level: ₹197.88
🚀 Fibonacci Targets:
₹220.26 → 50%
₹242.64 → 61.8%
₹274.50 → 78.6%
₹315+ → 100% (Full target)
🛡️ Support Levels:
₹197 (neckline support)
₹170.18 (23.6% Fib)
₹150 (handle base)
💡 Trading Idea
Entry: Close above ₹198 or on retest of neckline
Stop Loss: Below ₹185 or ₹170
Targets: ₹220 → ₹243 → ₹275 → ₹315
Risk-Reward: Favorable with strong confirmation
BIRLACABLE
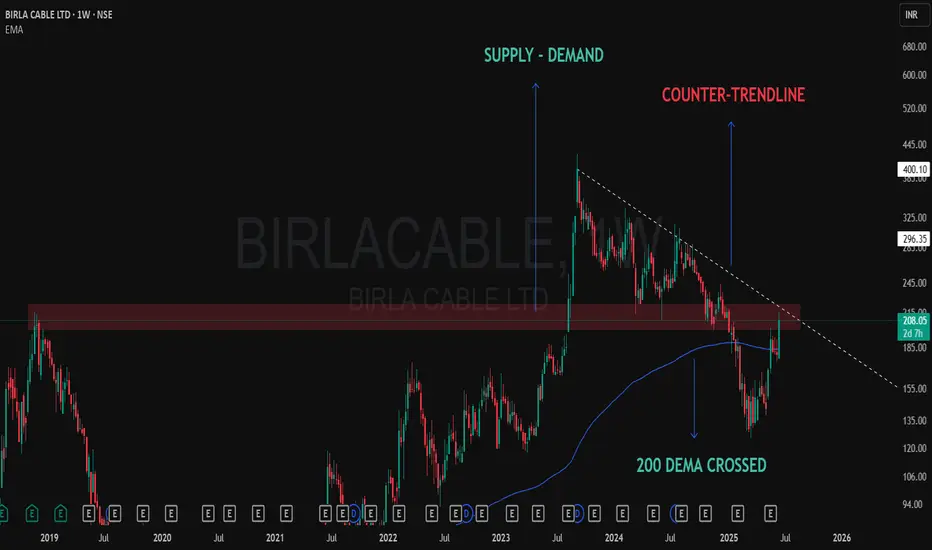
Technical Development on Weekly Chart – Birla Cable📈 BIRLA CABLE – Chart Talking Loud Now!
✅ 200 DEMA crossed
200 Dema was providing solid resistance and now taken out marked with blue line.
❌ At Counter-Trendline
Solid CT thrown from the top of the pattern, dotted white line shows that.
✅ Demand Zone Holding Strong
Clearly shown a solid supply zone which got converted into a Demand only after the Breakout some months back.
After months of consolidation and rejection from the same supply zone… price is now attacking with volume 🔥
🧠 “When structure aligns with emotionless patience, conviction follows.”
BIRLACABLE - DAY CHART TURNAROUND SOON...NSE:BIRLACABLE CHART ANALYSIS 🧐
Time frame - Day chart
🔹Trend: Correction Downtrend is in effect with low volume fall.
🔹 The last swing low made is insignificant and formed a double bottom structure, with a small RSI divergence.
🔹View: Breakout of a trendline and horizontal range around 263+ can trigger a change in trend, from down to fresh up trend.
Promoter holding is increasing cause it had a slow correction phase for a while now and it hit the major trendline support zone so that will be a high probability setup for a potential up move.
🟢Entry: 30 min close above 263+
♦️Risk:- 230 on weekly candle closing below.
🎯Targets :- 290,350+
Use position sizing and follow your money management rules too.
Detailed analysis on chart, Study it and mark levels on your chart.

Multi time frame positional trade idea for 16 July marketsI daily make educational content videos for swing / positional trading

BIRLACABLE Investment PickStock is in Uptrend, made a Strong Higher High and now falling back to the Breakout point, wait for the Price-action to Happen for a Proper Entry.
Maintain proper #Stoploss.

Birlacable potential upside candidatePrice retraced back to 61.8% fib from highs & holding nicely above 30 week ema.
Quart. result date is near, if numbers are good it can be a good potential upside candidate.
Disclaimer: Not Sebi Registered. Chart shared only for edu. purpose, Not a Buy/Sell recommendation.

Birla Cable Limited - Long Setup, Move is ON...#BIRLACABLE trading above Resistance of 355
Next Resistance is at 560
Support is at 229
Here are previous charts:
Chart is self explanatory. Entry, Resistances and Support are mentioned on the chart.
Disclaimer: This is for demonstration and educational purpose only. This is not buying or selling recommendations. I am not SEBI registered. Please consult your financial advisor before taking any trade.

Birla Cable Limited - Long Setup, Move is ON...#BIRLACABLE trading above Resistance of 229
Next Resistance is at 355
Support is at 151
Here are previous charts:
Chart is self explanatory. Entry, Resistances and Support are mentioned on the chart.
Disclaimer: This is for demonstration and educational purpose only. This is not buying or selling recommendations. I am not SEBI registered. Please consult your financial advisor before taking any trade.

Birla Cable has bullish connection!Birla Cable is showing strength with closing above important hurdle 162.
NOW
176 was Panic Sell Level which act as resistance, but If it will break and close above it for at least 3 days then it will become support for Birla Cable, And It may test 250 plus levels as per current triangle pattern target.
We will watch for Risk management 145 Level as Stop Loss.
SO, Risk to Reward ratio is favorable.
Risk is yours and Reward is too yours totally.
Time Frame : 80-110 days approximately.

Birla Cable Limited - Long Setup, Move is ON...#BIRLACABLE trading above Resistance of 185
Next Resistance is at 229
Support is at 136
Here is previous chart:
Chart is self explanatory. Entry, Resistances and Support are mentioned on the chart.
Disclaimer: This is for demonstration and educational purpose only. This is not buying or selling recommendations. I am not SEBI registered. Please consult your financial advisor before taking any trade.

Birla Cable Consolidation and BO#BirlaCable is showing a good 10 weeks consolidation and BO with good volume. CMP 191 can be added with 180 as SL on closing basis for 225. Above 230 closing will open a new price movement.


2 good swing trading ideas with price action analysisI daily make educational content videos for swing / positional trading

BIRLACABLE - Ichimoku Bullish Breakout Stock Name - Birla Cable Limited
Ichimoku Cloud Setup :
1). Today's close is above the Conversion Line
2). Future Kumo is Turning Bullish
3). Chikou span is slanting upwards
All these parameters are showing bullishness at Current Market Price
and more bullishness AFTER crossing 145
#This is not Buy and Sell recommendation to any one. This is for education purpose and a helping hand to learn trading in Market.
# Cloud Trading
# Ichimoku Cloud
# Ichimoku Followers
I hope you all like my analysis.
Please do share your thoughts into comment section.
Please give a like, it motivates me to do analysis.

BIRLA CABLE - SWING TRADE Birla cable is forming Ascending triangle pattern which is most profitable chart pattern but keep an eye on tradeline once it is broken, Heavy sell can occur in no time.
Trendline is the wall of Ascending triangle which should not be broken if you are positive about the upside move.
The Best way to follow my Analysis is if the following conditions apply.
Conditions -
1. Wait for the Market to Show you some (Rejection / Confirmation / Direction)
2.Wait for confirmation(Price Action Confirmation ( Pinbar , Bullish or Bearish engulfing / Break of structure Aka Support Or Resistance)
3.Do your Own analysis! (Draw Trend Lines / Support & Resistance Zones )
4.Always Use Risk Management (Risk 1% of your capital)
5.Entry Should be Made on The 4H Timeframe (Only if you have Confirmation)
6.Trade at own risk!
&. Plan Your Trade & Trade The Plan!
Let Me know if you have any Questions or Comments Below!
Negative Or Insulting Comments Are Not Welcome
Financial by Tradingview
Valuation
Market Capitalization
3.897B
Enterprise Value (MRQ)
5.478B
Enterprise Value/EBITDA (TTM)
8.9670
Total Shares Outstanding (MRQ)
30M
Number of Employees
—
Number of Shareholders
37.164K
Price to Earnings Ratio (TTM)
17.9012
Price to Revenue Ratio (TTM)
0.7270
Price to Book (FY)
2.0867
Price to Sales (FY)
0.7270
Balance Sheet
Quick Ratio (MRQ)
1.1374
Current Ratio (MRQ)
1.6894
Debt to Equity Ratio (MRQ)
0.4421
Net Debt (MRQ)
785.608M
Total Debt (MRQ)
824.752M
Total Assets (MRQ)
3.46B
Operating Metrics
Return on Assets (TTM)
0.0655
Return on Equity (TTM)
0.1225
Return on Invested Capital (TTM)
0.1153
Revenue per Employee (TTM)
—
Price History
Average Volume (10 day)
129998.1000
1-Year Beta
1.1001
52 Week High
177.5500
52 Week Low
72.7500
Dividends
Dividends Paid (FY)
−30M
Dividend Yield Forward
1.1547
Dividends per Share (FY)
—
Margins
Net Margin (TTM)
0.0406
Gross Margin (TTM)
0.1562
Operating Margin (TTM)
0.0611
Pretax Margin (TTM)
0.0546
Income Statement
Basic EPS (FY)
7.2500
Basic EPS (TTM)
7.2481
EPS Diluted (FY)
7.2500
Net Income (FY)
217.371M
EBITDA (TTM)
434.592M
Gross Profit (MRQ)
283.817M
Gross Profit (FY)
836.347M
Last Year Revenue (FY)
5.354B
Total Revenue (FY)
5.354B
Free Cash Flow (TTM)
Regards,
Aqib Malik

First Target Achived After Breakout Birla Cable Ltd. First Target Achived After Breakout Birla Cable Ltd.

Breakout in Birla Cable...Chart is self explanatory. Entry, Targets and Stop Loss are mentioned on the chart.
Disclaimer: This is for demonstration and educational purpose only. This is not buying or selling recommendations. I am not SEBI registered. Please consult your financial advisor before taking any trade.

Target 1 achieved in Birla Cable. Gain of 27% Target 2 is ON...This is follow-up on Birla Cable. Can check link to related ideas.
Target 1 achieved. Gain of more than 27%. Target 2 is ON.
Chart is self explanatory. Entry, Targets and Trailing Stop Loss are mentioned on the chart.
Disclaimer: This is for demonstration and educational purpose only. This is not buying or selling recommendations. I am not SEBI registered. Please consult your financial advisor before taking any trade.

BIRLACABLE LONGBIRLACABLE
CMP -127
Target - 210
SL -87WCB
#BIRLACABLE #stocks #StockMarket #investing #trading #investments #Breakout #NSE #BSE #Nifty #Sensex #Chart #ChartOfTheWeek #Chart #trader_rohan


BIRLA CABLE LTD LONGBIRLA CABLE LTD LONG
Breakout and retest done at a Monthly level.
Target 178 - 224


Birla Cable Limited Birla Cable Limited trading in a triangle pattern. wait for the breakout with high volume
