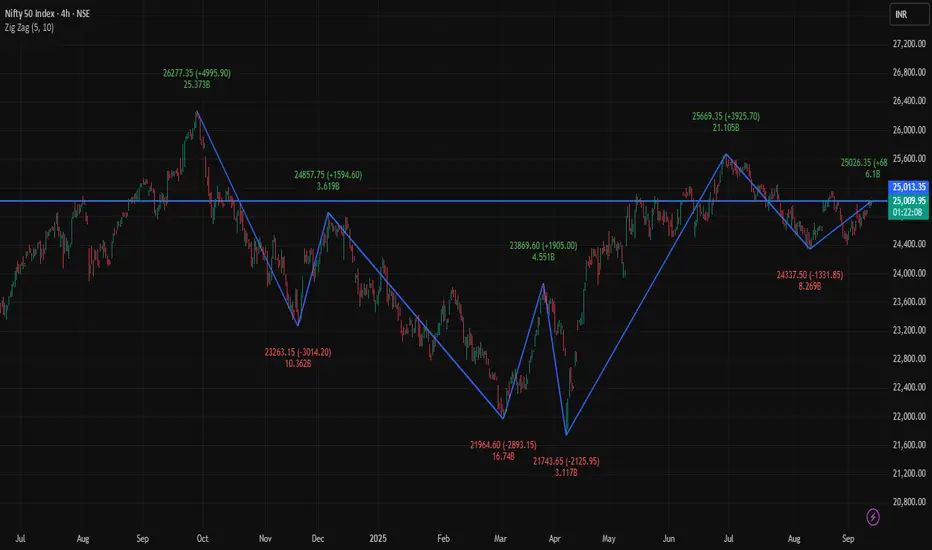
NIFTY 4H Time frame📊 Current Snapshot
Current Price: ₹25,010.95
Day’s Range: ₹24,940.15 – ₹25,008.95
Previous Close: ₹24,977.95
Opening Price (4H): ₹24,940.15
Volume: Approximately 6.16 million shares
📈 Trend & Indicators
Trend: Neutral to mildly bullish; trading near 50-hour and 200-hour moving averages.
RSI (14): Neutral zone.
MACD: Positive → indicating mild bullish momentum.
Moving Averages: Short-term averages indicate neutral to slightly bullish outlook.
🔮 Outlook
Bullish Scenario: Break above ₹25,008.95 with strong volume could target ₹25,186.00.
Bearish Scenario: Drop below ₹24,940.00 may lead to further decline toward ₹24,871.10.
Neutral Scenario: Consolidation between ₹24,940.00 – ₹25,008.95; breakout needed for directional move.
📌 Key Factors to Watch
Economic Indicators: Interest rates, inflation, and RBI policy updates.
Sector Performance: Trends in the IT and financial sectors.
Global Cues: Global market trends, US indices, crude oil, and currency movements.
BIT
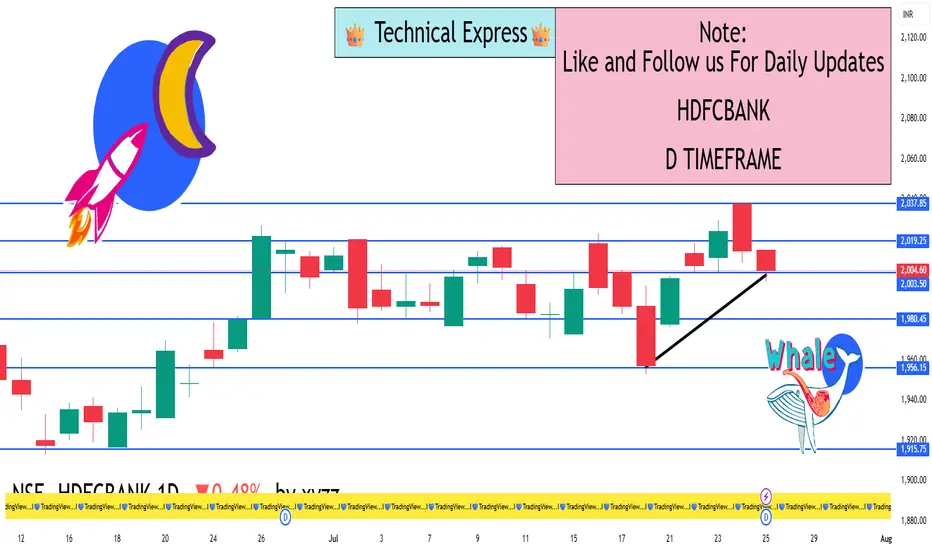
HDFCBANK 1D TimeframeClosing Price: ₹2,004.60
Opening Price: ₹2,018.80
Day’s High: ₹2,028.00
Day’s Low: ₹1,996.75
Net Change: –₹16.10 (–0.80%)
Trend: Mild Bearish
🔻 Support Levels
₹1,985 – Immediate support (20-day moving average)
₹1,950 – Short-term support (50-day moving average)
₹1,910 – Medium support (100-day moving average)
🔺 Resistance Levels
₹2,030 – Recent swing high and near-term resistance
₹2,050 – Breakout zone if momentum picks up
₹2,100 – Major resistance area
📈 Technical Indicators
RSI (Relative Strength Index): ~62
➤ In neutral to bullish territory, showing healthy momentum but close to overbought levels.
MACD (Moving Average Convergence Divergence):
➤ MACD line above Signal line – currently a bullish signal.
Volume:
➤ Normal trading volume; no heavy buying or panic selling.
➤ Indicates steady participation from both retail and institutional investors.
Candlestick Pattern:
➤ Small bearish candle after a strong bullish move earlier in the week.
➤ Indicates temporary profit booking or hesitation near resistance zone.
🧠 Market Sentiment
Overall sentiment remains positive for HDFC Bank due to:
Strong financials and balance sheet
Good loan growth reported in recent results
High investor confidence post bonus issue announcement
However, profit booking is likely near ₹2,030 as it is a psychological and technical resistance.
✅ Conclusion
Short-Term View: Mild pullback within an uptrend; no major weakness.
Medium-Term Trend: Still bullish as price remains above key moving averages.
Action to Watch:
A breakout above ₹2,030 may trigger a rally toward ₹2,050+.
A drop below ₹1,985 may invite short-term selling toward ₹1,950.
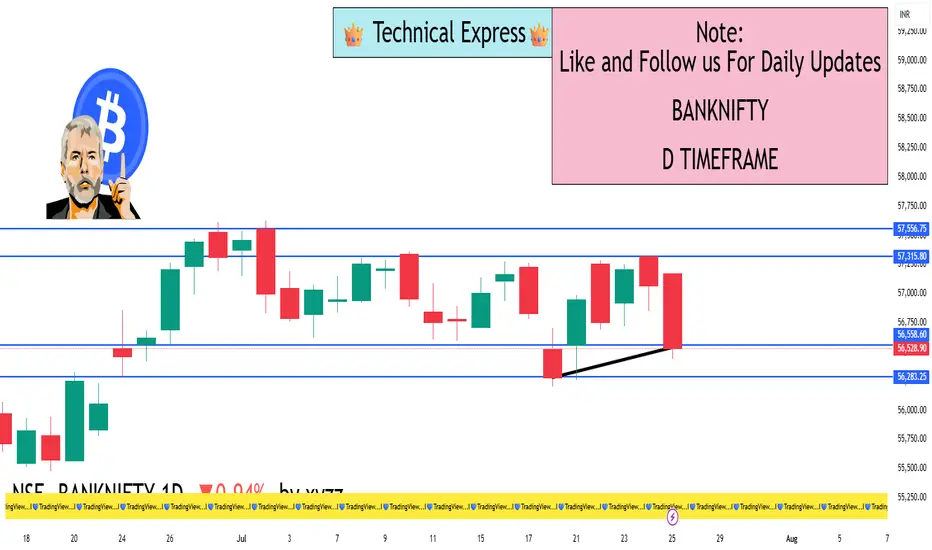
BANKNIFTY 1D TimeframeClosing Value: 56,528.90
Net Change: −537.15 points (−0.94%)
Opening Price: 57,034.40
Day’s High: 57,170.70
Day’s Low: 56,439.40
Trend: Bearish
📊 Technical Analysis
✅ Candle Pattern:
A strong bearish candle was formed.
Price opened higher but failed to sustain and closed near the day’s low — a sign of heavy intraday selling.
🔻 Support Zones:
56,400 – Immediate support (also the day's low)
56,000 – Psychological round number
55,750 – Medium-term support (from earlier price consolidation)
🔺 Resistance Zones:
56,800 – Near-term resistance
57,000 – Critical level; needs to be reclaimed for bullish reversal
57,300 – Stronger resistance zone based on recent highs
📈 Indicator Summary:
RSI (Relative Strength Index): Likely below 50, signaling weakening bullish momentum
MACD (Moving Average Convergence Divergence): Bearish crossover remains intact
Volume: Higher than average, suggesting institutional selling pressure
🧠 Market Sentiment:
Bearish sentiment prevailed across major banks including HDFC Bank, ICICI Bank, Axis Bank, Kotak Bank, and SBI
Pressure also visible in PSU banks (like PNB, Bank of Baroda, Canara Bank)
Overall market mood was risk-averse due to global uncertainty and potential interest rate impact
Foreign Institutional Investors (FIIs) continued their selling streak
Traders remain cautious ahead of upcoming quarterly bank results
✅ Conclusion:
Bank Nifty is currently in a short-term downtrend.
If 56,400 breaks decisively, it may head toward 56,000 and 55,750.
For bulls to regain strength, Bank Nifty must cross back above 57,000 with strong volume and momentum.
Learn Institutional Trading Part-3🔍 What You'll Learn:
✅ Market Structure Mastery
Understand how price moves through different phases — accumulation, manipulation, expansion, and distribution — and how institutions position themselves at each level.
✅ Order Flow & Liquidity Concepts
Institutions focus on liquidity. Learn how they seek out stop-losses and resting orders to fill large positions without moving the market too much.
✅ Smart Money Concepts
Identify where "smart money" (institutional money) is entering and exiting the market using tools like:
Fair Value Gaps (FVG)
Order Blocks
Breaker Blocks
Liquidity Pools
Inducement and Mitigation zones
✅ Volume & Open Interest Analysis
Discover how volume analysis and options open interest reveal institutional footprints in futures and options markets.
✅ Institutional Risk Management
Learn how institutions manage massive portfolios with strict risk control, position sizing, and hedging techniques.
✅ High Probability Trade Setups
Master trade setups based on institutional logic — including trap setups, liquidity grabs, and imbalance trades — with better reward-to-risk ratios.
🧠 Why Learn Institutional Trading?
Retail traders often fall prey to emotional trading and market manipulation. Institutional traders, however, rely on logic, data, and strategy. By learning institutional trading:
You'll stop chasing price and start anticipating moves.
You'll learn to trade with the big players, not against them.
You'll gain confidence by using smart money principles instead of random indicators.
🚀 Who Should Learn This?
Day traders looking to level up
Swing traders aiming for high precision
Option traders focusing on large-scale setups
Anyone who wants to understand how real money moves the market
📈 Ready to Ride the Big Moves?
“Learn Institutional Trading” is your pathway to mastering the strategies that drive the global markets. Say goodbye to confusion and emotional trades — and start thinking like a professional.

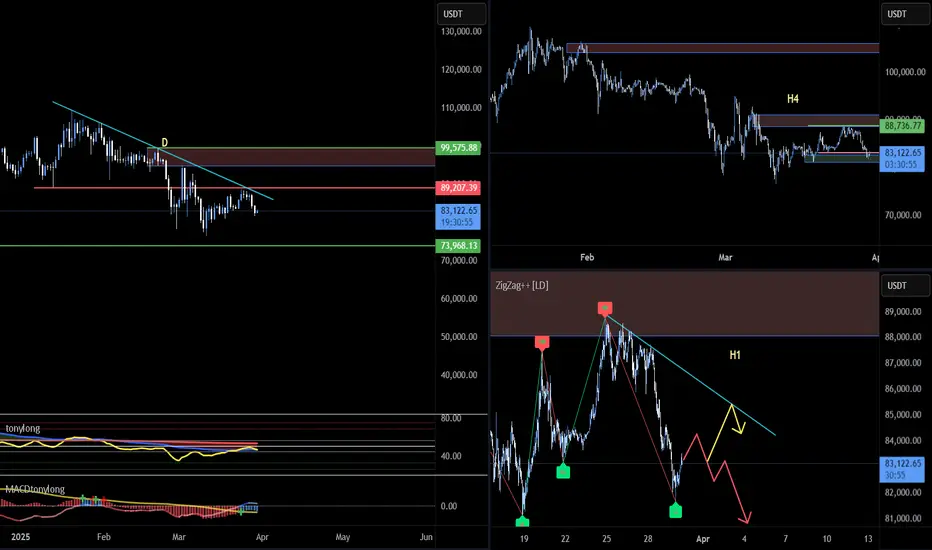
BTC23: BTC falls again. Testing support or finding a new bottom?📊 BINANCE:BTCUSD continued to decrease again in the past 2 days. Let's evaluate and look for opportunities through the multi-timeframe perspective below BINANCE:BTCUSDT :
🔹 **D Frame**: Before the price decrease in the past 2 days, we can see that although BTC had a recovery phase before, the fake decrease structure has not been broken yet.
🔹 **H4 Frame**: The keylever zone has been broken as marked on the chart, however, this is the first decrease after the increase wave in the past days, so it will need clearer confirmation.
🔹 **H1 Frame**: Currently, the price is reacting to the support zone of 81~83k. However, the price is still in a downward wave if looking at the price structure.
🚀 **Trading plan:*
📌 At the present time, we can look for a SELL position in line with the main trend in diagonal resistance areas to look for a trading position in line with the main trend. The current price is at an important support area, so it is no longer suitable to SELL at this time. BUYing in this area is not recommended when the downtrend has not shown any signs of ending. We will have to wait for a clearer signal from the price structure to properly assess the effect of the current support area.
💪 **Wishing you success in making a profit!**
BTT Bit Torrent Price PredictionBTT Bit Torrent Price Prediction and Technical Analysis.
Currently BTT trading at very low price and RSI is extremely low i.e below 30
B

BITCOIN - Short Term Targets - Swing TradeGet ready to ride the bull...
1.) Accumulate in the buying range.
2.) Close your positions if daily candle closes below stop loss levels
3.) Take your profits if your level of target is reached.
Happy trading :)

B

BTCUSD UPTREND All Videos/Information on this channel are for Education purpose only .They are not buy/Sell Recommendations . Please consult your financial Advisor before taking any trade or investment decisions .
