Bitcoin Bulls Target $113K**Bitcoin (BTC/USD) Analysis — November 2025**
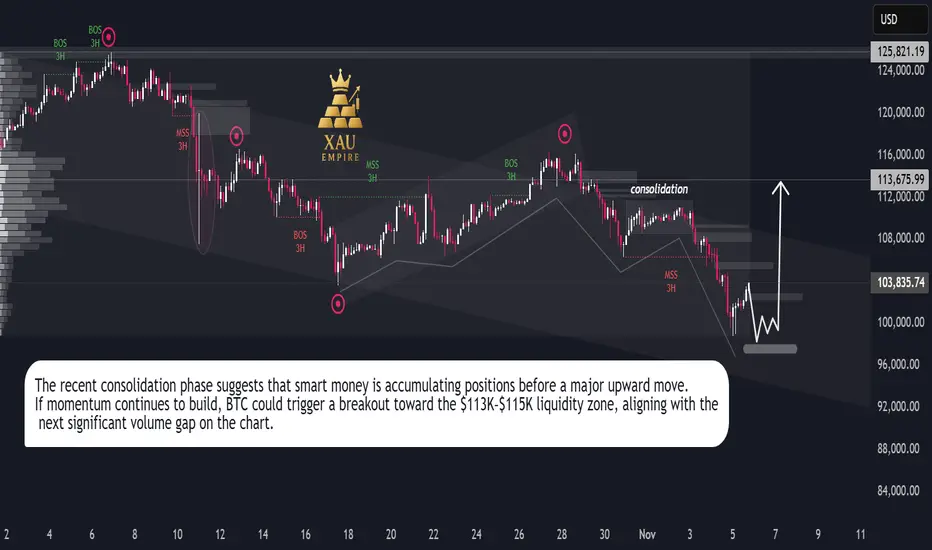
Bitcoin has been moving within a controlled downtrend channel, facing continuous lower highs since late October. The market recently went through a **liquidity sweep**, followed by a minor **market structure shift (MSS)** on the 3-hour timeframe. This suggests exhaustion in the current bearish leg.
After a period of **sideways consolidation**, price is testing a strong accumulation zone near the **$100K–$97K** region. This zone aligns with prior demand and high-volume nodes, making it a potential base for a bullish reversal.
A clean rebound from this level could drive Bitcoin toward the **$113K–$115K** area, where the next liquidity cluster sits. If buyers regain momentum, this move could accelerate into a **V-shaped recovery**, confirming the start of a fresh mid-term bullish cycle.
Overall sentiment remains **bullish**, supported by renewed buyer activity and potential macro-driven inflows ahead. Traders should watch for volatility spikes as the market transitions from accumulation to breakout mode.
**Key Takeaway:**
BTC is stabilizing near key demand, eyeing a rebound toward $113K+. Momentum confirmation above the short-term consolidation zone could trigger a strong upward continuation.
**#Bitcoin #BTCUSD #CryptoAnalysis #BitcoinForecast #BTCPricePrediction #CryptoTrading #BullishReversal #CryptoMarket #TradingViewAnalysis**
Bitcoin-btcusd
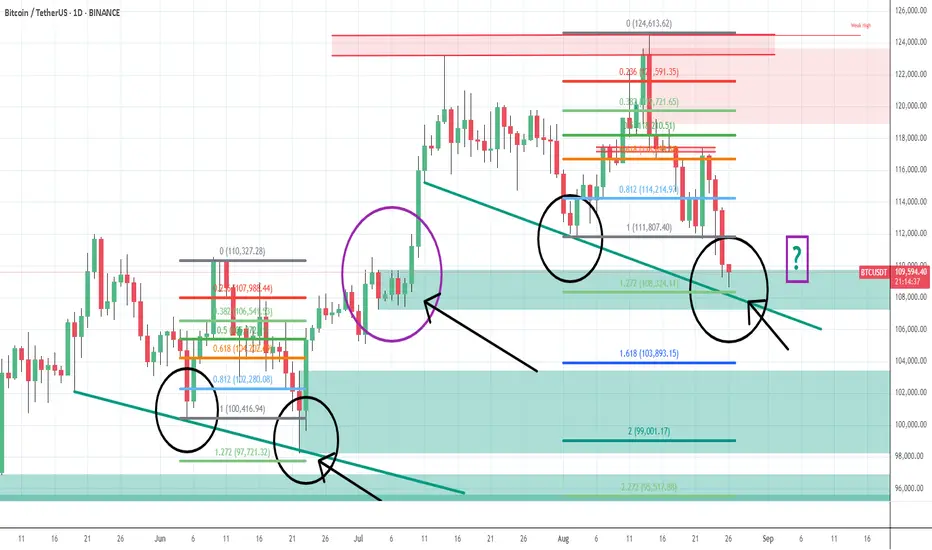
Bitcoin – Buying the Trendline, Not the HypeBitcoin (BTCUSD) continues to respect its rising trendline structure , showing consistent demand on every retest. This type of price action often reveals where smart money is quietly adding positions, not chasing, but accumulating near support.
Each of the highlighted points shows how price has respected this trendline multiple times, forming a clean series of higher lows. As long as this level holds, the broader direction remains bullish.
Currently, BTC is testing this key support once again. I’m positioning near the trendline because the risk is clearly defined , and the potential reward toward 111K+ remains wide open.
Short-term volatility can still appear, but structure beats emotions . As long as buyers defend this zone, we may see another impulsive leg forming soon.
Disclaimer: This analysis is for educational purposes only. It’s not investment advice. Always do your own research before trading.

BTC Market Update: Bulls Regain ControlBitcoin has stabilized after a sharp corrective phase, forming a consolidation structure around the $111,000 area. Recent sessions indicate that sellers are losing dominance while buyers are quietly re-accumulating within the current range. This type of price action often appears before a potential short-term recovery move.
Market volume remains steady, and the structure shows compression—suggesting liquidity buildup below the current level. If this consolidation sustains without breaking lower, a breakout toward the $115,000–$116,000 region appears likely. A clean move beyond this zone could invite stronger bullish continuation as sidelined traders re-enter.
However, the broader trend remains cautious, as macro conditions and dollar strength could still limit momentum. Short-term traders may look for entries near the range lows with clear invalidation below $108,000. Proper risk management remains essential, targeting gradual exits around mid-range levels and scaling profits near projected resistance zones.

Bitcoin Faces Sudden Shakeout After Weeks of CalmBitcoin Volatility Returns as Market Momentum Resets
Hello Traders,
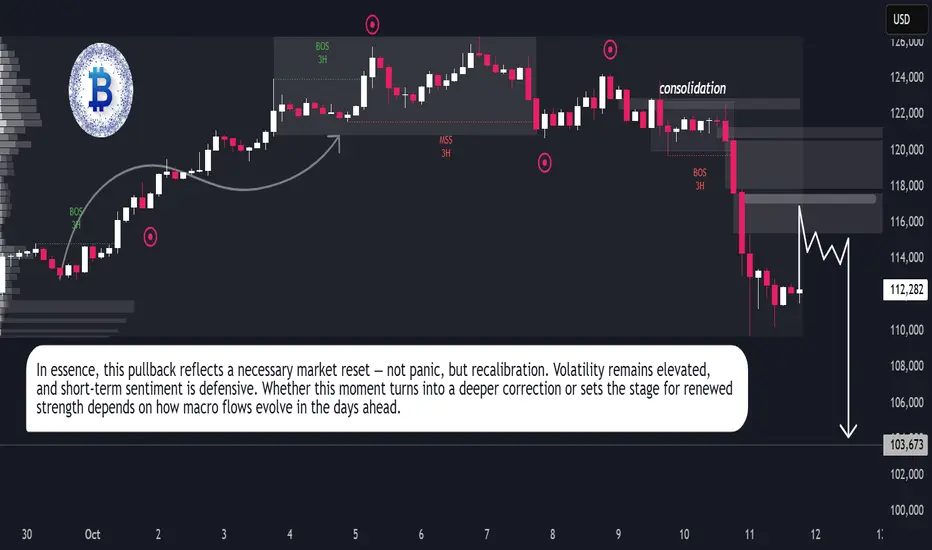
The Bitcoin market experienced a sudden burst of volatility in the recent session, ending a period of relative calm. On the 4H timeframe (Binance), intense selling pressure drove prices from near $117,000 down to roughly $109,000 before stabilizing around the $112K region. The swift decline marked a clear shift in short-term momentum, showing that buyers are beginning to lose dominance as broader market sentiment cools.
This pullback unfolded against a backdrop of renewed global uncertainty. A series of trade-related policy headlines reignited risk aversion, while continued strength in the U.S. dollar added additional stress to crypto markets. Institutional flows briefly reversed, signaling reduced confidence in near-term upside potential. The result was a wave of forced liquidations, magnified by leverage, as traders rushed to adjust exposure during the drop.
Despite the intensity of the move, market conditions remain structurally healthy. On-chain data shows that long-term holders are largely unmoved, suggesting this phase is more of a short-term repricing than a major cycle reversal. Derivative markets, however, have cooled significantly — open interest has thinned, and funding rates have normalized, indicating a temporary reset in speculative participation.
In the coming days, Bitcoin’s behavior will likely depend on liquidity dynamics rather than new macro data. With upcoming U.S. economic reports delayed and the dollar holding firm, volatility may persist as traders respond to headlines and reposition ahead of the next policy developments.
For now, the market appears to be in a state of balance after rapid liquidation. Whether this forms a new accumulation base or precedes deeper correction will depend on how quickly momentum returns. The broader sentiment remains cautious but stable — a waiting phase, as the market tests its conviction once more.
Gold Neowave Bulletin| 10/10/2025
Namaskaram Everyone
Welcome to intelligent investor, we provide market insights by synchronising and combining all the price action waves from different time frames and gives you single trend.
Here are all our previous gold analysis, with this you will understand how with Neowave Theory you will have an edge in the market.
Previous Neowave Bulletin
09/12/2025
07/10/2025
01/10/2025
30/09/2025
29/09/2025
OANDA:XAUUSD FOREXCOM:XAUUSD FX:XAUUSD VANTAGE:XAUUSD MCX:GOLD1!

Bitcoin Under Pressure: Bearish Momentum BuildsBitcoin recently transitioned from a corrective decline into a consolidation phase, where price activity showed reduced volatility and market indecision. The breakout from this range has introduced renewed momentum, highlighted by strong bullish candles and a clear shift in trend dynamics. This move reflects fresh capital entering the market, suggesting growing investor confidence and positioning for potential continuation.
Despite this momentum, the structure also shows signs that rapid acceleration could invite short-term profit-taking, which may create phases of corrective retracement before the broader trend direction is reestablished. The market remains sensitive to global financial sentiment, liquidity cycles, and broader adoption narratives, meaning volatility should be expected even within an upward bias.
Overall, current conditions reflect a shift toward renewed optimism, with momentum favoring buyers while maintaining the likelihood of temporary corrections as part of a healthy market cycle.

Bitcoin Market Report – Liquidity Grabs Before Next ExpansionThe market is showing clear signs of engineered volatility, with strong impulsive moves followed by rapid retracements. This behavior reflects liquidity targeting, where price sweeps both sides before resuming its broader path.
Current conditions suggest Bitcoin is in a redistribution stage, with momentum alternating to trap short-term participants. The repeated liquidity grabs signal that larger players are accumulating positions while clearing out weaker hands.
The overall structure points to continued testing of lower liquidity pools before any major directional expansion. Once this phase is complete, the market is likely to enter a more decisive trend, supported by the buildup of institutional flow and reduced volatility pockets.
In short, Bitcoin is cycling through liquidity collection and preparation, positioning itself for a larger move as market balance shifts.

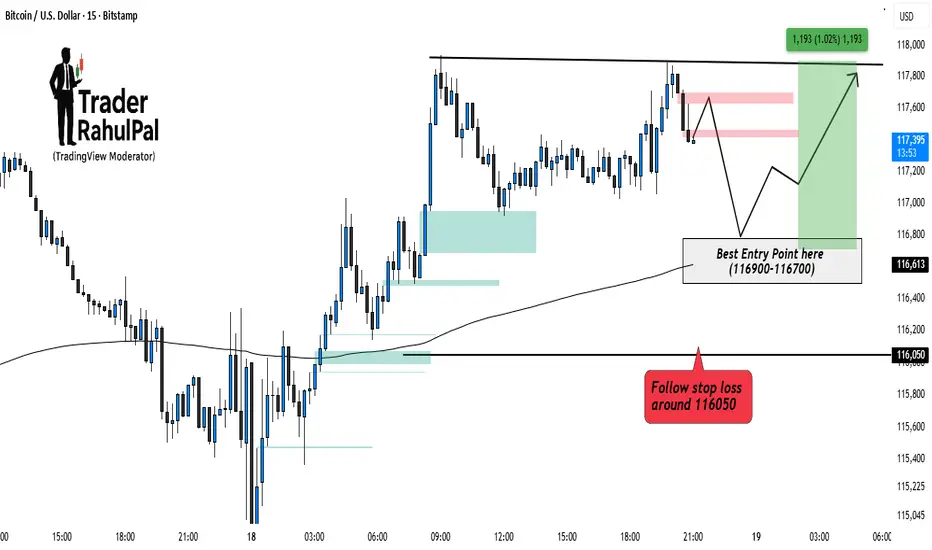
Bitcoin Bullish side Entry Setup Intraday – Key Levels to Watch!Bitcoin is consolidating near its upper resistance zone after a recent bounce. Price action suggests that a pullback into the 116900–116700 range can offer a high-probability entry for buyers. Maintaining a stop loss around 116050 helps to protect against deeper downside risk. As long as this zone holds, the bias remains bullish, with potential upside toward 117800–118000 . Intraday traders should closely watch how price reacts around the entry zone before positioning.
Disclaimer: This analysis is for educational purposes only and should not be taken as financial advice. Please do your own research or consult your financial advisor before investing.
BTC - 29th Aug - collect more qty on every dipswe have monthly expiry and max pain at the top around 117K not sure exactly as it keeps changing some times. I expect any of the mentioned support levels to hold since it went up with demand followed by good data from US and positive equity... long BTC with required enough enough margins so no one can liquidate even during sleeping... weak hands loose btc to whales during dips... collect btc qty on dips... take care, cant predict the exact support levels big players thinking .... But every big players buy every dip when good volume seen for sure
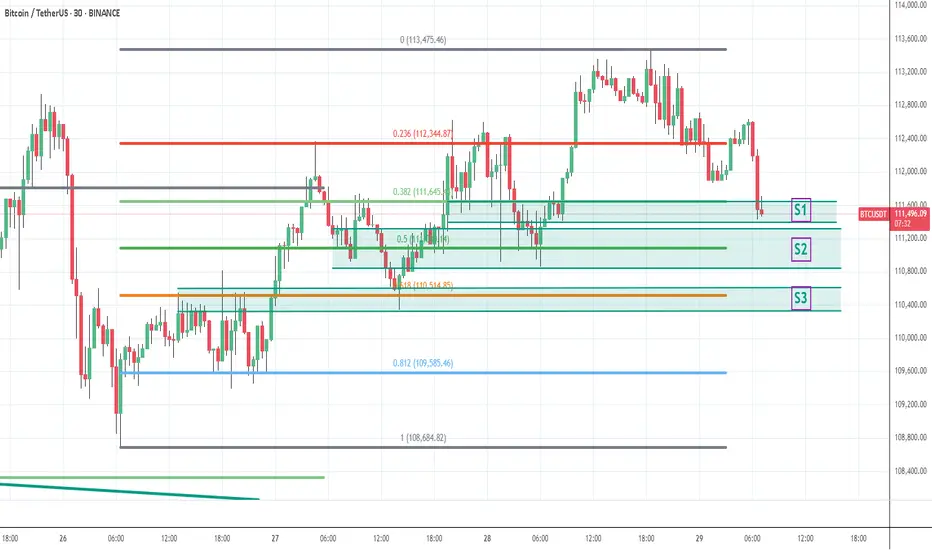
BTC - will bounce and move up only from today low - 26th AugBTC price has reached a crucial technical area from where price will most likely bounce and move up only and wont fall further much. explained in chart with fib levels and what happened in history
Buy BTC for 10K up move - Price Action confirmationLast few days multiple false news were spread in middle of correction.
Deliberate sell off by big players to trap the retailers etc etc
joined with US FOMC meetings etc only played down side which is
not technical.
I predict price tracing back to 124K asap.
Bitcoin is Digital Gold. At the same time keep long qty with liquidation level as
low as 105 or 100 or 95 K so no one can liquidate you....
Keep Booking profits and re enter at every dip.... rock it my friends

Bitcoin is Bullish or Bearish - 20th Aug 2025First, In my previous charts mentioned take long with money management. I didnt expect this much of fall and i had to cut my longs to hold the rest. Technically no answer for this fall since its mad short selling and group games or big players selling to get liquidity before they buy. They are buying at every dips in very large qty. Exchanges buy sell as well to kill and eat others
Price is at previous tested proved support. Any analyst can only suggest buy this dip and to be 100% security allow price to test the support again and then buy based on reaction. Support and Resistance are tested and will hold or breakout as well right. In my view for Bitcoin every previous proved support should not break since whales buy and rise the price. Not sure who is that whales selling causing support to break. In news I didnt see or knowing how is that big player sold causing price to drop this much. Stay Safe, I am doing my best or suggesting what I am also doing. God Bless Bitcoin traders.

BTC - 18th Aug Before US Open - Dump & Pump or Dump ?History was repeating exactly till half of 5th wave but market considered new ATH as possible profit booking and sold off instead of going in to parabolic up move. The exact place where it has to start the parabolic up move it got dumped. Either its due to CME close and few market players doing false move or its sure dump or lack of buying at these high price or ETH got importance instead of BTC. In this cycle ETH, SOL and XRP and few mother crypto pulling the liquidity and BTC missing those money. Need to wait and watch today and this week. Right now price is still at swing low from where it can move to new ATH to 127 and 130K.

BTC - TP 130K - History repeating with more bullish trendIn my previous chart I clearly said we are going to see 3rd wave as per history pattern seems to be repeating as per ABC pattern worked exactly. In chart clearly shown 3rd wave, 4th wave and one top followed by accumulation (right now happening) after 3rd wave and before parabolic 5th wave exactly happenings. From ABC to 4th wave its exact price move repeating and I wish and expecting the 5th wave in parabolic move and reach the FIB extension shown in chart for 130K logic. since its more bullish may be TP may be higher than 130K as well. Right now price is in accumulation phase after one top followed by wave3 top.
Do not lose your 50 to 60% BTC qty in any false moves. And do not take 100% long qty as well
Maintain Money Managment strictly.
Factors Supporting Crypto - mainly BTC and ETH
1) Fiat money printing causing $ index and US dollar weak
2) Strong US data, Euro zone data and no recession in any country now
3) All trade tax with Europe and China and most of the countries are good
4) Pension money flow in crypto in US + new adoption by corporates one after another
5) New IPO focusing on BTC and nonstop ETFs fund flow as usual

BTC - 17th Aug Asia Night view - Bullish TP1 -120700Explained my view in chart text it self. Its Bullish and expecting 120700 and 121600 minimum first to see if any resistance ome or not... not point is selling now and just need to be 50 to 60% capacity long in BTC now

BTC - 17th Aug - Buy @ 117K during re test of supportBitcoin reacts and respects Fib levels and as expected seen taking support at very crucial and stronger support area around 117 K. Its a confluence of support area. 1) 10th Aug Strategy bought BTC at this area, 2) resistance line broken area converting to support. 3) FIB golden line area. Price is coming for re test of the support and expecting very good buying interest today 17th Aug. Its a must buy time in Bitcoin today. Buy with all required Money Management.
Last few days ETFs funds inflow only seen so many people are accumulating only,

BTC - 14th Aug - Buy re enter level - Buy below 121 for TP -131In my previous charts i clearly commented to Book Profit.
No Price has done correction 2nd wave all most done and
is expected to take key support at support & resistance
inter change zone marked in green in chart. This area is strong support zone forming a
strong W formation and rectangle of support given breakout on
up side. I strongly expect price to take support from here and move up side mostly.
Keep buying the dips with money management.
This view is given before US Jobs data expected in less than 1 hr from now
As pointed out earlier given CPI data failed to create any impact.
In my view this Jobs data too is not important for Bitcoin but few people
listen to others and do buy or sell ... Market makers need to pull BTC from others.
Buy BTC below 121 in small qty and green area at 121300 is strong level to accumulate.
Up move could be in sub waves which we will know based on price action.
We got Buy levels for now. Price went to new ATH due to so many big whales massive
buying and they are holding ... only the weak hands keep seeing US data and other news sell.
All corrective trend have lesser volume compared to main trend.
US Dollar Index and Dollar - Fiat money will keep crashing and Bitcoin going to Moon - 150 or 180 after 131 K

BTC - 13th Aug viewPrice seems to be making sub waves inside the 5th wave where we have new ATH targets open.
In the sub waves price just took 2nd wave support and make 3rd wave and need to see 4th sub wave re test 120200 to 120400 support area or else make false move by breaking to 118 which is a possibility but i do not want or do not expect it to happen after such a good up move. Just want to caution so money management is taken care and do trade only with 50 to 60% capital all ways. buy the dips and sell the rallies with profits and with no greed for more and more without taking profits... we will get dips too... or at least higher low with proved support to take raisk instead of chasing

Bitcoin Technical Analysis for the Week of 29, June - 07, July
Here's a Bitcoin price analysis for June 29, 2025, based on available data and technical indicators from recent sources:
#Current Market Overview
Price: Bitcoin is trading around $107,331.08 as of June 28, 2025, with a slight 24-hour decrease of approximately 1.99%.
#Market Sentiment: The market shows a neutral to bullish sentiment. The Fear & Greed Index is at 65 (Greed), indicating optimism but not extreme euphoria. Technical indicators suggest a 67% bullish sentiment, with 25 bullish signals versus 5 bearish signals.
Trading Volume: 24-hour trading volume is around $43.1 billion, slightly below recent averages, suggesting cautious trading amid volatility.
~~ Technical Analysis ~~
Price Trends:
Bitcoin is currently testing support at the 20-day EMA ($106,211), with additional support at the 50-day EMA ($103,110) and 100-day EMA ($98,807). The 200-day EMA ($93,092) serves as a key macro support level.
The 50-day moving average is rising and remains above the 200-day moving average, forming a golden cross, a bullish indicator.
Bitcoin is within a descending triangle pattern, which could resolve by July 1, 2025. A breakout above $110,000 could signal a new bull run, while failure to hold $102,000–$104,000 may lead to a drop toward $95,000–$98,000. even to $90,000.
Key Levels:
Support: $100,000 (recently held), $98,000 (psychological), $95,000 (flag pattern lower border).
Resistance: $108,700 (recent high), $110,000 (key psychological level), $112,000 (all-time high from May 2025)
Trend Bullish - Chart for your reference
-- Disclaimer --
This analysis is based on recent technical data and market sentiment from web sources. It is for informational purposes only and not financial advice. Trading involves high risks, and past performance does not guarantee future results. Always conduct your own research or consult a SEBI-registered advisor before trading.
#Boost and comment will be highly appreciated
Bitcoin (BTC) Technical Analysis for the Week of May 26 - June 1#Current Price and Market Context (as of May 24, 2025):
Price: Bitcoin is trading around $103,000–$111,000, with recent consolidation near $103,000 after facing resistance at $105,000.
Market Sentiment: Bullish, with the Fear & Greed Index at 78 (Extreme Greed) and 28 technical indicators signaling buy versus 6 bearish signals.
Volatility: Bitcoin has shown increased volatility recently, with a 0.94% daily volatility estimate.
# Forecast for Next Week (May 26 - June 1, 2025)
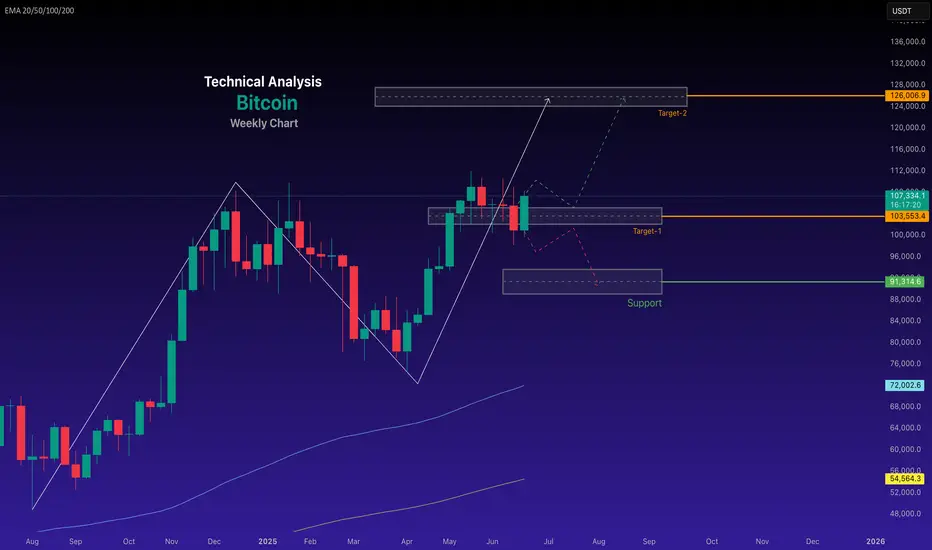
--Bullish Scenario:
Probability: High (based on 73% bullish market sentiment and technical indicators favouring buy signals).
Price Target: $124,000–$127,000, with a potential push toward if resistance at $105,000 is decisively broken in weekly time frame
Catalysts:
Continued institutional inflows (e.g., $6.9B in U.S. spot Bitcoin ETF inflows over three weeks).
Sustained trading above key EMAs and support levels ($103,000–$106,000).
Bearish Scenario:
Probability: Moderate (due to overbought RSI and recent resistance at $105,000).
Price Target: A pullback to $100,000–$103,000, with a deeper correction possible to $95,000 if support at $103,000 fails.
-- Disclaimer --
This analysis is based on recent technical data and market sentiment from web sources and X posts. It is for informational purposes only and not financial advice. Trading involves high risks, and past performance does not guarantee future results. Always conduct your own research or consult a SEBI-registered advisor before trading.

Bitcoin Breaks Key SupportBTC has just broken down from an important support level, which is now likely to act as resistance around the 84,000 area. The price currently at 81,415, indicating a relatively significant breakdown.
What's particularly concerning here is that we've not only dropped below that horizontal support zone (now resistance), but we've also broken below the green ascending trendline that had been supporting price action since early March. This double breakdown (horizontal support + trendline support) strengthens the bearish case in the near term.
The chart shows that Bitcoin had been trading within a rising channel, but this recent move suggests we might be seeing a shift in market structure. Note how price already attempted a recovery after the initial breakdown but was rejected right at the underside of that previous support zone, confirming it's now acting as resistance.
Looking at the bigger picture, there's still that major resistance zone sitting around 93,000-95,000 that capped previous rallies. For longer-term bulls, the substantial support zone around 72K-74K (marked by the green horizontal area) could be the level to watch if this current weakness continues.

BTC#22: BTC recovers slightly. Is the bear wave over?
In the past few days, BINANCE:BTCUSD has been continuously SW in the 81~85k area. Is this a sign that BTC will rise again? Let's analyze in detail and plan a trade BINANCE:BTCUSDT :
1️⃣ **Fundamental analysis:**
📊 The IMF has included Bitcoin and other digital assets in the framework of the global economic report for the first time. This shows that BTC is being recognized as a real asset.
🚀 The probability that the US government will buy Bitcoin in 2025 is 30% with information that the Trump administration may use profits from Gold to increase Bitcoin reserves
2️⃣ **Technical analysis:**
🔹 **Frame D**: the bear wave has not shown any signs of ending. The price has been anchored in the 80~85k area for a long time, but there has been no significant fluctuation and the sign of recovery is still unclear.
🔹 **H4+H1 frame**: The current short-term price structure is temporarily increasing with the appearance of higher peaks and higher bottoms. However, the price has not surpassed the important key zone to change the main trend.
3️⃣ **Trading plan:*
📌 At the present time, the current price has no clear signs when BTC is still fluctuating continuously in the SW area. Currently, the price is in a recovery phase with the nearest target being the resistance area of 88~91k. The current area is also not good for seeking profit from BUY positions. We can wait for the price reaction to the resistance area to consider establishing a SELL position. Prioritize trading in accordance with the main trend.
💪 **Wish you success in making profits!**

Bitcoin Looking good here for short termBitcoin Looking good here for short term, If bulls able to hold price above 80K then we can expect a good bullish rally for short to mid term towards 95k and then 100K.
