Will Ethereum Break $1875 Resistance this Time?🚨 BREAKOUT WATCH: If Ethereum breaks above the key $1875 resistance, it opens the door for a bullish rally toward $3000 in the coming weeks.
Strong breakout = high momentum setup.
Bitcoin (Cryptocurrency)

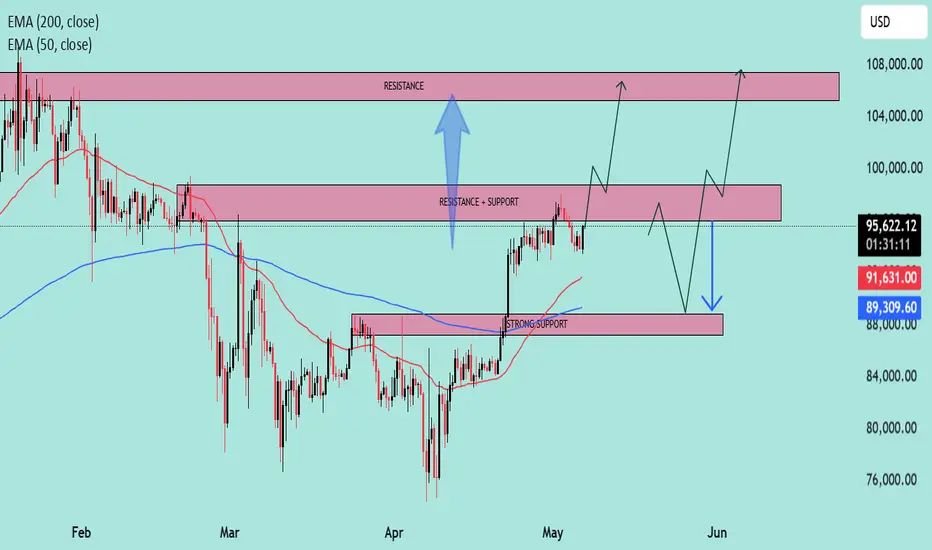
BTC at Key Inflection Zone – Breakout or Rejection Ahead?Asset: BTC/USD
Timeframe: 4H or Daily (based on visual pattern structure)
As of: May 6, 2025
Indicators:
50 EMA (Red): $91,615.79
200 EMA (Blue): $89,305.75
Key Technical Zones:
🔴 Resistance Zone: ~$104,000 – $108,000
This area has historically acted as a major supply zone.
Price has been rejected from this level multiple times, indicating strong selling pressure.
🔁 Flip Zone (Resistance turned Support/Support turned Resistance): ~$95,500 – $100,000
The current price ($95,234.23) is testing this zone from below.
A confirmed break and hold above could signal continuation toward the higher resistance.
🟢 Strong Support Zone: ~$88,000 – $91,000
Confluence of 50 EMA and 200 EMA adds strength to this demand zone.
Previous breakout level and accumulation area.
EMA Outlook:
50 EMA > 200 EMA: Short-term bullish crossover is active, indicating bullish momentum.
Both EMAs are sloping upward slightly, suggesting trend strengthening.
Price is currently above both EMAs, which acts as dynamic support.
Potential Scenarios:
✅ Bullish Scenario:
If price reclaims the $95,500–$100,000 resistance-turned-support zone:
Expect upward momentum to continue.
Target: $104,000–$108,000 zone.
Break of $108K could lead to a macro bull continuation.
⚠️ Bearish Scenario:
If price rejects the current zone and fails to hold above the $91,000 support:
Look for retest of $88,000–$89,000 area (confluence with EMAs).
Breakdown below that zone would invalidate bullish structure and signal potential deeper correction.
Summary:
Bias: Bullish above $91K, Neutral between FWB:88K –$91K, Bearish below $88K.
Key Confirmation Needed: Daily close above $100,000 for strong bullish continuation.
Risk Management: Watch for fakeouts within the $95K–$100K range due to past volatility.
Bitcoin Ready to Dump Again till $85000?CRYPTOCAP:BTC just tapped a key Short POI near resistance!
Bears stepping in hard below $99,550 — this is prime sniper zone.
▶️ Trade Setup (SMC x ICT):
▶️ Entry: $93,800–94,200
▶️ Targets: $90,000 → $86,000
▶️ Stop Loss: $99,600 (above structure)
Liquidity swept ✅
FVGs below ✅
Momentum shifting ✅

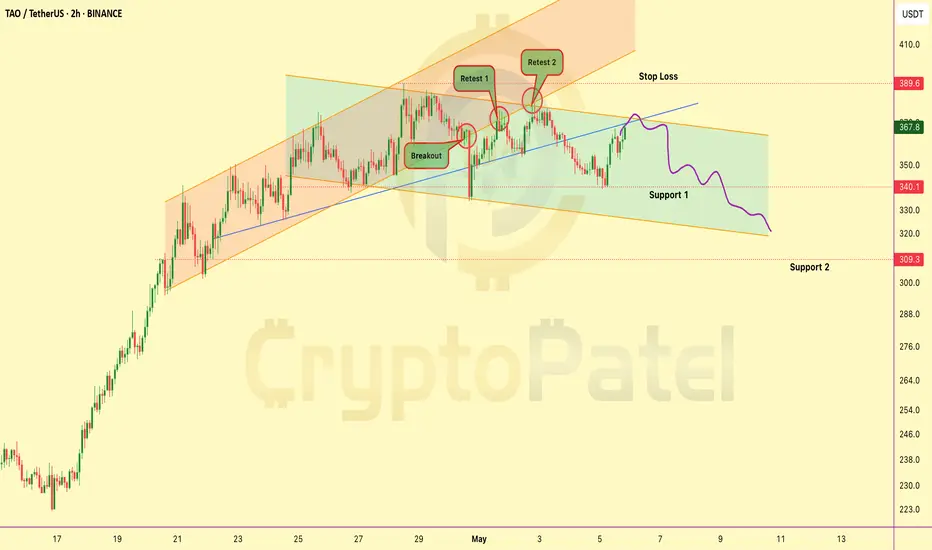
TAO/USDT Short Trade setup with Minimum Risk ZoneGETTEX:TAO looks like it's testing strong resistance at $369-$375. I'm planning to short at this level with targets at $340 and $310.
Risk management: Stop loss set at $389 for a safe exit if the price moves against the trade.
Technical setup shows a potential down move from this resistance zone. Watching for a drop to $240/$310 in the coming days. Stay cautious and trade safely!
$VRA: Holding Above $0.0025 Could Lead to 40x Gains!NASDAQ:VRA Targeting ATH Again – Potential for Huge Gains from Current Levels!
Weekly candle breaking major resistance at $0.0025. If price holds above this level, expect a strong upward move.
Potential Target: 40x from resistance if it hits the previous ATH!
Best Accumulation: FVG: $0.002183 - $0.001639
Perfect entry if price retraces to this level!
#Verasity #Altcoins
VLong

LITECOIN $500 Potential In Current Bull: Detail AnalysisLITECOIN MACRO BREAKOUT – NEXT LEG INCOMING?
NYSE:LTC confirmed a breakout above its multi-year resistance line after holding the Best Accumulation Zone for months!
🔸 Support Held: ~$65
🔸 Accumulation Zone: ~$85-$65
🔸 Short-Term Target: $255/$500
🔸 Long-Term Target: $1000/$1458+
Same pattern. Same zone. Same breakout.
🔥 I’m super bullish on #Litecoin.
Yes, it has tested our patience… but one strong day in this bull market and it could smash $500.
Let’s not forget — our initial entry was around $50, and it’s still a great range to accumulate.
While $1000–$1500 may not happen this bull run, I personally believe it’s possible in the near future.
⚠️ Of course, this is not financial advice — just my personal view. Always DYOR before investing in any coin.

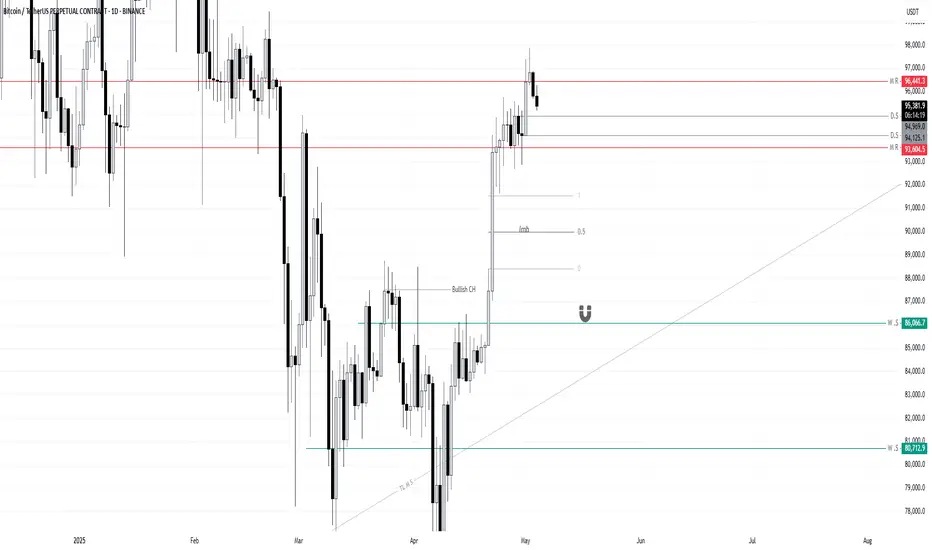
Bitcoin OutLook for Next Week BTCUSDT.pMarket Outlook (BTC/USD):
I’m currently observing the ₹94,125 level on the daily timeframe. A daily candle close below this level would significantly increase the probability of Bitcoin retracing toward the imbalance zone around ₹90,000.
However, there is a key demand zone near ₹86,000, which could act as a strong support and potentially push the market back upward. This area will be crucial in determining whether the bearish momentum continues or a reversal is triggered.
Let’s see how the market reacts around the ₹94,125 level. I’ll post the next update after Monday’s daily candle closes.
Thank you for your continued support — it's truly appreciated.
Will Ethereum hit $12000 in current Bull Market?CRYPTOCAP:ETH just confirmed a monthly hammer close — strongest bullish signal of 2025 so far.
Last similar structure led to a +60% rally.
Price action + volume = Strong reversal setup.
Bias: Long | Accumulation Phase Activated 🚀
Note: NFA & DYOR

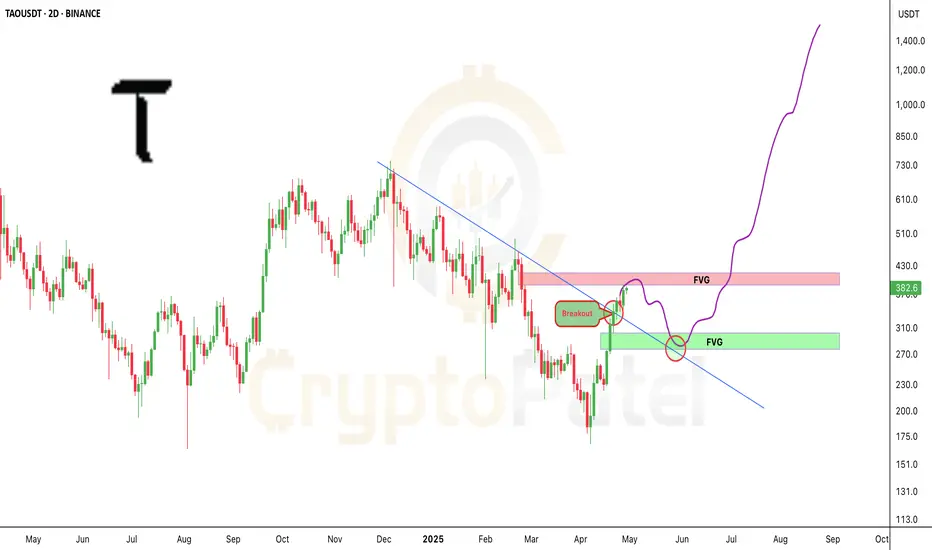
$TAO/USDT – Breakout Alert & Bullish Setup$TAO/USDT – Breakout Alert & Bullish Setup
TAO has officially broken above the long-term descending trendline, signaling a strong structural shift!
Key Highlights:
▶️ Breakout confirmed near $350
▶️ Price Near to tapped the FVG resistance zone ($400–$430)
▶️ A potential pullback toward the green FVG demand zone ($270–$310) could offer a Golden entry
▶️ If TAO holds the FVG support and shows strength, we could see a massive rally towards $850+ in the coming weeks.
🟢 Bias remains bullish above $310
🛑 Risk management is key — wait for confirmation before entries
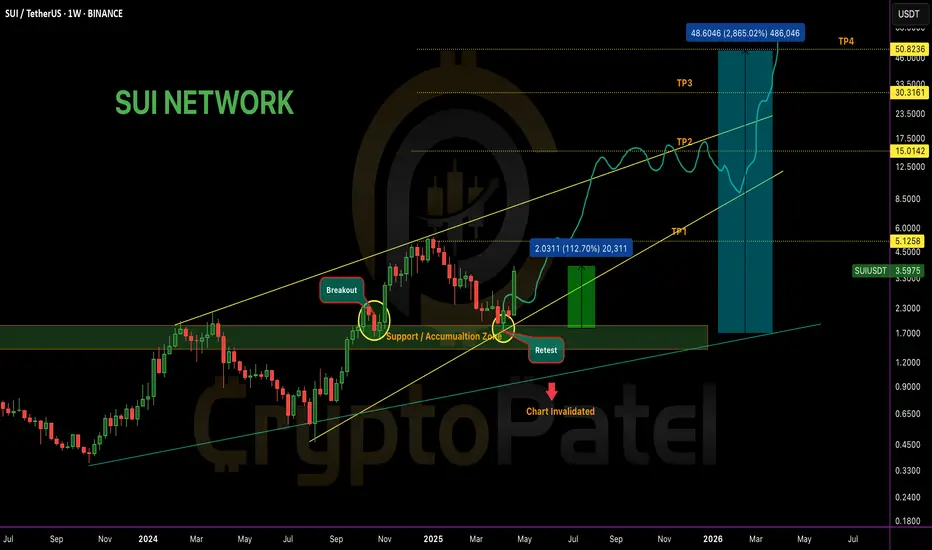
Will SUI hit $50 in Comming Years?SUI NETWORK MEGA BREAKOUT ALERT! 🚀
🟢 Chart Analysis Update:
• Breakout confirmed from the long-term accumulation zone.
• Retest successful — price bounced perfectly from the previous support zone.
• Current price: $3.59 (up +112% From our recent bottom price Entry)
• Next major targets:
🎯 TP1: $5.12
🎯 TP2: $15.01
🎯 TP3: $30.31
🎯 TP4: $50.82
Potential upside: 2,865%+ if the full move plays out!
🔔 Key Points:
Strong support holding at $2.00 zone.
Chart remains valid as long as price stays above accumulation zone.
Invalidation only if SUI breaks below $1.80 zone.
If momentum continues, SUI could enter a parabolic run in the coming months. Eyes on this rocket! 🚀
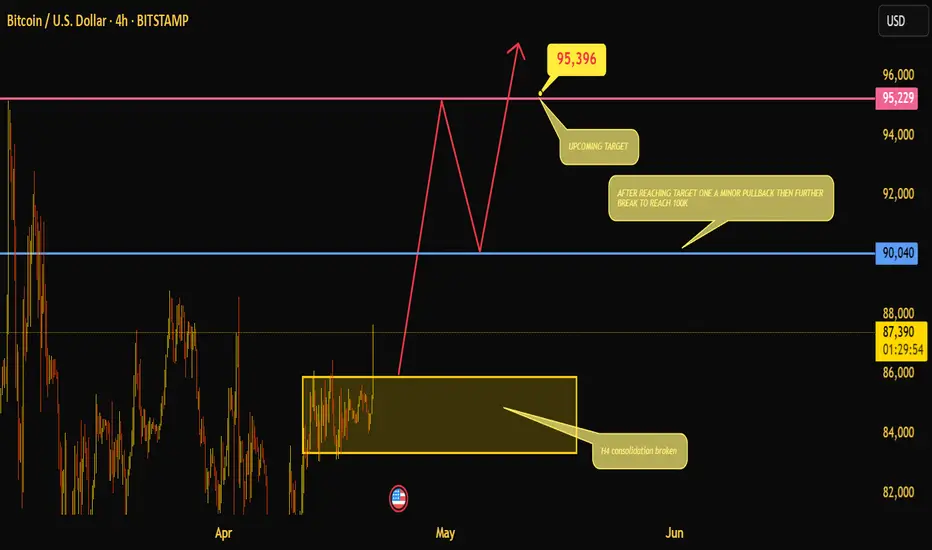
Bitcoin Breaks Out: Eyes Set on $95K, Path Open to $100KBitcoin has broken out of a well-defined H4 consolidation zone, signaling the end of a multi-week range and the beginning of a potential impulsive move. The breakout above the 87,000 region hints at bullish momentum building up, targeting the next key resistance around 95,396, which aligns closely with the marked horizontal resistance at 95,229. This level serves as the immediate upside target. If price hits this zone, a minor pullback could be expected before attempting a further leg up — possibly heading towards the psychological milestone of 100K. The level at 90,040 will act as an intermediate support, and holding above it could provide the foundation for this extended rally. Price structure suggests a rally–pullback–continuation setup, ideal for both breakout traders and swing players.
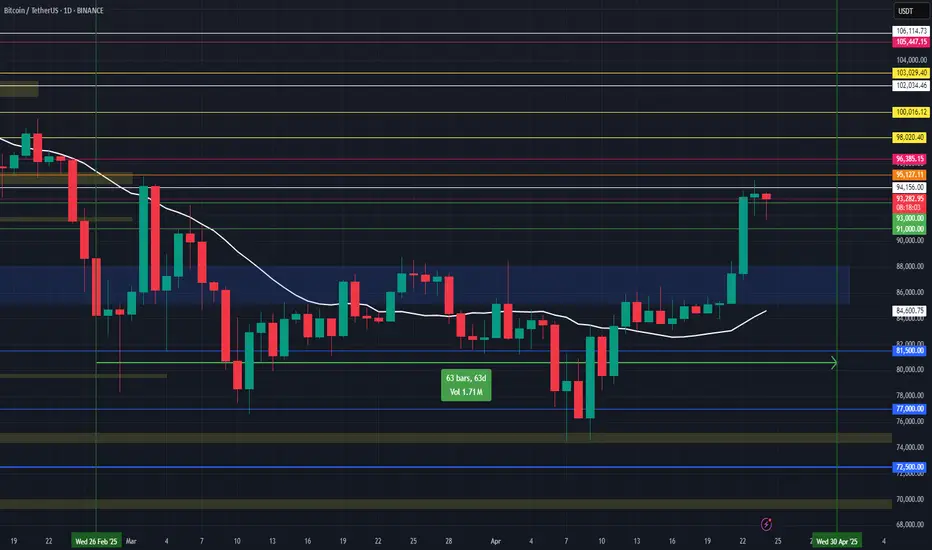
Bitcoin Breaks $88K — Eyes on Key Resistance ZoneSurging Momentum:
In the past few hours, Bitcoin has surged by 10%, breaking through the $88,000 resistance and reaching around $94,000. This marks a powerful continuation of bullish momentum.
Key Resistance Ahead:
The $92,000–$95,500 zone, which acted as strong support between November and February, is now expected to serve as major resistance. A rejection from this range could lead to a short-term retracement.
Retracement Zones:
If Bitcoin fails to break through $95,500:
First support: $91,000
Deeper pullback: $85,000–$87,500
Breakout Scenario:
If Bitcoin decisively breaks and holds above $95,500 on higher timeframes, we could see a continuation toward the next resistance between $102,000 and $108,000.
Conclusion:
Bitcoin is at a key inflection point. Whether it confirms a breakout or sees a short-term correction, this range will be crucial in shaping the next phase of the bull cycle. 📈🔥
#Bitcoin #BTC #Crypto #TechnicalAnalysis #Breakout #Resistance #Support #MarketUpdate #BullRun
Real Success Rates of the Falling Wedge in TradingReal Success Rates of the Falling Wedge in Trading
The falling wedge is a chart pattern highly valued by traders for its potential for bullish reversals after a bearish or consolidation phase. Its effectiveness has been extensively studied and documented by various technical analysts and leading authors.
Key Statistics
Bullish Exit: In 82% of cases, the exit from the falling wedge is upward, making it one of the most reliable patterns for anticipating a positive reversal.
Price Target Achieved: The pattern's theoretical target (calculated by plotting the height of the wedge at the breakout point) is achieved in approximately 63% to 88% of cases, depending on the source, demonstrating a high success rate for profit-taking.
Trend Reversal: In 55% to 68% of cases, the falling wedge acts as a reversal pattern, signaling the end of a downtrend and the beginning of a new bullish phase.
Pullback: After the breakout, a pullback (return to the resistance line) occurs in approximately 53% to 56% of cases, which can provide a second entry opportunity but tends to reduce the pattern's overall performance.
False Breakouts: False exits represent between 10% and 27% of cases. However, a false bullish breakout only results in a true bearish breakout in 3% of cases, making the bullish signal particularly robust.
Performance and Context
Bull Market: The pattern performs particularly well when it appears during a corrective phase of an uptrend, with a profit target reached in 70% of cases within three months.
Gain Potential: The maximum gain potential can reach 32% in half of cases during a bullish breakout, according to statistical studies on equity markets.
Formation Time: The wider the wedge and the steeper the trend lines, the faster and more violent the post-breakout upward movement will be.
Comparative Summary of Success Rates:
Criteria Rate ..........................................Observed Frequency
Bullish Exit ........................................................82%
Price Target Achieved ........................................63% to 88%
Reversal Pattern ..............................................55% to 68%
Pullback After Breakout .....................................53% to 56%
False Breakouts (False Exits) ...............................10% to 27%
Bullish False Breakouts Leading to a Downside ..............3%
Points of Attention
The falling wedge is a rare and difficult pattern to correctly identify, requiring at least five contact points to be valid.
Performance is best when the breakout occurs around 60% of the pattern's length and when volume increases at the time of the breakout.
Pullbacks, although frequent, tend to weaken the initial bullish momentum.
Conclusion
The falling wedge has a remarkable success rate, with more than 8 out of 10 cases resulting in a bullish exit and a price target being reached in the majority of cases. However, it remains essential to validate the pattern with other technical signals (volume, momentum) and to remain vigilant against false breakouts, even if their rate is relatively low. When mastered, this pattern proves to be a valuable tool for traders looking for optimized entry points on bullish reversals.
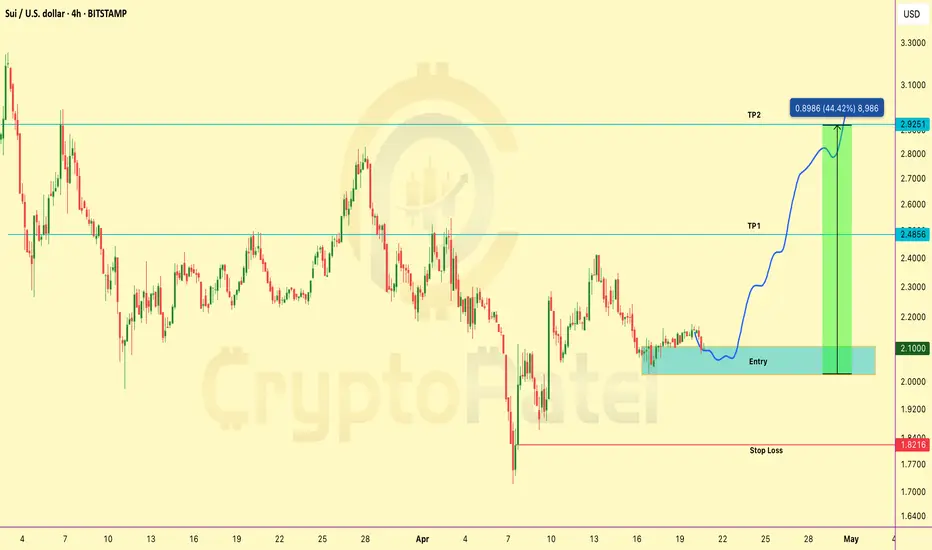
SUI/USDT Chart Analysis and Looking Long Setup for Good RRIf you're hunting clean setups with solid R:R — this CRYPTOCAP:SUI long looks 🔥
▶️ Entry: $2.10–$2.00
▶️ Targets: $2.48 / $2.92
▶️ SL: $1.82
Perfect for risk-managed apes. Don’t sleep on it.
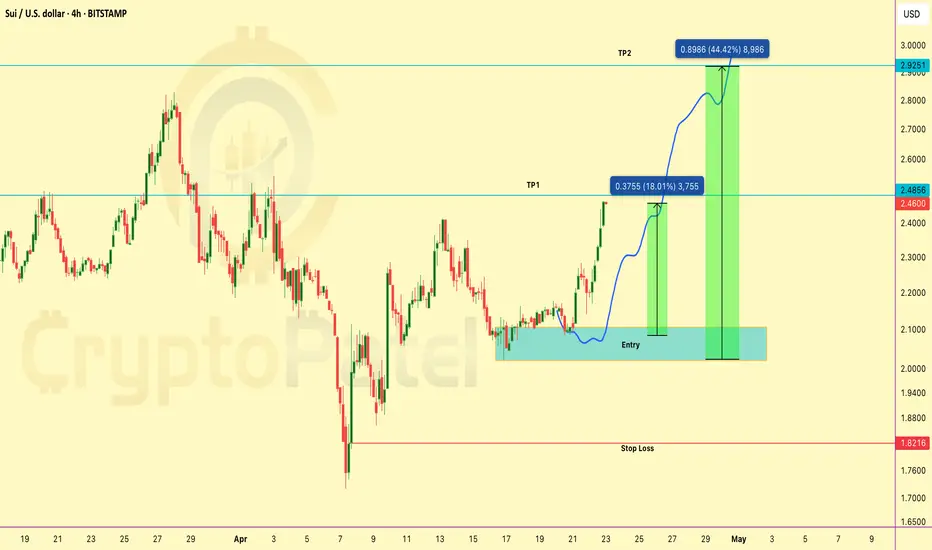
SUI/USDT Now 18% up in Spot from our Entry LevelCRYPTOCAP:SUI just hit +18% on spot and a massive +176% on 10x leverage from our shared trade setup! 🚀
➡️ Entry: $2.08
➡️ Current: $2.4660
Solid breakout play — hope you all caught the move!
Feel free to lock in profits anytime here for a safe exit. ✅
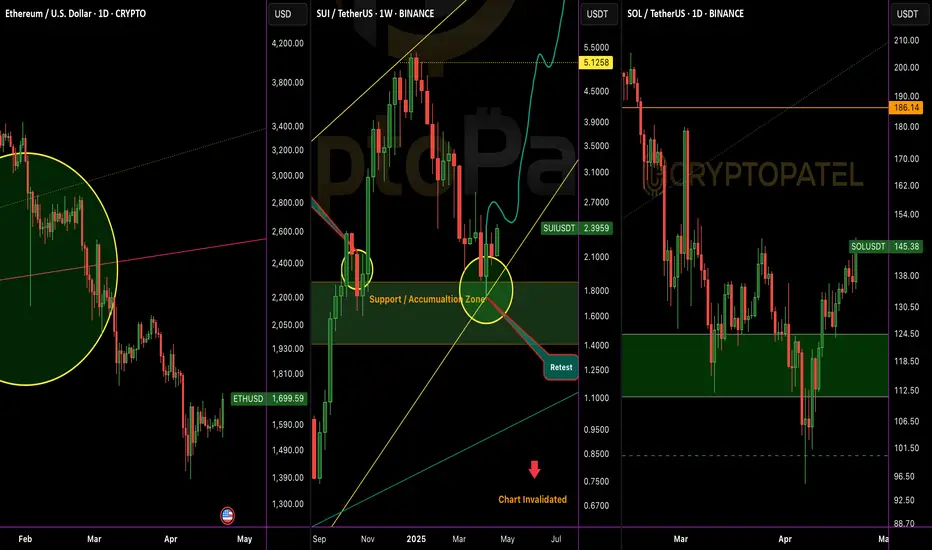
Bitcoin And Altcoins Price Difference🚨 2 months ago, #Bitcoin hit $90K and alts were flying:
CRYPTOCAP:ETH – $2,850
CRYPTOCAP:SUI – $3.50
CRYPTOCAP:SOL – $180
Today, BTC is BACK above $90K… but alts are in the dip!
CRYPTOCAP:ETH – $1,700
CRYPTOCAP:SUI – $2.40
CRYPTOCAP:SOL – $145
Never Forget to Buy at F*** Dip you Planning for Long Run
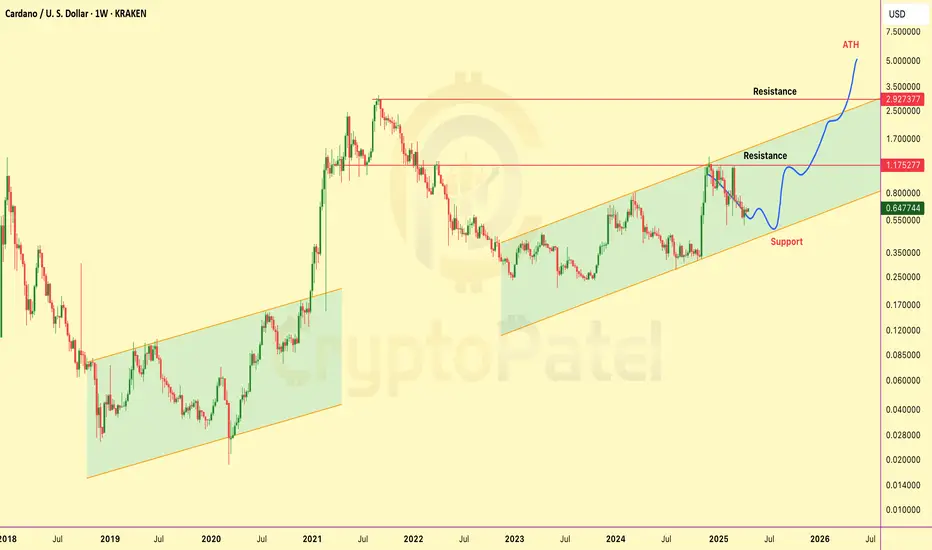
Will ADA hit $5 in bull Market ?CRYPTOCAP:ADA isn’t dead — it’s Loading For $5
The Setup is Clean:
✅ Support at $0.45
✅ Accumulation between $0.65–$0.45
🎯 Targets: $2, $4, $6
Patience here could print fortunes.
Will Bitcoin Hit $1 Million in Future?Everyone’s Scared of #Bitcoin Red Candles... I see Opportunity.
1⃣ This ain’t just a dip — it’s a Discounted future begging to be Grabbed.
2⃣ My Chart will Age like fine wine 🍷
3⃣ Buy fear. Stack smart.
4⃣ In a few years, You'll wish you did.
Let the smart money eat. 🚀
NFA & DYOR

Is ChainGPT 1800% Potentila in Altseason ?🚨 CGPT/USDT Technical Outlook 🚨
ChainGPT just completed a liquidity grab from the bottom of its accumulation zone — and things are heating up!
🔍 Key Highlights:
✅ Strong bounce from the green accumulation zone
✅ Previous structure broken (BOS & CHoCH spotted)
✅ Possible rally projection toward $1.00, if bullish momentum holds
⚠️ Immediate resistance lies between $0.110
The last time CGPT touched this zone, it skyrocketed 1,481% — and this time the setup looks even stronger.
Patience here could reward the smart money.
Keep your eyes on the breakout levels and retest zones.
👉 Not financial advice. DYOR.

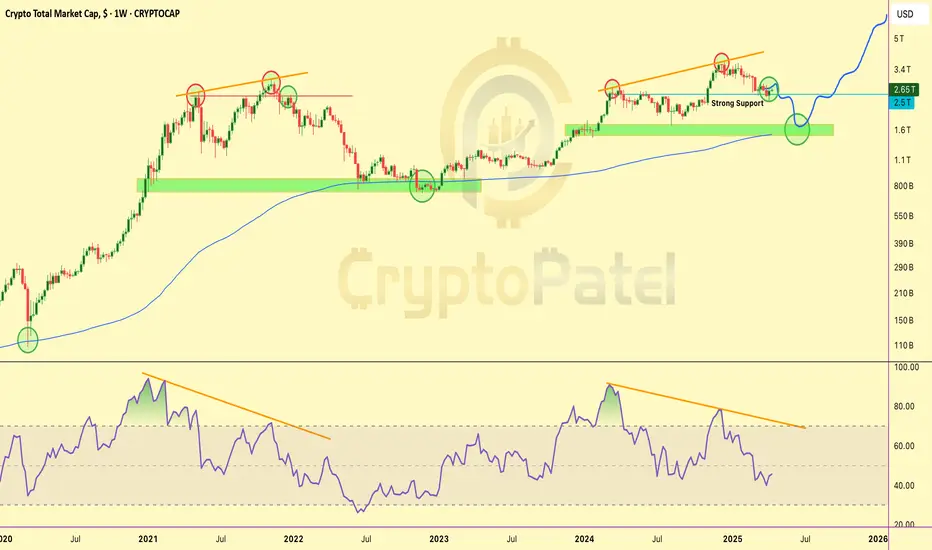
Very Important Market Fractal Alert – Be Prepared for All ScenarVery Important Market Fractal Alert – Be Prepared for All Scenarios
Trust me, I don’t like this setup either…
But if this historical fractal plays out again, we could be looking at a potential $1 Trillion drop in total crypto market cap — a serious correction.
Key Level to Watch:
Total Market Cap must hold the $2.50T support zone.
If this level sustains, we remain structurally bullish — no major worries.
⚠️ However, if $2.50T breaks down with volume, the market could enter a deeper correction phase.
It’s not FUD — it’s just preparation.
This chart is not a prediction, it’s a pattern to be aware of.
Hope it fails — and price breaks upward instead.
✅ Stay alert.
✅ Manage risk.
✅ Always plan for both sides of the market.
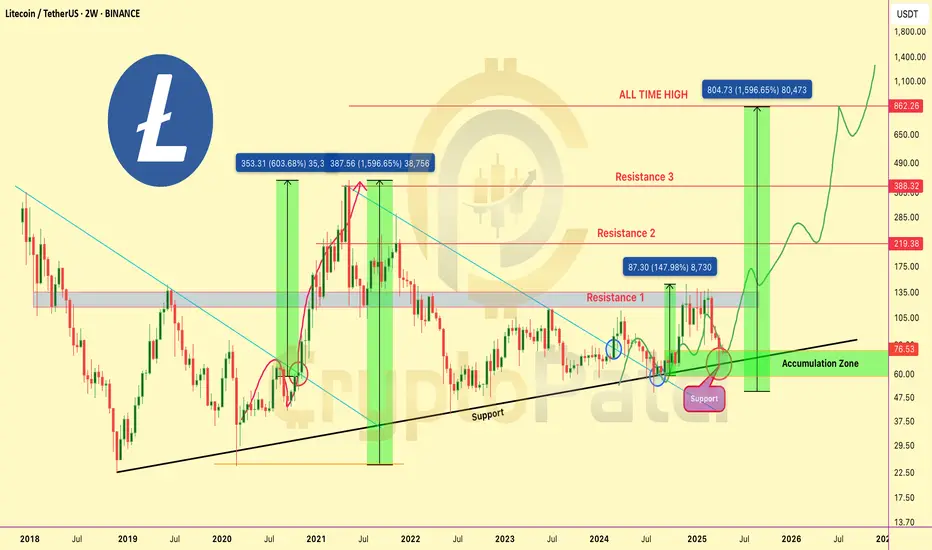
Last time Litecoin was here, it went up 10x. Can it do it again?🚨 Last time Litecoin was here, it went up 10x. Can it do it again?
CRYPTOCAP:LTC is back in its accumulation zone ($60–$80) — the same area where it kicked off a 600%+ rally in 2020 and a 1,500%+ move in 2021!
Every time Litecoin touches this zone, it doesn't just bounce… it rockets 🚀
Right now, it's holding the long-term uptrend support line, showing signs of strength. If we break above the $105–$135 resistance, the next targets are:
👉 Mid-term: $219
👉 Long-term: $388 — and possibly even the $862 ATH 👀
With the structure this clean and history on our side, this could be one of the best R/R setups in the market right now.
Accumulation phase doesn't last forever. Eyes on LTC 👇
🟩 Buy Zone: $60–$80
🟥 Stop-loss: Below $58
💎 Targets: $135 → $219 → $388+
Patience might just pay off big this cycle 💎
BTC: Quiet... but Ready to Explode?Bitcoin’s sideways grind has tested everyone’s patience — but don’t let the silence fool you. Tight consolidation like this often leads to powerful breakouts. And right now, BTC looks like it’s charging up.
📊 Technical Outlook:
BTC is sitting on strong support at 81K–83K, a level that’s sparked multiple rebounds before.
Price action has broken out of the downtrend channel and is now forming a classic accumulation box — textbook setup for an upside move.
EMAs (34 & 89) are tightening, signaling incoming volatility.
Breakout above resistance could open the door to 94K, a key untested zone.
🌐 Macro & Sentiment:
Big money is on standby after the recent crypto shakeout.
Spot Bitcoin ETFs are seeing renewed inflows after weeks of outflows.
With global interest rates cooling off, risk-on assets like BTC are back on the radar.
Trade Plan to Consider:
Look for long setups around 81K–83K support if strong bullish candles confirm
🎯 Targets: 87K → 94K
❌ Stop loss below 79K to protect your position
The breakout may not be loud — but it’s coming. The only question is… will you catch it?

Bitcoin Dominance Just Hit a 1,505-Day High — Are You Paying Att🚨 Bitcoin dominance has been climbing non-stop for 959 days... and it just broke a 1,505-day high, hitting 64.34%.
That’s not just a stat — that’s a clear signal.
Bitcoin is still the king. 👑
Rejection Level: 66%-72%
Be honest… do you own any?
