SEI/USDT 20x Potential from Accumulation ZoneNYSE:SEI Accumulation Zone – High Potential Trade
🔹 -76% from recent high, making it a prime accumulation zone.
🔹 My Accumulation Zone: $0.20 – $0.15
🔹 Upside Potential: Chart indicates an easy move to $0.50—if it breaks, expect a major rally!
🔹 Long-Term Targets: $1/$3/$5/$10
🔹 Catalyst Alert: Even #TRUMP is accumulating #SEI adding strong bullish momentum!
Strategy: Accumulate on dips, take profits strategically, and hold a portion for long-term gains.
#Altcoins #NFA
Bitcoin (Cryptocurrency)

Bitcoin (BTCUSD) Rejection – Bearish Move Incoming?📉 Key Observations:
Resistance Zone (Purple Box): Price has tested this area and faced rejection.
Bearish Projection (Gray Box & Arrow): The chart anticipates a drop towards the $76,800 - $77,000 range.
Liquidity Grab? Price might consolidate before a sharp decline.
⚠️ Possible Scenarios:
Rejection Confirmation 🔻: If BTC fails to reclaim $84,470, selling pressure could increase.
Breakout Fakeout? 🤔: A deviation above resistance followed by a dump remains a risk.
🎯 Levels to Watch:
Resistance: $84,470 - $85,078
Support: $80,000 and $76,825
🔥 Final Take: If BTC struggles below resistance, a short setup could play out. Confirmation is key!

#Ethereum Wyckoff Re-Accumulation#Ethereum Wyckoff Re-Accumulation
If this level holds, it could be the ideal accumulation zone for long-term investments.
CRYPTOCAP:ETH

Polkadot (DOT) at Critical Support – What’s Next?Polkadot (DOT) at Critical Support – What’s Next?
📉 DOT is trading near strong support at $3.80–$3.60. If this level holds, we could see an upward move.
⚠️ Risk of liquidity grab: Price may dip below support to liquidate high-leverage positions before bouncing.
💡 Buy Strategy: Consider small entries now and place buy orders between $2.50–$2.00 for long-term gains.
📈 Altseason Target: If DOT follows the market uptrend, it could reach $40–$50 in the next cycle.
🔎 Key Levels:
✅ Above $3.60 – Bullish move likely
❌ Below $3.60 – Possible stop hunts before reversal
Are you buying DOT at these levels? Let’s discuss! 👇
#Polkadot #DOT #Crypto

#TRON to $1? Highly Possible! But Gold Entry is Key #TRON to $1? Highly Possible! But Gold Entry is Key 🚀
📉 Best Accumulation Zone for CRYPTOCAP:TRX : $0.140 - $0.10
🏆 Patience & Strategy Win the Game!
NFA. DYOR!
CRYPTOCAP:TRX #Altcoins

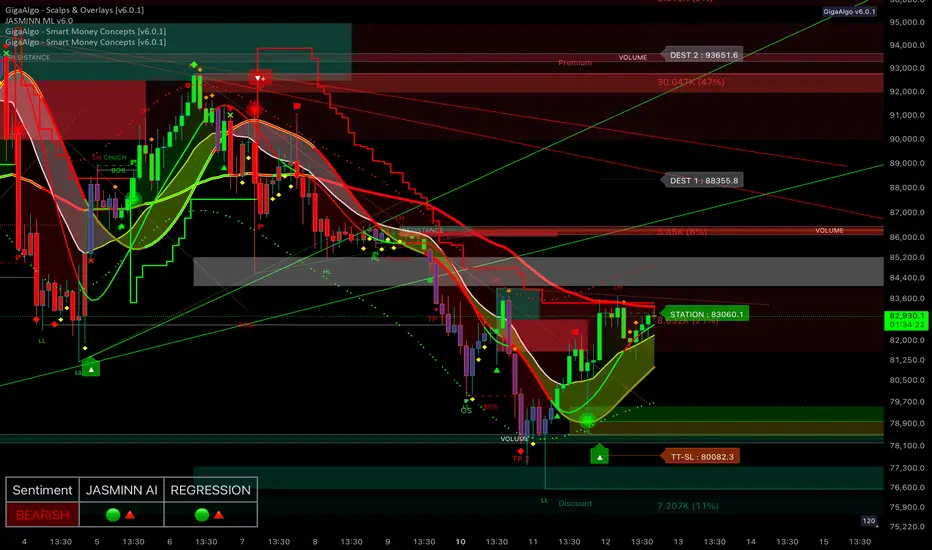
Bitcoin (BTC/USDT) 2-Hour Chart Analysis
Bitcoin is showing signs of recovery on the 2-hour chart after forming a local bottom at a key support zone. The price has bounced from a strong demand area, supported by increased buyer activity, and is currently attempting to push higher within a rising channel. The formation of higher lows (HL) and higher highs (HH) suggests that bullish momentum is building in the short term.
Despite this upward movement, the overall trend remains bearish, indicated by the dominance of red moving averages and the presence of strong resistance overhead. A major resistance zone sits above the current price level, marked by significant volume and selling pressure. The sentiment remains bearish, as confirmed by the red signal on the sentiment panel, although JASMINN AI and regression tools are showing early signs of potential upward strength.
If the price manages to break above the resistance zone and hold, the next upside target lies near the destination levels identified on the chart. However, failure to maintain upward momentum could result in a pullback toward the previous support zone, where buyers are likely to step in again. The key to further upside will be a decisive break and close above the resistance, supported by rising volume and bullish momentum. The overall market outlook remains cautiously bullish in the short term but within a larger bearish trend.
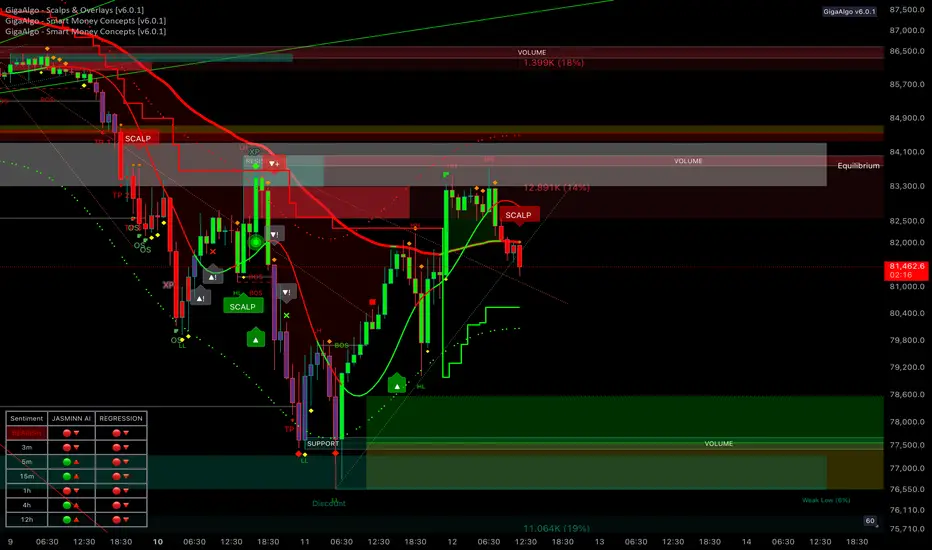
Bitcoin (BTC/USDT) 1-Hour Chart Analysis
Bitcoin is showing signs of bearish pressure on the 1-hour chart after a recent rejection from a key resistance zone. The market structure reflects a mixed trend, with signs of higher and lower lows indicating ongoing volatility. A recent break of structure and expansion suggest that the market is at a turning point.
There’s a clear resistance zone where sellers have stepped in, creating strong selling pressure. On the other hand, a support zone below shows signs of buyer interest, which could act as a floor if the price continues to decline. The equilibrium point near the middle of this range represents a potential decision area for future price movement.
Market sentiment remains bearish across multiple timeframes, reinforcing the downside bias. If the price continues to reject resistance, it could drop toward the support zone, with further downside possible if buyers fail to hold the level. Conversely, a breakout above resistance could signal renewed bullish momentum and lead to higher levels. The current outlook remains bearish, with selling pressure dominating near resistance and moderate buyer interest at support.
BTC/USD Breakdown! Bearish Target: $78K🔍 BTC/USD 30-Minute Chart Analysis
📉 Market Structure:
The chart displays an ABCDE corrective pattern, likely a descending wedge or contracting triangle, which has now broken to the downside.
Price action shows a breakout below the wedge, leading to further bearish momentum.
The 200-period moving average (red line) is acting as resistance, reinforcing the downward trend.
📊 Current Price: ~$83,057
🔻 Bearish Target: $78,049 (marked as the potential support level)
🛑 Key Observations:
Rejection from wave E indicates a lack of bullish strength.
Lower highs and lower lows confirm a continuation of the bearish trend.
Potential retest of ~$85,000 before dropping further.
🚀 Trading Insights:
Bearish Bias: Short opportunities on pullbacks toward resistance.
Bullish Reversal? Look for price action near $78,049—if buyers step in, a potential bounce could occur.
⚠️ Watch out for:
Sudden Bitcoin volatility (news-driven moves).
A fake breakdown (if buyers reclaim above ~$85,000).

Raoul Pal’s Investment Edge: The Art of Predicting Market ShiftHello Traders! First of all, no, this is not about me! 😆 I am Rahul Pal , and this is about Raoul Pal , the legendary macro investor! But don’t worry— my time will come too! Until then, let’s take this opportunity to learn from one of the best in the game and explore his key investment principles and strategies that have made him a market icon.
Raoul Pal is not just another investor—he is a master of macro trends who has successfully predicted major shifts in financial markets, global liquidity cycles, and the rise of digital assets. From his early bets on Bitcoin and Ethereum to his deep understanding of monetary policies and their impact on financial markets , his approach has helped thousands of traders and investors navigate volatile conditions and stay ahead of the curve.
So, let’s break down his top investing lessons and see how we can apply them to build wealth, manage risks, and seize big market opportunities!
Raoul Pal’s Key Investment Strategies
Macro Investing Approach – Pal focuses on big-picture economic trends, analyzing global debt cycles, interest rates, and monetary policies to predict major market movements.
Early Crypto Adoption – He was one of the early institutional investors to bet big on Bitcoin and Ethereum, predicting their rise as alternative financial systems.
Liquidity Matters More Than Fundamentals – Pal believes that liquidity in financial markets drives asset prices more than just company fundamentals.
Bet on Big Trends Early – He identified major shifts in technology, crypto, and decentralized finance (DeFi) before mainstream adoption.
Understanding Market Cycles – He studies boom-and-bust cycles to anticipate major economic shifts and position himself accordingly.
Diversification with a Focus on Asymmetry – Pal emphasizes investments with high potential upside and limited downside risks, such as Bitcoin and tech stocks.
Raoul Pal’s Bold Market Predictions
Bitcoin to Reach $1M? – Pal has predicted massive upside potential for Bitcoin, citing global money printing and institutional adoption.
The Rise of Digital Assets – He believes that crypto, NFTs, and tokenized assets will be a major part of the financial future.
US Dollar Liquidity Crisis – Pal has warned about potential economic instability caused by excessive debt and monetary easing.
What Traders Can Learn from Raoul Pal
Follow the Macro Trends – Pay attention to global interest rates, central bank policies, and economic cycles to position yourself ahead of big moves.
Be Open to New Asset Classes – Consider crypto, technology, and emerging financial innovations for long-term wealth creation.
Risk Management is Key – Even with bold predictions, Pal manages risk and focuses on asymmetrical returns.
Adopt a Long-Term Perspective – Major trends don’t happen overnight, so patience is crucial when investing in macro shifts.
Conclusion
Raoul Pal’s macro investing strategies provide valuable insights into navigating global markets, identifying emerging trends, and managing risk effectively. His focus on big-picture thinking has helped him stay ahead of market shifts, making him a legend in the world of investing.
Do you follow macro trends in your trading? Let me know in the comments! 👇

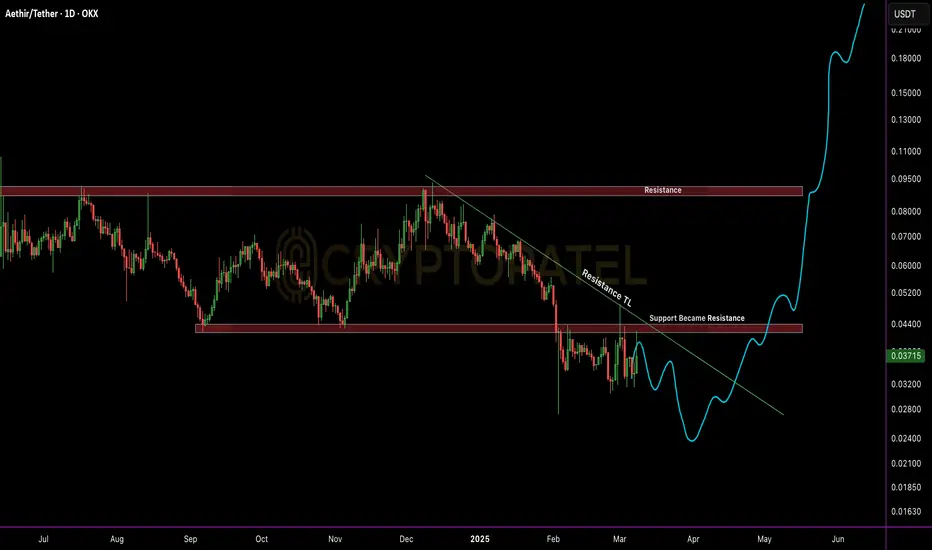
$ATH Technical Outlook: Accumulation Opportunity? TSX:ATH Technical Outlook: Accumulation Opportunity? 🚀
#ATH is trading at $0.037, below key resistance at $0.045 – bearish unless it breaks above. A breakout could push it to $0.09 and beyond.
🔹 Accumulation Zone: $0.037 – $0.020
🔹 Targets: $0.1 / $0.3 / $0.5 / $1
Solid project, good dip-buying opportunity. Watch key levels & manage risk!
Not Financial Advice – DYOR! 🚀
#aethir #Alts
BTC#20: BTC Analysis: Price SW In Triangle – Next Direction?💎 💎 💎As analyzed in the previous article, BINANCE:BTCUSDT gave a bad price reaction when touching the old resistance area of 95~96x. The current price is SW in the triangle. Let's analyze the next plan BINANCE:BTCUSD : 💎 💎 💎
1️⃣ **Fundamental analysis:**
📊President Donald Trump signed an executive order to establish a Strategic Cryptocurrency Reserve that includes 200,000 BTC seized in criminal or civil cases. It will be held as a reserve asset and not sold. In addition, the Government will not purchase additional assets for the reserve.
🚀The Treasury and Commerce Departments may consider budget-neutral Bitcoin purchases. Agencies must provide full accounting books of digital assets to the Ministry of Finance. Regulatory crackdowns on crypto assets are ended
📌 From the above information, it can be seen that BTC and the top 5 coins in the market have been officially recognized as an asset. The legal framework will take time to complete. However, BTC will receive more attention and attention when the US government makes any purchase moves to hoard. This will lead to a huge demand for BTC in the near future.
2️⃣ **Technical analysis:**
🔹 **D Frame**: The price structure is still bearish, we have had a recovery phase to retest the resistance area and give a bad price reaction. It is entirely possible that BTC will go down to the support zone below
🔹 **H4 Frame**: We can see the price reaction more clearly. The continuous reaction of lower peaks in this area shows that the market sentiment is still dominated by the bears even though BTC has been recognized as a reserve asset.
🔹 **H1 frame**: The price is still SW in the triangle area in recent days. The price range is gradually narrowing as shown on the chart
3️⃣ **Trading plan:*
⛔ At the present time, it is no longer suitable to wait for a BUY position. The price has tested the resistance area and reacted badly, so there is a high possibility that there will be a correction below the support area below at any time.
✅ The top priority is to trade in accordance with the main trend in the SELL direction. Although the information about the Reserve Fund has given a positive response, the government not buying more assets for the reserve is also a sign that short-term cash flow will be difficult to push into BTC, especially when tariff policies are giving negative reactions to the economy.
💪 **Wishing you success in achieving profits!**

Will Ethereum Fall below $1500 or Ready to $8000 ?#Ethereum Fresh Weekly Analysis
🔹 Current Trend: CRYPTOCAP:ETH has dropped -51% in the last 3 months, signaling a major retracement.
🔹 Key Support Zone: Trading above $2000-$1900, a crucial accumulation zone for this bull market.
🔹 Upside Targets: If #ETH holds this support, we could see $6000 / $8000 / $10,000 in the coming months.
🔹 Risk Factor: If ETH fails to hold $2000, expect a potential dip towards $1500—a key level for long-term accumulation.
Smart Strategy:
✅ Accumulate ETH on dips instead of chasing tops.
✅ Wealth is built by buying in bear markets and selling in bull cycles.
✅ Long-term holders should focus on accumulation, not panic selling.
IMO ETH/USDT has strong potential in this bull cycle—buy smart, hold strong!
Note: Not Financial Advice so DYOR

BTC - Support and Resistance as on 7th marchIn cart green and red lines indicating support and resistance. US President clearly said Do not Sell your Bitcoin. Even though he didnt mention how much will be purchased etc but we have a new Govt going to form a strategic reserve with spending tax money so it could be slow to see banana spikes but I think its going to be Bullish for BTC

BTCUSD: Trendline Support vs. Key Resistance - What's Next ?Previous Support Turned Resistance: The 91,000-93,000 range that previously acted as support has now flipped to resistance, confirming a classic price action principle.
Diagonal Trendline Support: Currently, price is respecting an upward diagonal trendline (marked by the red lines on the chart), providing short-term support.
Market Structure:
Bitcoin experienced a sharp drop from the 96,000 level in late February
Price found a bottom around the 80,000 mark before forming the current ascending trendline
Recent price action shows a series of higher lows along this trendline, suggesting potential bullish momentum building
Trading Outlook:
As long as price remains above the diagonal trendline support, we can expect a continued move higher
Immediate target would be a retest of the 91,000-93,000 resistance zone and if price sustain above this then more upisde possible.
A successful break above this resistance could signal a resumption of the larger bullish trend
However, a break below (Close on daily) the trendline support would invalidate this bullish scenario

$TRX hit our 200% target as predicted! 🚀 CRYPTOCAP:TRX hit our 200% target as predicted!
Tron is showing strong momentum, and I still believe $1 is possible this bull run!
📉 Best buy zone: $0.180 - $0.160 (if we get it).
Who’s holding TRX to $1?
RT & Like if you’re bullish! 🔄

BTC - 5th march - chart pattern target 94400As per the chart pattern we can see short term target as 94400 and in 2 days we have US Crypto summit. I think mostly it will move up rather than fall. By now it must have fallen and its not happening so that's why i think price is willing to move up now
BTC - Buy again for Target of 98-100KThis correction is excellent re test of support of Support and once again expecting bounce for target of 98 or 100K. RSI is over sold at the breakout level indicating a good buy level. having 7th march - Bitcoin summit as double support I only expect price to rise again ....

Bitcoin Fresh Technical Analysis and Price Prediction AnalysisBTC/USDT – Technical Analysis Update
📊 Current Price: ~$93,000
📈 Recent Move: Strong bounce from $79,000, surging $17,000 in just a few hours.
Key Technical Levels & Market Structure
🔸 Resistance Zone: $95,000 – This level acts as a critical supply zone. A strong rejection here may trigger short-term corrections.
🔸 Breakout Confirmation (BOS - Break of Structure): A decisive close above $99,600 with volume could confirm bullish continuation towards new highs.
🔸 Support & Downside Risk:
If BTC fails to hold above $95,000, a pullback towards $75,000-$70,000 remains a possibility.
EMAs & Trendline Support: Watch for dynamic support from 50 EMA & ascending trendline in case of retracement.
Market Outlook:
- BTC remains in a bullish structure, but volatility is high.
- RSI & Volume Analysis: Overbought conditions on lower timeframes suggest possible consolidation before the next leg up.
⚠️ Risk Management: Always trade with stop-loss and avoid overleveraging in this volatile market.
📡 Stay tuned for real-time insights!
Note: NFA & DYOR

BTC#19: “Cryptocurrency Reserves” and trading plants💎 💎 💎 After Trump posted about his plan to put BTC into the national cryptocurrency reserve, BINANCE:BTCUSDT BINANCE:BTCUSD had a meteoric rise back to 93~95x. Let's plan to trade BTC: 💎 💎 💎
1️⃣ **Fundamental Analysis:**
📊 The current market is dominated by “US crypto assets”.
🚀 Trump: Will put BTC into the national reserve, this will help the crypto sector break out. However, it is also important to note that the US lacks budget support and crypto reserves are just empty words at present.
📌 The probability of the Fed keeping interest rates unchanged in March is 93%.
It can be seen that the current cash flow injected into the market is not really significant because interest rates have not yet decreased and the US tariff policy is still waiting to cause an economic war. Current news plays a role in restraining the downward momentum and fear in the recent past.
2️⃣ **Technical analysis:**
🔹 **Frame D**: it can be seen that the price is looking for an important resistance area. Note that the current price structure is decreasing, so the price can still turn around at any time when it touches the diagonal resistance zone.
🔹 **Frame H4**: It is clear that yesterday's increase has not yet had any technical recovery to be able to break through the current resistance zone.
🔹 **Frame H1**: Temporarily, the price is still in an upward trend influenced by yesterday's positive news. The previously broken trendline will act as an important support for the price to break out in the near future
3️⃣ **Trading plan:*
⛔ The current area is no longer ideal for establishing a trading position, if the price still has no recovery, we can consider looking for a SELL position when the price reaches the diagonal resistance area when a price structure appears on a smaller time frame. BUY should only be made if the price recovers and accumulates in the old resistance area and an increasing price structure appears on a smaller time frame.
✅ On the D and H4 time frames, the price structure is still bearish, besides, H1 has increased strongly without any technical recovery due to the influence of positive news. So we can completely wait for a trading opportunity when the price finds an important resistance and support zone.
💪 **Wishing you success in achieving profits!**

SOLANA DOWN 57% FROM ATH! 🚨 SOLANA DOWN 57% FROM ATH!
People are panicking! But is this just a dip before CRYPTOCAP:SOL pumps to $500? 🤯
Smart investors buy dips, not fear! 🚀
What do you think? Buy or sell? Comment below! 👇💬

GREAT BUYING OPPORTUNITY IN BITCOIN. BREAKDOWN OF THE SETUPGREAT BUYING OPPORTUNITY IN BITCOIN. BREAKDOWN OF THE SETUP
In daily time frame btc has taken support from the important level of 61.8 fibonacci level. And it has taken support of 200dma also.
In 15 minutes time frame BTW Has formed head and shoulder pattern also which is showing the target of 91000. So this is a good buying opportunity in bitcoin

Bitcoin Ready for $69000 ?#Bitcoin followed my chart PERFECTLY! 🚀🎯
I warned you, but some laughed. Who’s laughing now? 😏
From $108K to $79K—NEXT STOP: $75K-$70K (prime accumulation zone!) 🔥
Who’s buying this dip? 🤔👇

Now It's Time to Pump the bitcoin.Bitcoin exactly touch the lower trendline and pumping back. It might pump back from this and very soon touch back 1,00,000 dollar milestone.
