Reversal Pattern, Inverse Head Shoulders | Long BiasOn 4H TF
ATOM is retesting #SupportZone on day chart
Seem ATOM's creating #ReversalPattern that's Inverse Head Shoulders
$9.7 is the important level
Can wait to break and close above this level to join next bullish
Time will tell
Bitcoin (Cryptocurrency)

Right on Bullish Fair Value Gap | Long BiasPrevious post on day timeframe
This post on 4H TF
First, BINANCE:NEARUSDT is right on Bullish Fair Value Gap and Horizontal Support
So I think this is good zone to buy NEAR for next bullish
I see two chance to buy that
1. More risk: buy now and stoploss below $2.03
2. Safer: Wait for breakout and retest $3 then can join
Wait for next move and DYOR before you trade. This post is not advice for anyone.

PEPE/USDT 430% up from our Entry zoneGETTEX:PEPE Pumping Hard
1️⃣ PEPE hit New ATH $0.00000578
2️⃣ #PEPE
Pumped 860% in Just 4 months
3️⃣ PepeCoin Dumped -86% before 860% up Ride
4️⃣ I suggest now Stay away from Fresh Entries in Pepe at Peak Price Levels
5️⃣ 430% Up from Our Entry Levels
Never forget to book profit.
NFA

FET/USDT did 270% Profit within few daysNYSE:FET - Super Bullish Monthly View
1⃣ #Fetch Did 270% Profit from our Entry ✅
2⃣ Monthly Closed Above $0.7 = ✅
3⃣ $9-$10 Price Target in Bull Run
4⃣ AI narrative driving strength
5⃣ Clean market structure
6⃣ #FET = $0.8-$1 will be the best Entries
Congrats on the huge Profit.

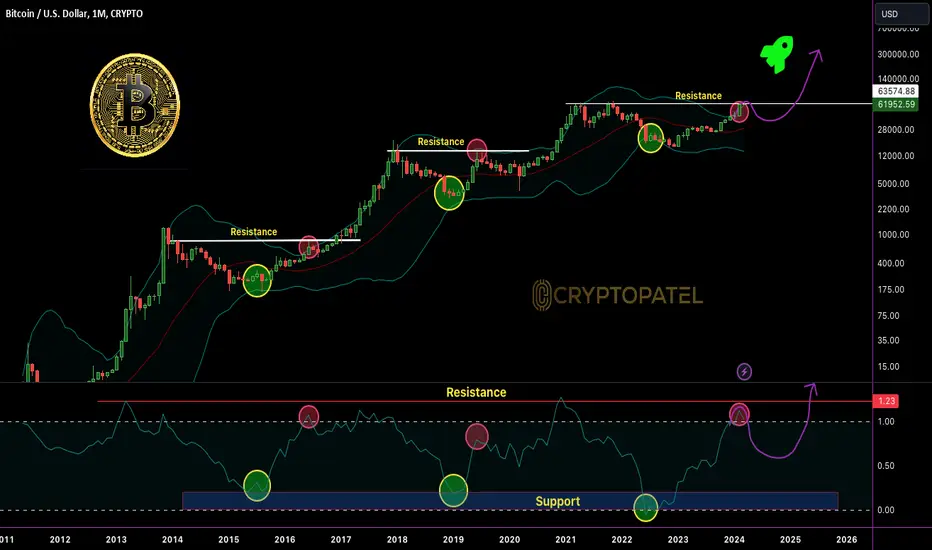
BITCOIN READY TO FLY ?The #BITCOIN party is just getting started
Bollinger bands are still tight - massive expansion ahead.
This bull run is in the early innings.
HODL on, the best is yet to come!
NFA
PEPECOIN Did 400% From our EntryGETTEX:PEPE 400% Profit within 20 days
1⃣ #PEPE Pumped hard after breakout $0.0000011 Level
2⃣ Currently 400% Up from our Entry Levels
3⃣ Previous ATH Broken and Now trading at New ATH
4⃣ Never Forget to Book Profit Because Now our Position in huge Profit
Hope you Enjoyed

Take a chance in correction phase | Long BiasOn week chart
After ADA has broken out the resistance zone at $0.46 and now it's pulling back to support zone around 0.45 - 0.43
Wait for confirmation around this level to join

From good to best Entry for next bullish | Long BiasOn Week Chart
The best entry around 0.5 - 0.8 of Fair Value Gap
On 4H TF
LINK has support zones at 18.2 lower 17.5
These levels are good entry for next bullish, if it's broken down LINK can bounce back from Fair Value Gap 16.9 - 16.2
Time will tell

BTC Bitcoin Sell-Off and COIN Coinbase potential HackIf you haven`t bought BTC before the rally:
Then you need to know that today Coinbase's trading engine experienced a disruption during ETF trading hours, causing a significant impact on individuals actively trading Bitcoin on the platform and leading to a substantial drop in its price.
The aftermath of the incident saw the price recovery after ETFs purchased actual Bitcoin for the next trading day (T+1). However, questions arose regarding the cause of the price decline. While Coinbase's outage played a role, suspicions arose about other exchanges possibly exerting considerable selling pressure. The speculation was whether Coinbase was the main stabilizing force and if there were other irregularities in play.
Concerns escalated, leading to speculation about a potential Hack on Coinbase.
Users reported missing assets, and both phone and chat support were inaccessible during a critical market moment.
The situation highlighted the vulnerability of relying on centralized exchanges, emphasizing the importance of having control over one's private keys to ensure ownership and security of crypto assets.
The overall consequence was a market downturn, signaling a potential local top.
My Price Target for Bitcoin is $51K.

MOVR/USDT Ready for $100 ?Will SEED_DONKEYDAN_MARKET_CAP:MOVR break its ATH $440 Level Again?
1⃣ #MOVR did 11x from in last 4 months
2⃣ Before Pump MOVR Also dumped 99% of the last ATH
3⃣ Down From $440 to $3.5
4⃣ 40% down After My analysis hope you entered at our entry zone.
5⃣ Now I am expecting $100-$200 in the bull run if hold $20 Support.
NFA

Bitcoin Price action.Bitcoin is form double bottom with support 42042. As per chart trend, It may test 54054 soon.


Chance to join | Long BiasOn day chart
CFX is pulling back to Imbalance
I think this chance is join next recovery to Swing High
Wait for rejection around $0.19

CGPT/USDT Currently 200% up from our EntryCGPT/USDT 10x GEM Analysis:
#ChainGPT is currently trading at $0.37 and Broken the promising Bull Flag pattern.
Hope you enjoyed this GEM Call with a huge Return.
Entry Zone: $0.10 - $0.140 ✅
Dips present were strategic buying chances.
Profit: Almost 200%
My Target for the Bull run is =
TP1: $0.3✅
TP2: $0.5✅ ( ALmost hit $0.4 )
TP3: $1
TP4: $2
Long Term TPs: $3/$4
RT if you want more 10x-50x GEM in this Bull Run.
#CGPT #Cryptocurrency #GEM #BitcoinETF $CGPT

FET/USDT Did 117% profit in few weeks#FET/USDT Profit Update:
NYSE:FET Gave huge profit within few weeks.
Entry was around $0.57 filled.
Currently trading at $1.07 and went up to $1.23.
Profit: 117%
Now: Taking partial profits on #FET and Some hold for the Long term.
Re-Entry: If Price holds $1 then super bullish but if dip comes then Try to enter Around $0.6-$0.5 Levels.

$BTC Daily Chart:
Time to take a break for the bulls. Bitcoin has surged by 40% without any significant pullback.
It seems likely that it will retrace to fill the daily FVG, with strong demand anticipated below 45k and the 0.618 fib level before potentially reaching 60k.
Be ready to take advantage of any market dips, as this plan may take a few months to play out. Have a great weekend! BINANCE:BTCUSDT

Triangle Pattern, wait for a breakout | Long BiasOn 4H TF
BINANCE:PERPUSDT is trading in #TrianglePattern and now, I'm waiting for a breakout
This pattern can make at least 40% profit
Wait for a breakout and close above trendline
Time will tell
PLong

$BTC | 1H: LTF Plan:Seems like a local bottom has formed and flipped the support. The strength of Bitcoin spot buyers is evident, with bulls attempting to push the price higher.
Despite a failed short-term plan, the overall market sentiment remains positive for potential further upward movement towards filling the Weekly Fvg. Let's go! BINANCE:BTCUSDT
Previous Day:
VAH: $51555
POC: $51078
VAL : $50652
Date: 22 Feb 2024

Bitcoin Bull Flag Analysis: Wait for Confirmations#Bitcoin Bull Flag LTF Chart Analysis:
CRYPTOCAP:BTC Currently Trading in Bul flag as per 2H Chart.
This is a Bullish Pattern but not open any trade before Confirmations,
Bullish Breakout Point: $52,800
Bearish Breakout Point: $50,800
Confirmations: Await 2H candle close above/below range

BITCOIN Inverse H&S Pattern Target achieved#Bitcoin Inverse H&S Targets Update:
CRYPTOCAP:BTC Perfectly Hit our Targets zone after successful breakout.
TP1:- $47,090 ✅
TP2:- $49,225 ✅
Recent High:- $53,000 ✅
So #BTC did 21% after Clear Breakout.
Happy Trading.

ETH/USDT did 30% in few days#ETHEREUM Did an awesome Return as per my chart analysis.
➡️ Entry was filled at $2300 after breakout.
➡️Now hit our both Targets.
TP1: $2636 ✅
TP2: $3000 ✅
Hope you enjoyed it.
Remember to take profits friends - discipline pays.
CRYPTOCAP:ETH #ETH

$BTC | 1H: LTF Plan:BINANCE:BTCUSDT facing LTF Resistance on Weekly FVG. If the support level is broken, the next target could be around $50,000.
This level has significant confluence with points of interest, psychological significance, and the recent high from Monday. Or If #BTC broke the resistance It will fill that Fvg. Let's wait and see how the situation unfolds.
Previous Day:
VAH: $52449
POC: $52189
VAL : $51994
Date: 20 Feb 2024

HBAR/USDT 180% up from our Entry and Still 10x Potential #HBAR Ready for $1 in Bull Market?
1000% Potential as per Chart.
CRYPTOCAP:HBAR is currently 180% up from our entry and the most important thing we bought at the actual Bottom.
Our Entry was: $0.037 ✅
You booked a huge Opportunity to buy at Dips in the Green Box ✅
New Re-Entry Zone: $0.07-$0.08 ( If Price dump )
Targets:-
TP1: $0.083 ✅ ( 180% up )
TP2: $0.17
TP3: $0.25
TP4: $0.5
Long Term Target: $1
Still Potential 1000% gains in this bull run from our Re-entry zone.
Supports: $0.07
If you are happy with my analysis please Rt/Like
#cryptocurrency
