Trump’s $2,000 stimulus = $600B Liquidity: Bitcoin To the Moon?Trump’s $2,000 Stimulus Could Light the Fuse for the Biggest Crypto Rally Ever
This isn’t just another political headline.
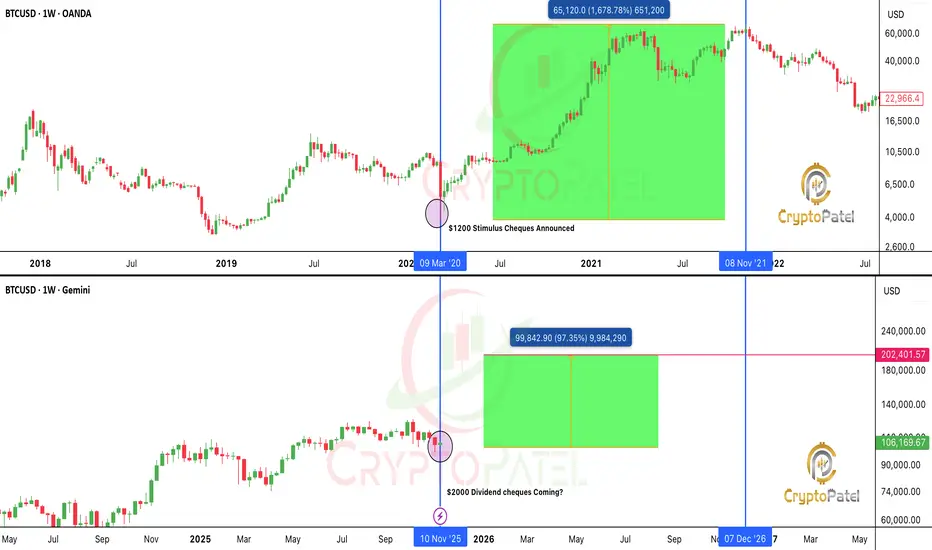
If Trump’s plan to send $2,000 stimulus checks funded by tariff dividends actually happens, it could unleash a $600 billion liquidity wave into the economy.
That’s nearly the same scale as the 2020 stimulus, which kicked off one of the most legendary bull runs in history.
🔹 Bitcoin skyrocketed from $3,800 to $69,000
🔹 Ethereum exploded from $90 to $4,800
🔹 Altcoins went absolutely wild, 50x, 100x, even more
But here’s the twist...
This time, the setup is 10x stronger.
In 2020, those checks were about survival, paying rent, buying food, covering bills.
Crypto was new. ETFs didn’t exist. Institutions were on the sidelines.
Now? The game has completely changed.
✅ Crypto is mainstream
✅ Bitcoin ETFs are live
✅ Institutions are ready to buy
✅ Retail access is everywhere
✅ The U.S. economy is growing, not crashing
In 2020, people used stimulus to survive.
In 2025, they’ll use it to invest.
When money flows into a market that’s already primed for risk...
That’s not just bullish, that’s explosive.
The 2020 checks fueled a survival rally.
The 2025 checks could ignite a speculation supercycle.
Imagine $600 billion pouring into a global asset class that’s waiting for liquidity.
Bitcoin. Ethereum. Solana. AI coins. RWA tokens. Meme coins.
History doesn’t repeat but it sure does rhyme.
And this rhyme could make millionaires all over again.
NFA & DYOR
Bitcoin (Cryptocurrency)
#BITCOIN TECH UPDATE: BEARISH IN CONTROL#BITCOIN TECH UPDATE: BEARISH IN CONTROL
CRYPTOCAP:BTC is down 14% from $115K retest, clean rejection.
Trend remains bearish, structure forming lower highs & lower lows.
Key Zones:
Relief zone: $105K–$108K (short setup area).
Major support: $94K → break below = $76K next.
Momentum:
Selling pressure dominates; no bullish divergence yet.
Invalidation:
Only a close above $111.5K flips bias bullish toward $150K. ( Super Bullish Above $116.5K)
Plan:
Sell rallies. Manage risk. Avoid FOMO longs.
NFA & DYOR

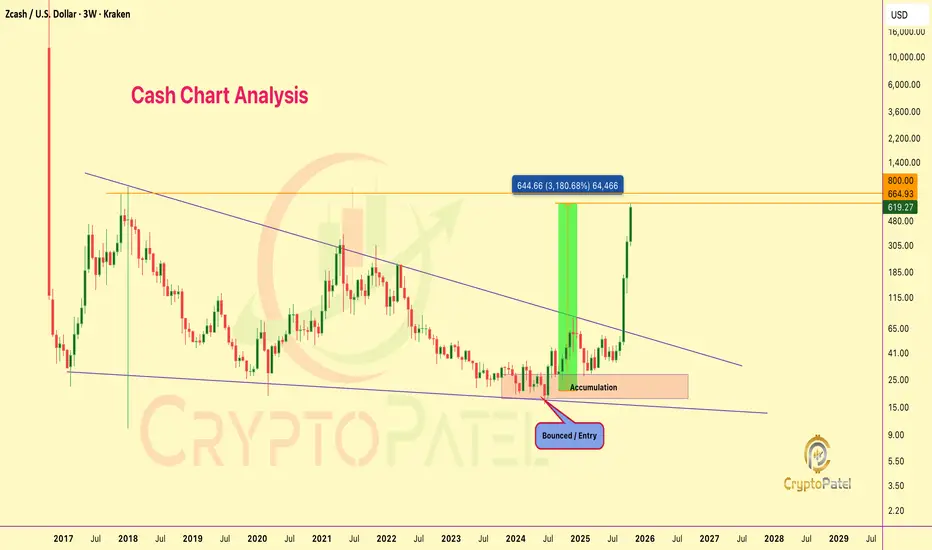
When I called $ZEC at $20, they laughed. Now it’s $662. When I called CRYPTOCAP:ZEC at $20, they laughed. Now it’s $662. Still think I’m crazy?
From our call at $20–$24, CRYPTOCAP:ZEC just went insane: Now at $662 🤯
That’s a massive 3100% GAIN from entry.
I told you legends about that $800 target, and we’re almost there!
Hope you’re counting profits and maybe ordering that new LAMBO already 🏎️
Who believed when I said #Zcash would rise again?
NFA & DYOR
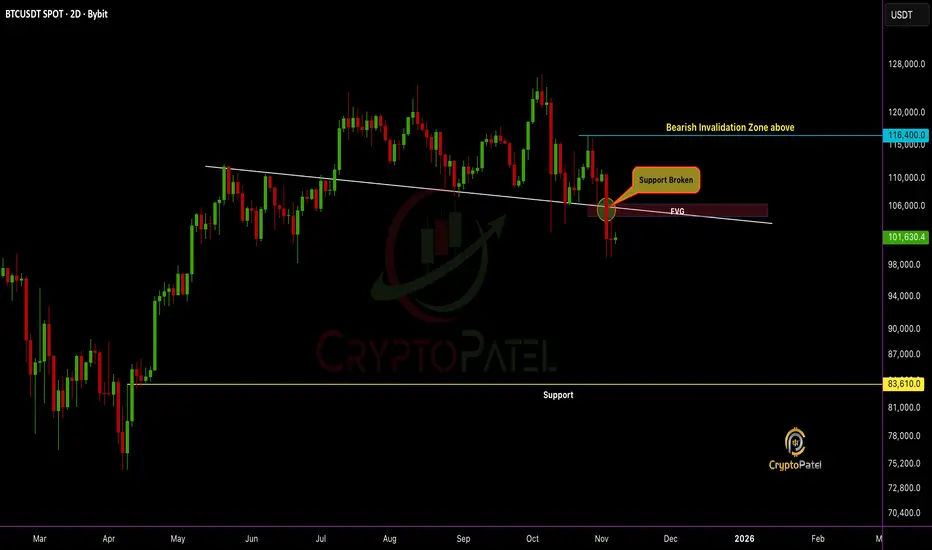
BTC Breakdown Confirmed, Structure Flipped Bearish: Next $88610?BTC Breakdown Confirmed, Structure Flipped Bearish: Next Stop $83,610?
Support is broken and the structure confirms a clear bearish shift.
#Bitcoin failed to reclaim the Fair Value Gap (FVG) zone, turning it into strong resistance.
High chances CRYPTOCAP:BTC could fill the FVG and continue the downside move toward $83,610.
Bulls remain trapped unless price reclaims $116,400, the bearish invalidation zone.
Trend bias remains bearish. Liquidity targets below are in play.
NFa & DYOR
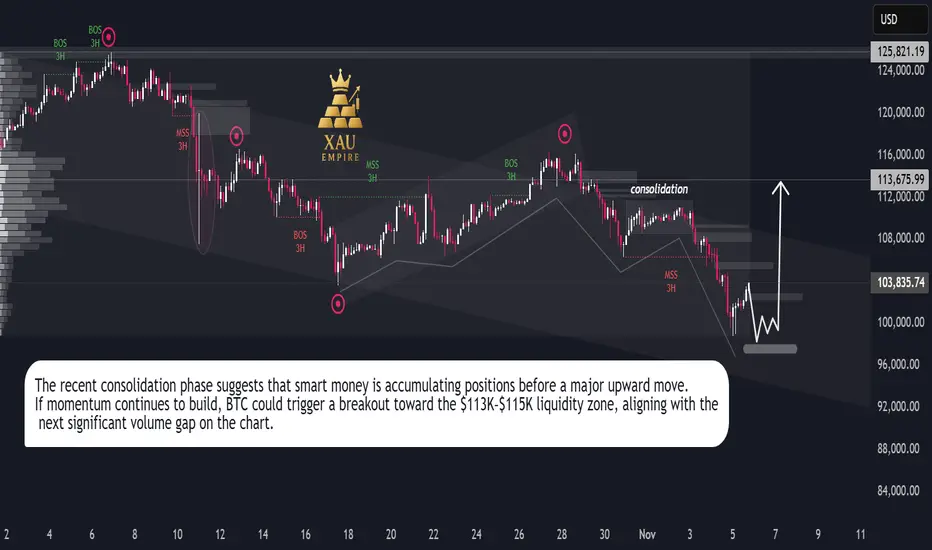
Bitcoin Bulls Target $113K**Bitcoin (BTC/USD) Analysis — November 2025**
Bitcoin has been moving within a controlled downtrend channel, facing continuous lower highs since late October. The market recently went through a **liquidity sweep**, followed by a minor **market structure shift (MSS)** on the 3-hour timeframe. This suggests exhaustion in the current bearish leg.
After a period of **sideways consolidation**, price is testing a strong accumulation zone near the **$100K–$97K** region. This zone aligns with prior demand and high-volume nodes, making it a potential base for a bullish reversal.
A clean rebound from this level could drive Bitcoin toward the **$113K–$115K** area, where the next liquidity cluster sits. If buyers regain momentum, this move could accelerate into a **V-shaped recovery**, confirming the start of a fresh mid-term bullish cycle.
Overall sentiment remains **bullish**, supported by renewed buyer activity and potential macro-driven inflows ahead. Traders should watch for volatility spikes as the market transitions from accumulation to breakout mode.
**Key Takeaway:**
BTC is stabilizing near key demand, eyeing a rebound toward $113K+. Momentum confirmation above the short-term consolidation zone could trigger a strong upward continuation.
**#Bitcoin #BTCUSD #CryptoAnalysis #BitcoinForecast #BTCPricePrediction #CryptoTrading #BullishReversal #CryptoMarket #TradingViewAnalysis**
BITCOIN TECH UPDATE: BEARISH DOMINATES MUST READ🚨 BTC TECH UPDATE: BEARISH DOMINATES MUST READ 🚨
CRYPTOCAP:BTC is down 14% from my bearish short at $115,000 retest.
✅ Those who shorted, well played.
✅ Those who avoided longing at the top, capital saved.
Price Action:
#BITCOIN hit 1st support and broke below, trend remains bearish.
Next target: $94,000.
Short-Term Relief:
Expect a bounce toward $105,000–$108,000 (retest + FVG zone) before the next leg down.
Longer-Term:
$94,000 key decision zone → potential drop to $76,000 if bearish momentum continues.
Will update with precision once $94k is reached.
Sentiment: Bearish as forecasted from $115k.
Bullish Trigger:
If BTC breaks $111,500 with HTF candle close, bullish scenario activates → potential ATH toward $150,000.
Trade smart. Watch levels. Manage risk.
Your move: Ride the bearish wave or wait for the relief rally?
NFA & DYOR

BTC First Weekly BB Break Since March: This Changes EverythingFirst Weekly BB Break Since March: This Changes Everything!
Bitcoin is currently testing a key support zone around $104K, forming what appears to be the 5th major support retest in this ongoing bullish cycle.
Historical Pattern Insight:
Each of the previous four support retests (1–4) led to substantial rallies ranging from +70% to +200%, as shown in the green zones.
If the pattern repeats, the next potential upside move (Wave 5) could project CRYPTOCAP:BTC toward the $200K region, marking a ~100% upside from current levels.
New Technical Development:
This week marks Bitcoin’s first breach of the lower Bollinger Band (BB) on the weekly timeframe since March, signaling heightened volatility and potential exhaustion of the current corrective phase.
Bearish Scenario:
A confirmed breakdown below this critical support could trigger a deeper correction toward the $50K area (–55%), similar to previous cycle corrections highlighted in red.
Key Levels to Watch:
🔹 Support: $103K–$100K
🔹 Resistance: $110K, then $135K
🔹 Upside Target: $200K
🔹 Downside Risk: $50K
Indicators:
Bollinger Bands remain squeezed, indicating volatility expansion is near. The weekly mid-band continues to act as dynamic support, but a sustained close below it could shift the bias short-term.
🟩 Bullish Bias remains valid above $100K, invalidated only on a weekly close below support.
🟩 Pattern repetition or deviation here will define Bitcoin’s next macro leg.
NFA & DYOR

Bitcoin From $49k to $126k Target Achieved 📢 Hope you didn’t miss this…
On April 7, 2024, I posted my CRYPTOCAP:BTC chart calling for buys below $50K.
Bids filled perfectly at $49K, and price exploded to a new ATH at $126K.
That’s a +157% move, level-to-level, exactly as projected.
No hype: Just pure technical precision and liquidity flow mastery.

$Q ALERT | TECHNICAL SETUP (500% Potential Setup)$Q ALERT | TECHNICAL SETUP (500% Potential Setup)
Q/USDT is sitting on a strong demand zone at $0.014–$0.016. If it holds & sustains above, we could see a potential rally toward $0.10 (~500% from this zone).
✅ Bullish structure: Price above demand = trend intact
❌ Invalidation: Price closes below demand = setup fails
Keep an eye on this key level. NFA & DYOR

This Coin Could 10x in the Next Bull Run: Don’t Miss ItThis Coin Could 10x in the Next Bull Run: Don’t Miss It
GETTEX:TAO is showing strong bull-market potential, already up 80% from our entry zone.
Key Updates:
Broke strong resistance at $460 → now support
If it holds, next targets: $1000–$1200, ultimate $2000
Book profits along the way, no one predicts markets 100%
Smart traders watch levels, not FOMO.
NFa & DYOR

$LINEA WARNING: Bearish Pressure + Accumulation Opportunity Ahea$LINEA WARNING: Bearish Pressure + Accumulation Opportunity Ahead!
Chart Analysis Recap:
Previous exit signal: $0.025 → #Linea is now ~50% down ✅ confirms chart-based strategy.
Current trend: Super bearish; expecting further downside 20%-40% before the next upward leg.
Long-Term Potential:
@Linea.eth could give 10x returns, targeting $0.1–$0.2, but success depends on smart entry points.
Key Strategy:
Ideal accumulation zone: below $0.01 for long-term holders.
Trade smart, enter on hard dips and manage risk.
Takeaway: Patience + technical discipline = positioning for potential massive upside.
NFa & DYOR

MicroStrategy Broken 55-SMA so Will Bitcoin follow the Same ?NASDAQ:MSTR Crashes Below 55-Week SMA
History shows: MicroStrategy weakness = early CRYPTOCAP:BTC top warning.
▶️ NASDAQ:MSTR bottom?: ~$115
▶️ CRYPTOCAP:BTC possible floor: ~$75K
Bitcoin is still ready for a new crash if it follows NASDAQ:MSTR below its 55-SMA.
BTCUSDT is at a critical point. Watch, learn, and act & Follow for high-value market updates.
NFa & DYOR

$MSTR Crashes Below 55-Week SMANASDAQ:MSTR Crashes Below 55-Week SMA
History shows: MicroStrategy weakness = early CRYPTOCAP:BTC top warning.
▶️ NASDAQ:MSTR bottom?: ~$115
▶️ CRYPTOCAP:BTC possible floor: ~$75K
Bitcoin is still ready for a new crash if it follows NASDAQ:MSTR below its 55-SMA.
BTCUSDT is at a critical point. Watch, learn, and act & Follow for high-value market updates.
NFA & DYOR

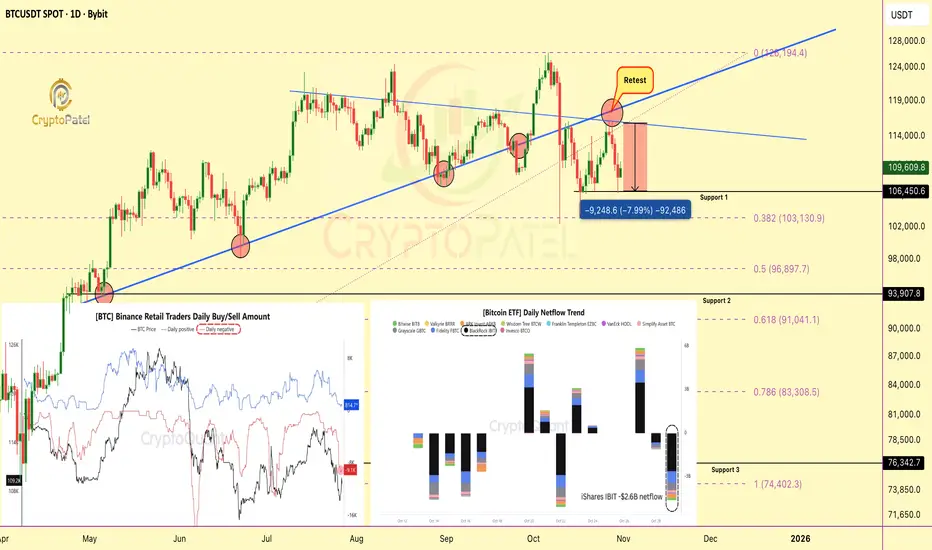
Retail Panic Meets ETF Outflows: $1B Bitcoin Sell-Off Hits MarkeRetail Panic Meets ETF Outflows: $1B Bitcoin Sell-Off Hits Markets
Bitcoin saw renewed selling pressure on Oct 30, as Binance retail traders dumped over 9,200 BTC (~$1B) around $107.7K, just days after another 12,000 BTC sell wave near $108.3K.
Technical View:
Retail traders are aggressively selling into weakness, while long-term holders remain largely inactive.
Historically, these sharp sell-offs from short-term players often form local bottoms, liquidity events where smart money quietly accumulates.
Fundamental Side:
Spot Bitcoin ETFs added more weight to the downside:
🔹 BlackRock: -$2.6B
🔹 Fidelity: -$790M
🔹 Grayscale: -$500M
These ETF outflows likely shifted capital to spot exchanges, amplifying short-term selling pressure.
Key Insight:
▶️ Retail capitulation + ETF outflows = short-term volatility
▶️ But remember, markets often bottom when retail panic peaks.
Note: NFA & DYOR
$ONDO Could Be the Next 20x Gem: Are You Ready?LSE:ONDO Could Be the Next 20x Gem: Are You Ready?
Currently in bearish breakdown, but if price falls below $0.50, IMO best accumulation zone starts.
Strong Support Zones:
Support 1: $0.53–$0.46
Support 2: $0.24–$0.20
Targets (Long Term): $5 / $10 (~20x from entry if filled)
Manage risk & DYOR, huge upside if supports hold!

Will Bitcoin Ready to Next leg down toward $76000?CRYPTOCAP:BTC has completed a bearish retest at the $116K resistance zone, maintaining a bearish bias below $116K–$117K
If price continues to reject this level, I’m anticipating a corrective move toward: $105K → $93K → $76K
However, a confirmed breakout above $117K would invalidate the bearish structure and could trigger an extended rally toward $150K+.
Resistance: $116K–$117K
Support: $105K / $93K / $76K
Bias: Bearish below $116K | Bullish above $117K
Stay disciplined — structure > sentiment.
NFA & DYOR

THE ENTIRE MARKET IS ABOUT TO HARD DUMPTHE ENTIRE MARKET IS ABOUT TO HARD DUMP
If #Bitcoin holds the $107K–$104K support: next stop $150K 🚀
But if it fails… prepare for a hard dump toward the $80K zone 😳
This is the make-or-break level.
NFA & DYOR

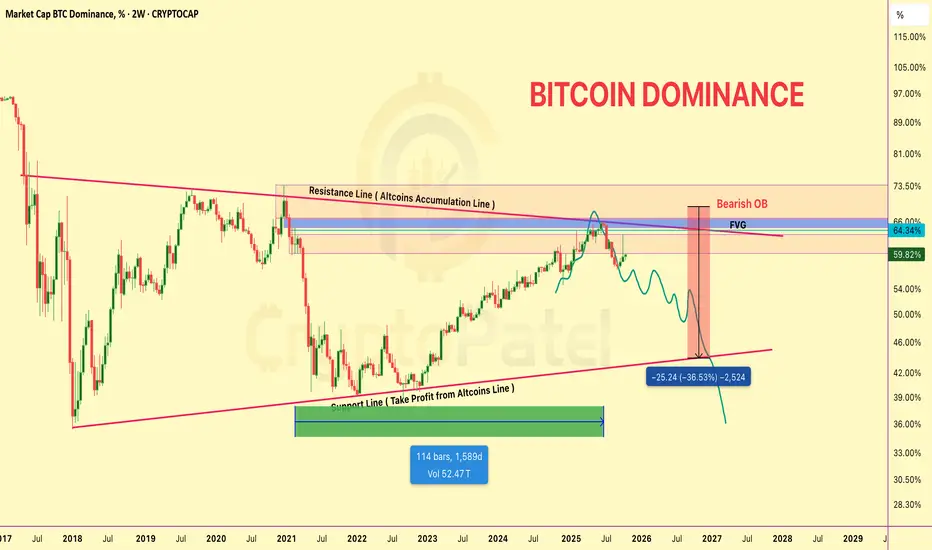
Why Altcoin Holders Need to See This BTC Dominance Chart RIGHT NWhy Altcoin Holders Need to See This BTC Dominance Chart RIGHT NOW
BTC.D still trending UP → targeting 63% before the reversal
Yes, it hurts altcoin bags right now 😤
63% → flip to 40-45% → ALTSEASON 🚀
Let BTC run. Your bags will pump after.
Patience wins.
NFa & DYOR
$LTC ACCUMULATION PHASE IS OVER: Ready to $500?🚨 CRYPTOCAP:LTC ACCUMULATION PHASE IS OVER 🚨
✅ Strong bounce from 7-YEAR trend line support
✅ Soon Break out 4-YEAR descending wedge
✅ Re-accumulation zone: COMPLETE
1️⃣ Target 1: $216 (+129%)
2️⃣ Target 2: $388 (+311%)
3️⃣ Target 3: $532 ALL-TIME HIGH (+464%)
👉 Last time this pattern played out = 1,596% PUMP
But yeah, keep buying at ATH 🤡
NFA & DYOR

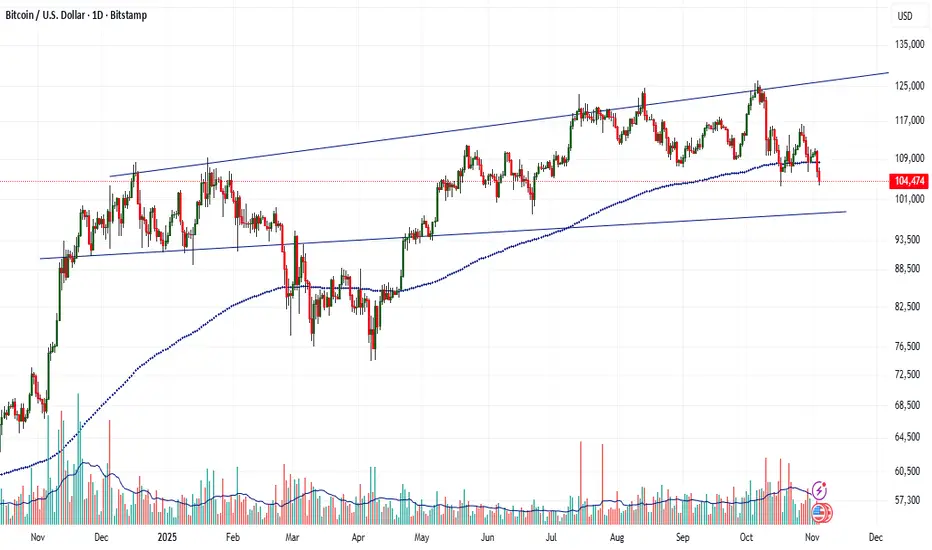
Bitcoin – Buying the Trendline, Not the HypeBitcoin (BTCUSD) continues to respect its rising trendline structure , showing consistent demand on every retest. This type of price action often reveals where smart money is quietly adding positions, not chasing, but accumulating near support.
Each of the highlighted points shows how price has respected this trendline multiple times, forming a clean series of higher lows. As long as this level holds, the broader direction remains bullish.
Currently, BTC is testing this key support once again. I’m positioning near the trendline because the risk is clearly defined , and the potential reward toward 111K+ remains wide open.
Short-term volatility can still appear, but structure beats emotions . As long as buyers defend this zone, we may see another impulsive leg forming soon.
Disclaimer: This analysis is for educational purposes only. It’s not investment advice. Always do your own research before trading.

BTC Market Update: Bulls Regain ControlBitcoin has stabilized after a sharp corrective phase, forming a consolidation structure around the $111,000 area. Recent sessions indicate that sellers are losing dominance while buyers are quietly re-accumulating within the current range. This type of price action often appears before a potential short-term recovery move.
Market volume remains steady, and the structure shows compression—suggesting liquidity buildup below the current level. If this consolidation sustains without breaking lower, a breakout toward the $115,000–$116,000 region appears likely. A clean move beyond this zone could invite stronger bullish continuation as sidelined traders re-enter.
However, the broader trend remains cautious, as macro conditions and dollar strength could still limit momentum. Short-term traders may look for entries near the range lows with clear invalidation below $108,000. Proper risk management remains essential, targeting gradual exits around mid-range levels and scaling profits near projected resistance zones.

This $4 Token Could Hit $20 And Nobody's Talking About ItThis $4 Token Could Hit $20 And Nobody's Talking About It
Support: $3.70-$4.00 (holding)
HTF Target: $20 (5x potential)
Why it matters:
✅ Exchange tokens outperform in bull cycles
✅ Clear support zone + bullish structure
✅ 500% upside if base holds
While everyone chases pumps, smart money accumulates at support with 5:1 risk-reward.
IF this holds $4 Support, NYSE:BGB could be the millionaire-maker nobody saw coming.
DYOR. Not financial advice.
