BitcoinHello and welcome to this analysis on BTCUSD
In Jan 2022 it completed what appeared to be a sideways correction and activated a Bullish Harmonic Reciprocal AB=CD @ 33000.
From there it went on to give a 38% retracement till 48000 by the end Mar 2022.
The current decline is now testing the reversal zone of 33000. The next support below this is the crucial one near 28500.
Failure to hold that short-term rising trendline which has so far been making HIGHER LOWS could see a further plunge till 15000 & a possible 11500 where the long term monthly trendline is and a zone it had done a long period of consolidation from JUN-SEPT 2020.
Resistance is at 37000 for now
Bitcoinforecast


Bitcoin (BTC) is Ready for Next DeclineBitcoin (BTC) is indicating decline below 37500 based on 38% Retracement Breakout Trading Strategy.
Selling Range is 39060-38420 and Stop loss is 39581.

Bitcoin getting ready to explode upsideBTC is at the bottom of the daily channel and looks like bottoming out with an ending structure completing its wave structure for now and the next move can be towards the upside. If it were to go all the way up then the daily channel target towards the upside would be over 50k.

Bitcoin respecting the trend line.Bitcoin has been respecting a trend line and is taking support from it.
The coin is trading around its 20 ema on 15 mint time frame.
Support will be the trend line. Let the price trade below the trend line or breaks above the level of 38810.
On daily time frame, it’s forming an inside candle.
Support :- 38100, 37700
Resistance:- 38810, 39270
Wait for price action near the levels for entry.

BTCUSD Bitcoin / U.S.D Mid term view Bitcoin level analysis in day chart, please follow levels, for educational purpose only.

Bitcoin By 2022 EndWe are in Bearish Trend Basis of that by the year end 2022 end
Bitcoin will b
Lowest LOW 20K
Mid Low 25k
Kindly do your own Analysis for any financial decision or seek your financial advisor, i am not a financial advisor i am sharing for entertainment and Informational purpose on the basis of experiences.

Bitcoin - The Bigger PictureHi,
This is my second analysis of BTC in upcoming days or weeks.
I have seen a lot of people saying BTC will go back to 20k, 25k and even 10k too. They are saying because BTC crashed back in 2016-17. That time, only a few people were into cryptocurrencies.
We should be bullish at this moment but the current circumstances won't let the bull run happen.
BTC hit first ATH on 14-Apr-2021 with a price of 65,000 USD and got back to 28,000 USD in a month. Those people who bought the BTC started selling like there's no tomorrow.
Again, in the same year, BTC touched the price of 69,000 USDT and retraced to 34,000 USD but this time, it takes almost two and half month. You all know why-
because people realise the potential of Bitcoin and other crypto currencies
more and more support from Big corporates and Government.
Now coming to the point, we are still in the Trend and I am still bullish .
Thanks

BTCUSD Next Move april & May 2022BTCUSD looking more bearish in coming day..
We are looking target 33000 first then 26000

Play ETHEREUM with moving averages.Ethereum is trading at a crucial support zone and there can be a reversal.
Though, on a 60 minute time frame, the moving averages crossover is showing some bearish trend.
On a 15 minute time frame, the coin taking support for the zone and strong bullish candle are being formed.
Support :- 2945,2850
Resistance :- 3020, 3100
Watch for the candle to close above is 20 ema on 60 minute time frame, as it has been taking resistance from the static level.
It can travel upto 200 ema once it gives a strong close above 20 ema.
Price action and volume analysis must be used.

BTC/USDT Price Prediction 2025BTC/USDT Price Prediction 2025 using sigma spikes. Here you will learn to spot bull rally for long term investment in simple manner.

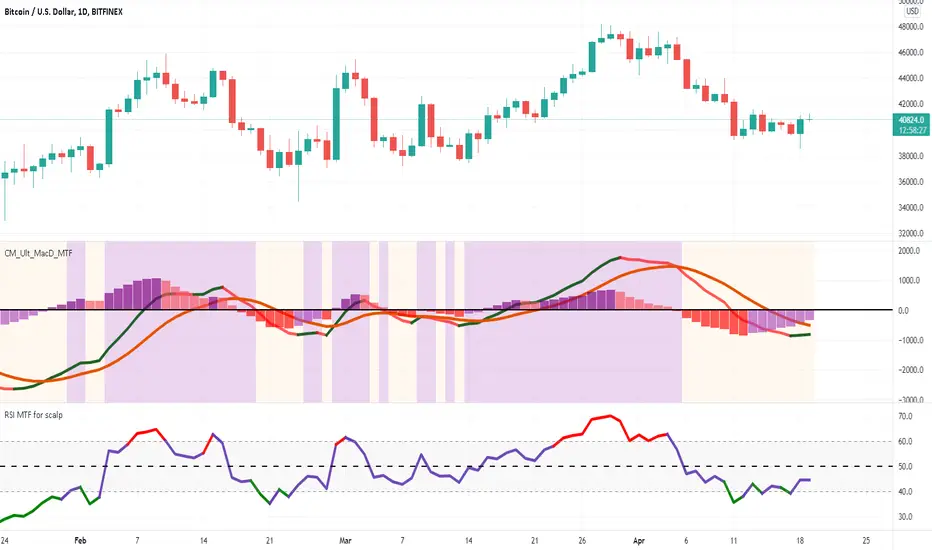
Short Term Bitcoin - 19 April 2022 - BuyHi
As per the Chart and its prediction, we can Buy at cmp of 40806 with SL of yesterdays low of 38540 and taraget could be big, with first target of 47000 and then 51000.
As of now RSI has gone above 40 and macd is turning bullish.
We might have a glorious rally in coming weeks.
The risk reward is around 1 : 3 and more.
Else if in intra trades...buy the dips is the mantra.
Will keep on reviewing untill targets or the SL is hit.
Disc:- only for educational purpose.
BTC channel pattern4 touches at bottom
3 touches at top
Buy with your setup in anticipation to touch top
BINANCE:BTCUSDT

BTCUSDTBitcoin prediction as per chart pattern
their should be shakeout before breakout/breakdown
shakeout happened now it's time for breakdown
Take trade accordingly with proper risk management

Intra Day - Analysis - Bitcoin - MACDHi,
This chart with help from Macd , one is 15 mins Macd and the other is 1 Hour Macd.
1 Hour Macd is above Zero line & hence we will look out for Buy only.
Currently the price is above Pivot Level.
And the 15 mins chart will give a clue along with EMA when to go Long.

Bitcoin view 14/04/22.Bitcoin is trading around a crucial fib level on a weekly time frame of 41390 (0.50 fib level).
It seems bullish on higher time frames of weekly as it has taken support form 0.382 fib level, for swing trades we can enter is a 4 hour candle closes above 41500.
On daily time frame analysis, it is forming a lower highs and lower lows and has given a cross over of moving averages, thus looks bearish.
If the price drop below 39300 it can test levels of 37500-600.
Support :- 40400,39790, 37600
Resistance :- 41390, 42100, 43010
On 4 hourly time frame, it has crossed its 20 ema with a bullish candle and is trading in a range.
Wait for the level to break convincingly and there can be a trend reversal in a shorter time frame.

Bitcoin's lifetime Fibonacci Lines & DiaryBitcoin is going to face pressure from two support lines that you can see on the chart and while people find a lot of correlation between S&P 500 Index Chart to that of bitcoin, we can assume that there's huge volatility across the global markets and not just cryptocurrencies.
I've drawn multiple scenarios for reversal without having an ambitious target like bitcoin maximalists or Cathie Woods. It's possible but not anytime soon.
Stick to entering your positions on any resistance line that could potentially become support.
And stay away from scalping for a few weeks :D

BTC-usd chart ( possible movement ) breakout on any direction shown on the chart keep an eye over the movement and trade accordingly .
Follow for more

BTCUSDT chart shows the indication to take support @ 40856.57.BTCUSDT chart today shows the indication to take support @ 40856.57 and if it breaks that level in 4 hour time frame on Monday UTC market open time, we might see a fall to 39097.76 within next 4 to 5 candles of 4hr TF. I will not trade futures until the candle remains in the red rectangle zone shown in my chart.
BTC shows a weak support @40856.57 and very strong support at 39097.76. I am taking part entries for my spot in #solana,#sand, #ada, #atom, #iotx and #avax
Once BTC reaches 39097.76 I will take major spot entries in above mentioned alt coins.
Happy & Profitable trading to all crypto community. :)

BTC CHART hello friends , here is my technical analysis of bitcoin for coming week . be careful of next week

Ethereum gives a nice breakout of "W" Pattern.Ethereum has streched for contunues week and changing the trend near the support level.
Its taking support from the 20 ema on a weekly time frame.The price has tested the support and has given a upmove.
On daily time frame too there is a bullish momentum in the price as its taking support from 20 ema and has given a cross over in the moving averages.
Ethereum can run either side as its trading between 20 and 200 ema on 4 hour time frame.
Support :- 3100, 3020, 2950
Resistance :- 3434, 3675
It has support near its trading price and can reverse form the support.
On a short time frame there can be a resistance at 3320.
So wait for the price action near the levels before trading the coin.

Bitcoin forming evening star.Bitcoin on a weekly analysis is forming an evening star chart pattern and is taking support. It is trading below its 20 ema and 0.382 fib levels.
On daily time frame, it has closed below is 20 and 200 ema and seems little bearish for short time fame as 4 hour time fame has given a moving average cross over.
It can retest its 20 ema on 4 hour time fame and fall further.
Support :- 42100,41380. 39790
Resistance :- 43010,44550, 45600
Supports may be breached once the price trade below the levels and sustain.
Bitcoin has streched and can come futher down to test the levels
Wait for the price action near the levels before trading,

Bitcoin 15 min. chart anlysisBitcoin chart analysis.
15 mon. chart analysis.
Arrows are indicating of direction and entry exit.
