BTCUSD | 4H | Breakout → Retest → Continuation SetupBitcoin has delivered a strong impulsive breakout from a previous consolidation range, indicating bullish strength and fresh demand entering the market.
Price is now retesting a key demand / support zone, which previously acted as resistance. This support-flip-resistance (SBR) structure increases the probability of a trend continuation move to the upside.
Technical Confluence
Higher-timeframe bullish structure intact
Strong impulsive leg → healthy pullback
Retest of prior resistance turned support
Clear risk-to-reward setup
Trade Idea
Bias: Bullish continuation
Entry: After confirmation at demand zone
Stop-loss: Below the demand / structure low
Targets: Next higher resistance / liquidity zone
As long as price holds above the reclaimed support, the bullish scenario remains valid. A clean rejection with strong candles would confirm continuation.
⚠️ This is a technical idea based on price action. Always manage risk.
Bitcoinidea

BTCUSD · 15M · SMC BiasPrice is currently compressing inside a higher-timeframe premium discount equilibrium, respecting a clear range structure.
HTF Context
Equal highs / liquidity resting above the range highs.
Premium zone overhead aligned with prior supply + inducement.
Discount zone below marked by clean HTF demand.
LTF Narrative
Market already delivered a strong impulsive leg up.
Current consolidation suggests liquidity engineering, not continuation.
Upside push toward the equal highs is likely a liquidity grab, not acceptance.
Expectation
Sweep of buy-side liquidity into the premium zone.
Immediate reaction from supply.
Sharp displacement to the downside targeting:
Range low
Discount imbalance
HTF demand below
Execution Plan
No chasing longs in premium.
Wait for:
Liquidity sweep above highs
Bearish displacement
LTF MSS confirmation
Shorts favored post confirmation.
Targets trail into discount until opposing demand shows intent.

BTCUSD – 1H | Liquidity Run → Distribution →Mean Reversion ScenePrice delivered an impulsive expansion into premium after sweeping internal liquidity from the range lows. That move was displacement, not acceptance.
We are now stalling at a prior H1 supply / EQH zone near the range high. Structure here is weak: wicks, overlap, and loss of momentum hint at distribution rather than continuation.
Narrative
Liquidity taken above recent highs
Price taps premium supply
Expect a lower high / range failure
Smart money likely reallocating shorts
Execution Bias
Shorts favored below the blue level
Invalidation only on clean H1 acceptance above supply
Downside Targets
Range mid → internal liquidity
Range lows
External sell-side resting near deep discount zone
Until price shows acceptance above supply, this remains a sell-the-rally environment.
Expansion up was the trap. Mean reversion is the play.

Bitcoin: The 2026 Grind – Rejection Zones vs. The $130k TargetChart Analysis
Bitcoin has successfully completed a SL hunt to the downside, sweeping liquidity and finding local support. With this liquidity grab finished, the immediate bias shifts upward as price begins the "2026 Grind" toward higher structural resistance.
Using a Trend-Based Fib Extension ($55K Low - $106K High - $76.5K Retracement), we are monitoring the reaction at key overhead levels.
1. The Current Move: Testing Resistance
Following the stop hunt, price is grinding upward to test the strength of the recovery. The bulls face two critical hurdles:
Rejection Zone 1 ($95K - $97K): The 0.382 Fib level. This is the first major test for the bounce.
Rejection Zone 2 ($100K - $103K): The 0.5 Fib level. This is the "line in the sand" for the bearish case.
2. The Bearish Scenario (Rejection)
If the rally stalls and gets rejected at either of these zones, it suggests the bounce was merely corrective.
Downside Target: A failure here opens the path to $69K - $70K to fully reset the market structure.
3. The Bullish Breakout
If the momentum from the recent stop hunt is strong enough to pierce through the resistance zones:
Confirmation: A break above the $110K level flips the structure back to bullish.
Target: This opens the door for a run to the 1.0 Fib extension at $127K - $130K .
________________________________________
I built a trading journal that actually respects your privacy.
No sign-ups. No servers. No monthly fees. 100% free.
PublishNotes runs locally in your browser. You own the data, you own the backups. It helps you track your execution, bias, and behavioral mistakes without the friction of cloud apps. Download it, use it, export it. It's that simple.
Try it here: publishnotes.com
hashtag#trading hashtag#tradingjournal hashtag#privacy hashtag#notetaking

Bitcoin Monthly Support Test — Next Target $58,419 ?Key support sits at $81,933. A clean break and close below this zone could expose Bitcoin to a deeper retracement toward the next major support around $58,419.
However, $81,933 is also a strong monthly support level, so the market’s reaction here is critical.
Keep an eye on whether this level holds or fails — it will likely dictate the next major move.
Share your view in the comments: Do you think BTC will defend this monthly support, or are we heading lower?

BTC out of box and retest done.. going upBitcoin long position is on the way. Btc is now out of critical box expected now to get reward same like range of box. So as marked it can go upto trendline to test it and completes the range on buying side in short term then after trendline hits we need to see for next move.

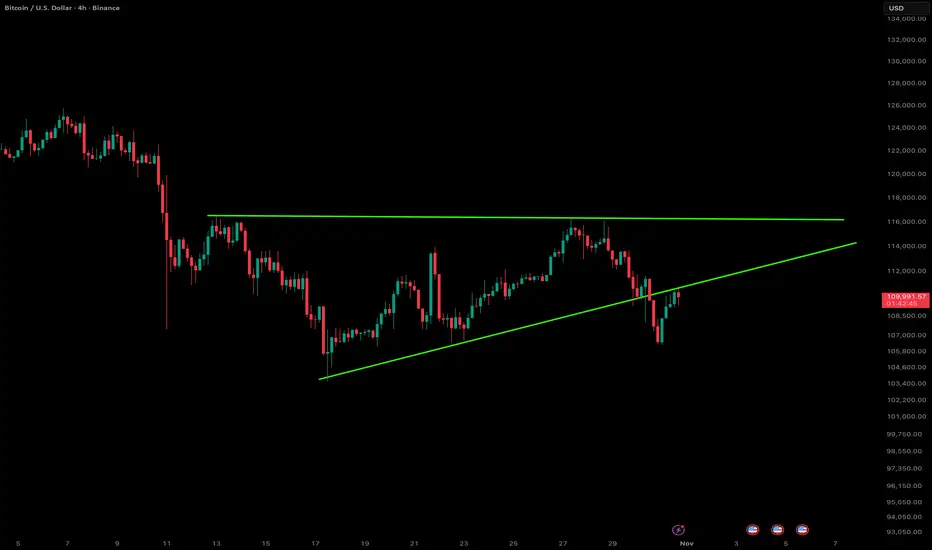
Bitcoin – Breakdown from the Ascending TriangleBitcoin just slipped below the ascending triangle support on the 4-hour chart, signaling a potential shift in short-term momentum. The structure had been forming higher lows toward the $115K resistance zone, but sellers stepped in hard near the top, breaking the trendline that’s been guiding the uptrend since mid-October.
The move comes amid broader weakness across the crypto market — BTC has shed about 3.7% this month, while altcoins like XRP and ETH are also struggling. Despite the pullback, Bitcoin still holds an impressive 18% gain for the year, so the bigger picture remains constructive.
Macro pressure seems to be weighing on sentiment — investor caution around interest rates, inflation, and the Fed’s next move is keeping volatility elevated. If upcoming data tilts toward another rate cut, we could see renewed upside momentum. But for now, price action suggests a possible retest of lower zones before bulls can re-establish control.
Overall, a clean technical breakdown in the near term, but the broader trend isn’t broken yet. Let’s see if bulls can reclaim that triangle support in the next few sessions.
DONT FORGET TO CHECK MY PROFILE BELOW 👇👇👇
BLOOD BATH IN BITCOIN Bitcoin is going to crash within 1/2 days only if sustains below 106,400 USD. We can plan for sell side after closing below the level. CRYPTO:BTCUSD . Mark the level and simple wait for the confirmation.

BTCUSD – Short Opportunity Building 30m Chart1. Price rejected from the supply zone near 115,700–115,800, showing resistance.
2. Current structure has shifted bearish with lower highs after rejection.
3. Key intraday support stands at 115,100–115,000; a sustained break below could accelerate downside.
4. Next demand levels to watch: 114,280 and 114,116, aligning with liquidity zones.
📉 Plan:
Short entries remain valid below 115,300.
First target: 114,280
Extended target: 114,116
Invalidation above 115,800.
Recommendation: Monitor for clean bearish continuation; keep risk tight due to BTC volatility.

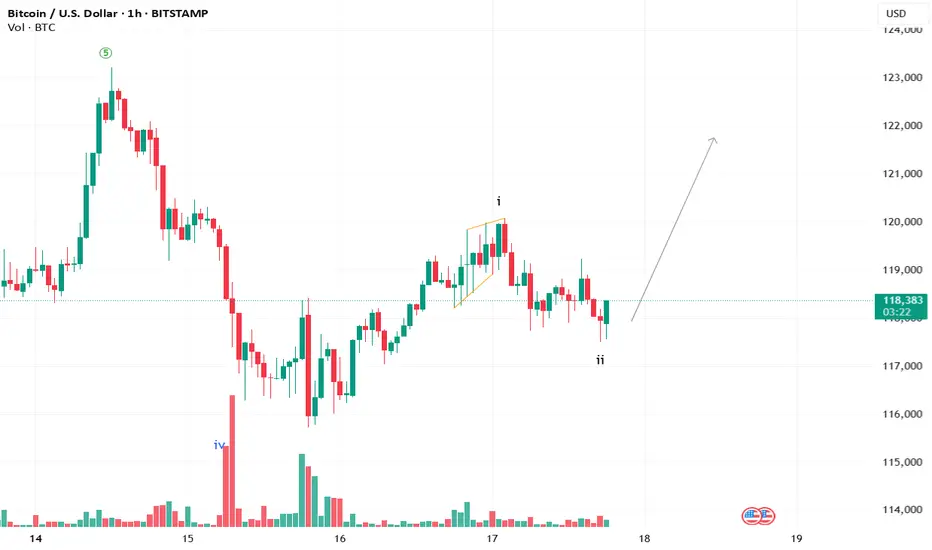
BTC ready to move up?An impressive wave 2 structure is about to be completed. We may observe the next wave 3 on the upside.
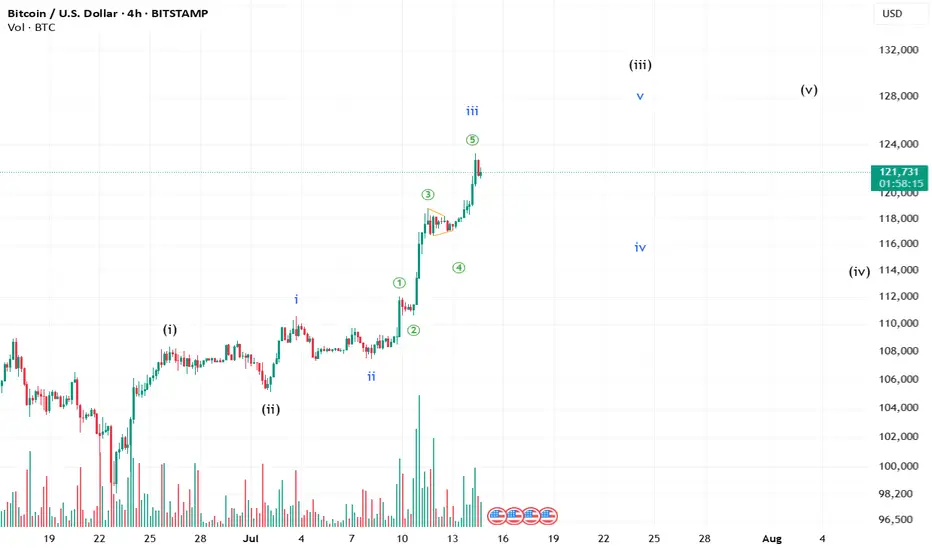
There is some steam still left in BTC!!BTC might still try again to push the levels to complete its sister waves. Whether it will sustain in the future is still yet to be answered.
**This is an educational market outlook, not investment advice. Please consult a SEBI-registered advisor before taking any investment decisions.**
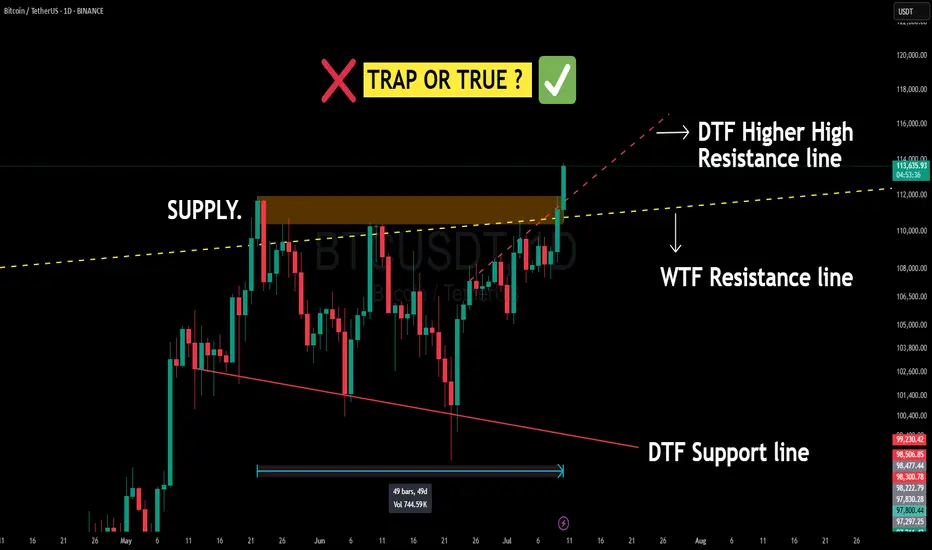
BITCOIN Just Smashed a 50-Day Supply Wall — Breakout or Fakeout Bitcoin (BTC/USDT) on the Daily & Weekly Timeframe just pulled off something BIG:
✅ Broke out of a 50-day consolidation range
✅ Closed above a strong Daily supply zone
✅ Cracked both DTF & WTF resistance lines (including a higher-high dynamic DTF resistance)
✅ Volume confirmation with a strong green candle
📌 This is an extremely bullish structure for short-term scalping ideas.
But Wait — What’s Happening Technically?
Supply Zone: This orange box is where BTC got sold off multiple times before. Breaking above this = strong bullish intent.
⚠️ Caution: Bitcoin is the King of Fakeouts 👑🐍
BTC has a notorious nature for false breakouts, trapping both bulls and bears. That’s why:
🧠 Best Strategy = Trap Trading OR
⏳ Wait for a pullback and retest of broken zones on higher timeframes . Plan your trade - trade your plan .
Don't chase — let price come to you.
💬 Drop your thoughts / doubts in comments.
📌 Not financial advice — just me and my Emotions
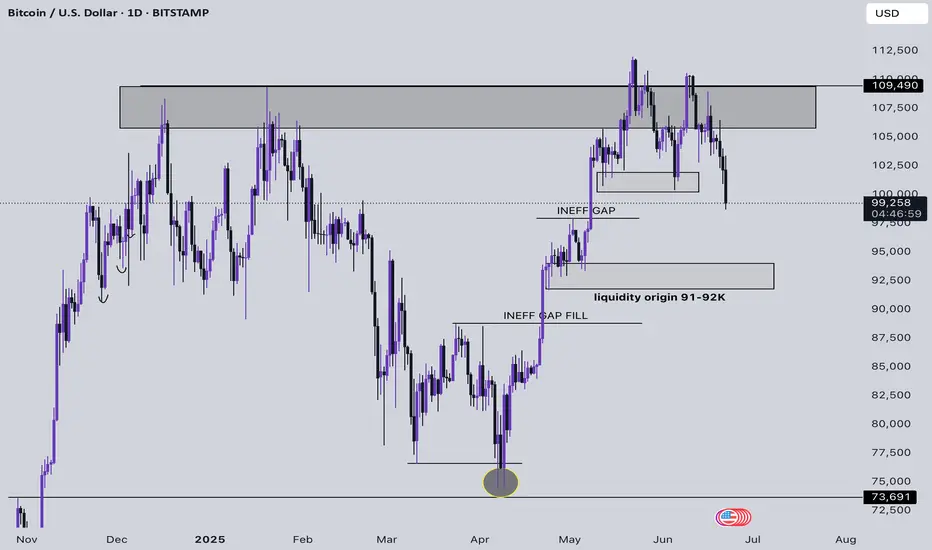
Bitcoin 1D Technical Analysis Bearish Bias- Bitcoin is currently trading at 99,453$, down almost 11% from its ATH
- Bitcoin trapped many buyers above 110,000$, and now they have become aggressive trapped sellers
- We have origin fill left and a large inefficient gap left for Bitcoin to fill at 88,765$ to flip bullish I will sit and wait for BTC to start a consolidation there, and then I will look for aggressive spot buys
- Avoid leverage at all cost, it makes no sense to lose money until the price behaviour of BTC settles We can see BTC repurging 73,000, it's in the playbook as well
- Market Structure shift in BTC is highly bearish unless we see a structure shift on a 4h or 1d TF
- Manage your risk and try to avoid leverage at all cost
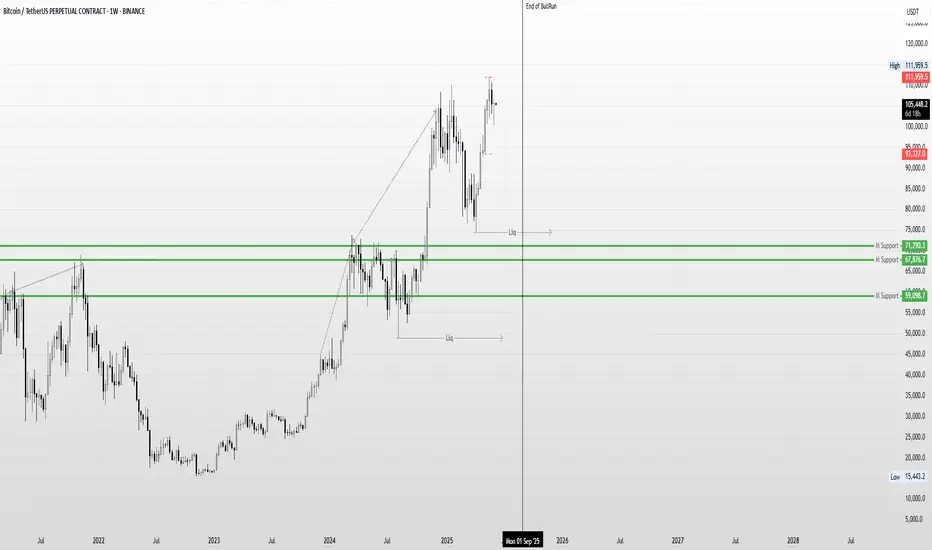
Bitcoin Weekly Analysis: Potential Exhaustion in Price ActionWhile Bitcoin continues to form Higher Highs on the Weekly Time Frame, the overall price action appears to be gradually losing momentum. From my perspective, this could be an early sign of exhaustion, suggesting that the current bullish trend may be nearing its end.
If this weakening momentum continues, there's a possibility that a broader correction or even the beginning of a bear market could unfold post-September. In such a scenario, the market may attempt to hunt significant downside liquidity levels, potentially targeting zones around $74,000 and even as low as $48,000.
Of course, this is purely a personal prediction based on current price structure and market behavior. Only time will reveal how accurate this outlook turns out to be.
Disclaimer :
This content is for informational and educational purposes only and does not constitute financial or investment advice. The views expressed are based on personal analysis and should not be considered as a recommendation to buy, sell, or hold any asset. Cryptocurrency markets are highly volatile, and past performance is not indicative of future results. Always do your own research (DYOR) and consult with a licensed financial advisor before making any investment decisions.
Bitcoin 1D Technical Commentary & Bias Path - Bitcoin is currently trading at 104,521$
- The previous weekly close for BTC wasn't bullish and the following print or the current candle print does not indicate any bullishness based on the current price behaviour
- The drawings indicate that Bitcoin printed a new ATH, trapped many retail longs, and deviated right below the ATH by publishing a strong bearish print
- The following print after the ATH liquidated many late longs and also showed high sellers interest getting aggressive, now we have 2 possible playouts for BTC
- 1st path shows we can fall and fill the inefficient gap at 97,000$ flip a market structure shift to bullish and then pierce fresh highs
- The 2nd path shows we can simply purge the 1st inefficient gap and pierce through the second one which will eventually cascade a lot of liquidation and then we can finally move higher by bringing in extreme Fear

BTC Bull Run Ending Soon?"September could mark the climax of Bitcoin’s bull rally, triggering a correction phase as smart money begins profit-taking — key levels like $74,457 and $48,888 may become attractive accumulation zones in the upcoming bear market."
Disclaimer : This content is for informational and educational purposes only and should not be considered financial or investment advice. Cryptocurrency trading involves significant risk and may not be suitable for all investors. Always do your own research (DYOR) and consult with a qualified financial advisor before making any trading decisions.

Bitcoin Technical Analysis Bear/Bull Market- Bitcoin is currently trading at $74,452, down 32% from its ATH.
- Bitcoin is facing a significant sell-off along with major world indices due to the tariff war between the US and China and other powerhouses.
- This widespread selling will stabilize once it leads to the absorption of all bears, and eventually, we will see sideways action followed by an upward expansion.
- The important areas to monitor are the highlighted circles; the first one marks the origin of the move, while the second contains a fair value gap that has not yet been mitigated.
- From a Spot buyer perspective I would like to see either of the two paths playing out
- Manage risk until then
- Buying Zones: 60-63,000$ & 67,000-71,000$

BitCoin: A new Move about to start.BitCoin has been consolidated for the last 6-8 months in a channel shown in the graph.
As per prediction it is about to break that range and will move towards new and higher highs.
As per the chart and pattern structure in this current move it can go up to 100K easily and more above levels will be unlocked after that
SL must be 56k.
Targets 100k - 120k
Time range 8-10 months
it does not constitute and cannot replace investment advice. We therefore recommend that you contact your personal financial advisor before carrying out specific transactions and investments.

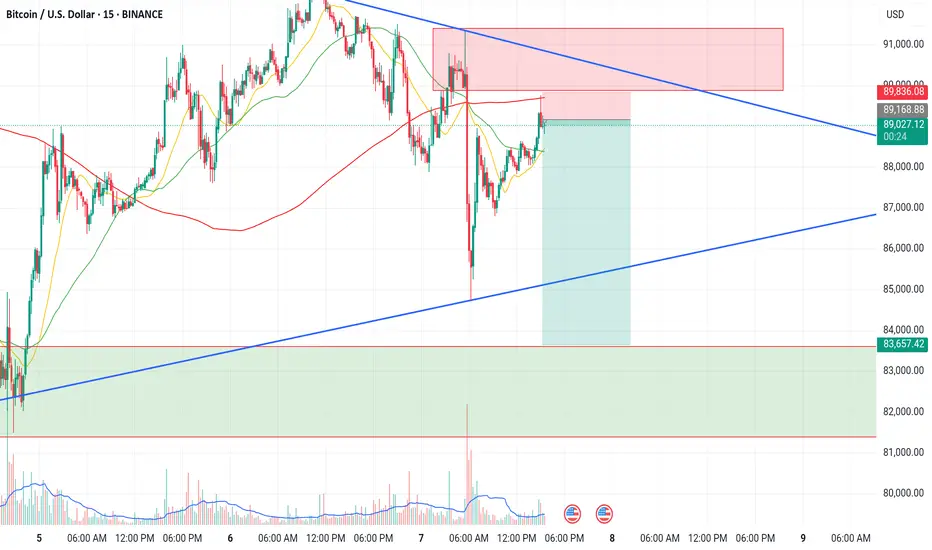
Very good shorting opportunity in BTC. Trade setup explainedBtc is getting rejection from 1hour supply zone. We can short btc with sl of 89840. We can target level of 83650. Risk reward ratio of the trade is very good i.e 1:8. Below at 83000 levels We have a demand zone which will be our target for the trade.
BTC#9: BTC is likely to have a correction and here's why
💎 💎 💎 Did you make a profit in the previous post #8? Like and follow the channel to follow the earliest trading plan. 💎 💎 💎
🔥 Let's plan for the next BINANCE:BTCUSDT BINANCE:BTCUSD 🔥
1️⃣ **Fundamental analysis:**
📊US consumer price inflation accelerated late last year, supporting the Fed's decision to pause interest rate cuts
🔴 Trump announces 25% tariffs on Canada and Mexico, "Trade war" begins again
🔴Trump threatens that tariffs will take effect on February 1! Influenced by Trump's tariff policy, the market's risk-off sentiment has increased significantly.
🚀 15 US states are pushing for strategic Bitcoin reserves, with Arizona and Utah temporarily leading
📌 In the past hours, the entire network has liquidated $204 million, mostly buy orders
2️⃣ **Technical analysis:**
🔹 **D Frame**: Although the price structure is still increasing, the reaction of the resistance area shows that we will have a correction.
🔹 **H4 Frame**: So the resistance area has been confirmed. The price continues to SW this area without a breakthrough, we will have an official correction. The price will find the support area below
🔹 **H1 Frame**: As you can see, the current price structure is bearish. Currently, I do not see any signs of price reversal.
3️⃣ **Trading plan:**
⛔In the previous article, you can see that this scenario was predicted. The current price reaction is very weak for the BUY side. We will have to wait at the support zone below.
✅If anyone has a good position at the resistance zone of 104k~105K, there is a basis to wait for a better profit. If anyone does not have a position, they can wait for the price structure if there is a slight recovery to the resistance zone above. Both the fundamental information and the price line support the option that there will be a deeper correction for BTC
💪 **Wish you successful trading!**
📌 For any questions, please contact directly. I am ready to answer you for free

As I told The bitcoin starting Bear rally nowIn previous posts i alert about the upcoming mega dump and here's is the result

Bitcoin chart updateBitcoin now at resistance level
If level break we can see good move at upside
Otherwise again going down

BTCUSD SHOWING A GOOD UP MOVE WITH 1:6 RISK REWARD BTCUSD SHOWING A GOOD
UP MOVE WITH 1:6 RISK REWARD
DUE TO THESE REASON
A. its following a rectangle pattern that stocked the market
which preventing the market to move any one direction now it trying to break the strong resistant lable
B. after the break of this rectangle it will boost the market potential for break
C. also its resisting from a strong neckline the neckline also got weeker ald the price is ready to break in the outer region
all of these reason are indicating the same thing its ready for breakout BREAKOUT trading are follws good risk reward
please dont use more than one percentage of your capitalfollow risk reward and tradeing rules
that will help you to to become a bettertrader
thank you
