BTC Reversal or still bearish (13/02/2026).BTC is trading in a parallel channel.
Major Trend :- Bearish
Minor Trend :- Range Bound.
A bearish scalp trade can be taken upto the support levels of the channel. With a SL being a candle closing above the channel.
If there are halt candle near the resistance levels and a BO occurs, a 1000 points trade in BTC can be taken and trailed upto the upper levels if the trend line resistance is also breached.
Actually, there are good targets on the upper side with good RR.
Bullish Plan
Entry :- Close above 67600
SL :- 66800
Target :- 68350, 71460.
R:R = 1:1 and 1:4.5 (considering Target 2).
As per the plan, BTC will give a double BO i.e. 20 EMA (4H) and Resistance Zone.
Wait for the price action. BTC is in a sideway to volatile zone.
Enter with a proper SL and trail target on the upper side.
On the Bearish side, there is limited targets or a scalp trade.
Happy Trading.
Bitcointrading

Perfect F&P on Bitcoins daily charts (21/01/26)Bitcoin forming good chart pattern on the daily charts.
The charts is a perfect example of a Flag and Pole pattern. If the pattern completes there are chance of seeing bitcoin dipping.
Identifying the last support around 85K. Be watchful if price dips below it.

Bitcoin and Major Cryptocurrency Trends1. Bitcoin (BTC) Trends
Price Volatility: Bitcoin remains highly volatile, with rapid short-term swings influenced by macroeconomic events, regulation, and institutional adoption.
Institutional Adoption: Increasing interest from hedge funds, banks, and corporate treasuries drives long-term bullish sentiment.
Store of Value Narrative: Often called “digital gold,” Bitcoin is increasingly seen as a hedge against inflation, especially in uncertain economic periods.
On-chain Activity: Metrics like active addresses, transaction volume, and miner activity influence price trends and market sentiment.
Regulatory Impact: Changes in government regulations, especially in the U.S., Europe, and Asia, significantly affect price movements.
Correlation with Traditional Markets: Bitcoin sometimes moves in correlation with tech stocks and risk-on assets, but also shows periods of decoupling.
2. Ethereum (ETH) Trends
Smart Contract Growth: Ethereum dominates DeFi, NFTs, and dApp development, driving demand for ETH.
Transition to Proof-of-Stake (PoS): Ethereum’s shift from PoW to PoS reduces energy consumption and may improve scalability, impacting price sentiment.
DeFi & Layer-2 Solutions: Ethereum layer-2 networks like Arbitrum and Optimism enhance transaction speed and lower fees, increasing network adoption.
EIP Upgrades: Ethereum Improvement Proposals (EIPs), especially those reducing supply (like EIP-1559), impact ETH scarcity and valuation.
3. Binance Coin (BNB) Trends
Exchange Utility: BNB remains strongly linked to Binance exchange growth, offering discounted trading fees and token burns.
Expansion in Binance Smart Chain (BSC): Growth of BSC ecosystem and DeFi projects boosts BNB demand.
4. Cardano (ADA) Trends
Focus on Scalability & Sustainability: Cardano emphasizes peer-reviewed research and energy-efficient PoS validation.
Smart Contract Ecosystem: Adoption of smart contracts and DeFi projects on Cardano gradually increases network utility.
5. Solana (SOL) Trends
High-Speed Transactions: Solana offers high throughput and low fees, making it attractive for NFTs and DeFi projects.
Network Stability Concerns: Occasional network outages affect confidence but do not entirely diminish adoption.
6. Ripple (XRP) Trends
Banking & Payment Use Case: XRP remains focused on cross-border payments and partnerships with financial institutions.
Regulatory Developments: Legal outcomes, especially in the U.S., heavily influence XRP price and adoption.
7. Stablecoins Trends
USD-Pegged Coins (USDT, USDC): Stablecoins facilitate crypto trading, DeFi lending, and hedging against volatility.
Regulatory Scrutiny: Central banks and governments are increasingly monitoring stablecoin issuance and reserves.
8. General Cryptocurrency Trends
DeFi Expansion: Decentralized finance continues to grow, creating new yield opportunities and borrowing/lending mechanisms.
NFT Market Evolution: NFTs are diversifying beyond art into gaming, music, and real-world asset representation.
Institutional & Retail Interest: Adoption grows across both retail and institutional investors, boosting market liquidity.
Regulatory Focus: Global authorities are increasingly framing cryptocurrency regulation, impacting taxation, exchanges, and investor protection.
Layer-2 & Scaling Solutions: Technologies like Lightning Network (Bitcoin) and Ethereum L2s reduce transaction costs and improve scalability.
AI and Blockchain Integration: Emerging trend where AI analytics and blockchain-based data management intersect, creating innovative investment and utility models.

BITCOIN BACK TO 109K..... Bell is ringing....Through my analysis, weekly shows firm bullish.
Geo political uncertainty all over the world because venezuela president capture.
Join this with weekly bias leads to lot of upward momentum.
Bos happened in daily timeframe with good price momentum.
So the next resistance is 97k and then to 109k.
Mark my words it will reach in one or two weeks .
The ball and bat is in perfect place , SWING is guys.....
No regrets......

How Funds Actually Make Money From Bitcoin📰 I’ve followed financial markets long enough to notice a strange paradox:
spend more than five minutes scrolling Crypto TikTok (YouTube or X isn’t much different), and you’d think the entire crypto market is run by a few whale clicks and a handful of flashy headlines.
You’re constantly told that:
📉 Someone is “buying the dip”
📈 Someone else is “selling the top”
🐋 And a major institution is “deciding the fate of the market”
It sounds reasonable.
But in reality… it’s far more complex than that.
📣 I’ve watched hundreds of videos like these. The script is always the same.
Glossy thumbnails, rushed voices, and absolute statements:
“BlackRock is buying — PRICE IS GOING UP!”
“Whales are selling — THE MARKET IS ABOUT TO CRASH!”
“Institutional money is here!!!”
🎭 But beneath the drama, what’s really there?
No nuance. No structure. And almost no understanding of how institutions actually make money.
🔍 Here’s the truth I’ve learned after years of observing the markets:
Whether BlackRock buys or sells Bitcoin has very little to do with you.
Large funds don’t trade on emotion, nor do they survive by predicting direction like retail traders do.
They don’t need Bitcoin to go up.
They don’t need Bitcoin to go down.
🎯 What they need is volatility — calculated, measured, and modeled.
🧠 This is the part most TikTok content completely ignores.
A fund can buy Bitcoin and at the same time:
🛡️ Hedge 100% of its risk
⚖️ Stay delta-neutral
📊 Maintain a neutral market view
🔒 Be protected against both upside and downside moves
👉 For them, buying BTC is not a gamble.
It’s simply the first layer of a multi-leg trading structure.
What matters isn’t how much they buy,
but what comes next — the steps most retail traders have never even heard of.
📉📈 I often ask myself:
Why do so many “TikTok analysts” talk about institutions every day, yet never mention delta, gamma, hedging, or basis?
The answer is simple:
👉 Because they don’t understand it.
If someone:
screams “bullish” and “bearish” in every video
believes institutions are “pumping prices”
but can’t explain delta-neutral hedging
then their opinion on what BlackRock is “doing” has no analytical value.
📊 To really understand this, let’s look at how a fund actually makes money.
Assume Bitcoin is trading at $100,000.
The fund doesn’t care whether price goes up or down.
They deploy a neutral options structure, betting on volatility , not direction.
When price rises:
they sell part of the position to rebalance risk
profit comes from selling at higher levels
When price falls:
they buy back at lower prices
profit comes from buying cheaper
🔁 Price up → sell high
🔁 Price down → buy low
👉 Repeat. With discipline. Without emotion.
This is gamma scalping — the quiet, persistent profit engine behind institutional trading.
💰 So where does their real profit come from?
Not from news.
Not from influencers.
Not from ETF headlines.
It comes from:
continuous hedge adjustments
realized volatility exceeding expectations
direction-neutral structures
strict mathematical discipline
⛔ The rare moment they struggle?
When the market… doesn’t move at all.
🧭 And here’s what I want to say to you directly, as a market professional:
You are not BlackRock.
You don’t have their infrastructure.
You don’t have their capital, speed, or risk models.
👉 Trying to predict or mimic their actions won’t make you a better trader — it will only make you more confused.
✍️ My conclusion is very clear:
Watching what large funds do without understanding the structure behind it
is the fastest path to losses.
BlackRock doesn’t trade narratives.
They don’t trade emotions.
And they certainly don’t trade TikTok stories.
🎯 They trade structure.
And you?
Stop watching what they do.
Start understanding what you should do.
That’s the difference between surviva l and being washed out by the market.
PS: BlackRock and TikTok are used purely as illustrative examples.

Bat is real bat hahahaBINANCE:BATUSD
whale want to draw real bat picture 😅
all information in chart image.
please do your own research before taking any trade.
i am not financial advisor
risk is real stay practical
please feel free to ask any questions

BTCUSD Liquidity Sweep Setup Before Bearish ContinuationBTCUSD Liquidity Sweep Setup Before Bearish Continuation
Overview
BTCUSD continues to display persistent downside pressure across the mid-term structure. Price action on the 3H timeframe shows a sequence of lower highs and lower lows, reflecting sustained bearish control. Despite short periods of stabilization, the overall market environment remains distribution-driven.
Market Structure
Recent price behavior confirms multiple break-of-structure (BOS) events, each reinforcing the broader downward momentum. Every attempt at upward expansion has been met with supply absorption, indicating that buyers are failing to regain initiative. The consolidation developing in the current region suggests an accumulation of short-term liquidity, but without structural evidence of reversal.
Supply & Liquidity Context
Price is positioned directly beneath a key supply zone highlighted on the chart. This zone remains unmitigated and acts as the primary area where counter-trend reactions are likely to be absorbed. The tightening range beneath this level indicates liquidity buildup, commonly preceding engineered sweeps by institutional players.
The current model suggests that the market may execute a short-term liquidity run above local highs before resuming its downward trajectory. Such a move would align with previous behavior in this trend cycle, where short-term rallies were primarily used to deliver liquidity into higher-timeframe supply.
Downside Expansion Risk
Should the market complete a liquidity sweep into the supply zone, the next phase of downside continuation becomes probable. The structural projection on the chart anticipates a revisiting of the lower demand region around 74,300 – 75,000, an area aligning with previous inefficiencies and untested demand.
This target supports the continuation of the broader bearish structure unless a significant shift in order flow emerges.
Summary
BTCUSD remains positioned within a well-defined bearish cycle, characterized by repeated structure breaks and unmitigated supply zones controlling price. Current compression suggests the market is preparing for another liquidity-driven move. Unless buyers regain structure above the key supply region, the market retains a high probability of extending toward lower demand zones.

BTC # Bitcoin Free fall still pending....Here as per critical box range trading btc bitcoin can free fall if it breaks below . And ot will try to sweep stoplosses of previous weekly low. As marked in chart you can notice this easily that how btc can free fall to hunt more stop losses.
So trade accordingly to see weather it only hunts stop losses and reverses or it will take a continuous fall.

BLOOD BATH IN BITCOIN Bitcoin is going to crash within 1/2 days only if sustains below 106,400 USD. We can plan for sell side after closing below the level. CRYPTO:BTCUSD . Mark the level and simple wait for the confirmation.

Why Longs Blew Up in the Great $19B Liquidation?Hello Traders!
Recently, crypto markets witnessed one of the biggest shakeouts in history, a $19 billion liquidation that wiped out long traders across Bitcoin, Ethereum, and altcoins in just a few hours.
Everyone called it a “crash,” but what really happened was a classic case of leverage, greed, and poor risk management colliding. Let’s break down the truth behind it.
1. Excessive Leverage Builds the Trap
During bullish phases, traders pile into long positions with 25x, 50x, or even 100x leverage.
The higher the leverage, the smaller the move needed to wipe you out.
Even a 1–2% drop in price can liquidate millions worth of positions instantly.
When too many traders are leveraged in the same direction, the market becomes top-heavy and unstable.
2. Liquidity Hunt – The Smart Money Move
Big players know where the retail stop losses and liquidation points sit, usually below obvious support levels.
They push price just far enough to trigger those liquidations.
Once the forced selling begins, it cascades, creating a chain reaction that accelerates the fall.
It’s not manipulation; it’s how liquidity flows work in leveraged markets.
3. The Domino Effect of Liquidations
When one big position gets liquidated, it triggers auto-sell orders.
Those sells push prices lower, causing more positions to get liquidated.
In minutes, you see billions vanish as exchanges auto-close overleveraged longs.
That’s exactly what created the $19B wipeout, a domino collapse fueled by forced exits.
4. How to Avoid Becoming the Next Victim
Use leverage only if you can handle losing that position completely.
Keep your stop loss and margin buffer wide enough to survive small swings.
Never risk more than 1–2% of your account on a single trade.
And most importantly, don’t chase FOMO entries near resistance levels.
Rahul’s Tip:
Leverage isn’t evil, greed is .
The same tool that builds accounts can destroy them if used recklessly.
In crypto, survival is the real skill, because only survivors get the next bull run.
Conclusion:
The Great $19B liquidation was not random, it was the market teaching a painful lesson about leverage and discipline.
If you want to last long in this game, learn to respect risk before chasing reward.
If this post helped you understand what really happened, like it, share your view in comments, and follow for more realistic market breakdowns!
How Liquidity Zones in Forex Mirror in Bitcoin Markets?Hello Traders!
If you’ve studied liquidity concepts in Forex trading , you might’ve noticed how similar they behave in the crypto market , especially in Bitcoin.
Both markets are driven by liquidity and order flow, not random price movements.
Let’s understand how these two worlds mirror each other and how you can use that knowledge to trade smarter.
1. What Are Liquidity Zones?
Liquidity zones are price areas where a large number of orders are placed, stop losses, buy/sell limits, or pending entries.
Institutions and big players target these zones to execute their large positions with minimal slippage.
That’s why price often “hunts” highs or lows before the real move starts.
2. Liquidity Behavior in Forex
In pairs like EUR/USD or GBP/USD, liquidity often builds near session highs and lows.
Smart money pushes price to these zones to trigger retail stops and grab liquidity.
Once liquidity is collected, the market usually reverses in the opposite direction.
3. The Same Psychology in Bitcoin
Bitcoin may not be a currency pair, but it runs on the same emotional patterns, fear, greed, and impatience.
Liquidity clusters near obvious highs/lows, round numbers (like $60,000 or $50,000), and breakout points.
Big players hunt these zones in the same way as in Forex, because crypto markets are even more sentiment-driven.
4. How to Identify These Zones on BTC Charts
Mark previous day’s highs and lows, these are classic liquidity targets.
Check where price made impulsive moves in the past; those areas often have resting orders.
Look for quick “fakeouts” beyond these levels followed by strong rejection, a sign liquidity was grabbed.
5. How to Trade the Mirroring Pattern
Wait for liquidity grab candles (spikes above/below key levels).
Enter on confirmation of reversal (engulfing or pin bar).
Place stops beyond the liquidity wick and target the next range midpoint.
Rahul’s Tip:
Whether it’s Forex or Bitcoin, the chart structure changes, but human behavior doesn’t .
If you understand how liquidity works in one market, you can easily read the traps in another.
Conclusion:
Liquidity is the universal language of smart money.
The same tricks used in Forex, fakeouts, stop hunts, and reversals, repeat daily in Bitcoin charts.
Once you learn to spot them, you’ll see that both markets are mirrors of each other in how they trap and move traders.
If this post helped you see the connection between Forex and Bitcoin, like it, drop your view in comments, and follow for more deep market insights!
Midcap Multi-Bagger Moves in Trading1. Understanding Midcap Stocks
Midcap stocks generally refer to companies with a market capitalization ranging between ₹5,000 crore to ₹20,000 crore (or $500 million to $5 billion) depending on the market. They strike a balance between stability and growth potential:
Large-cap stocks are stable but slow-growing.
Small-cap stocks offer high growth but come with extreme volatility.
Midcap stocks combine growth potential with manageable risk, making them ideal candidates for multi-bagger moves.
Midcaps are often in the growth phase of their lifecycle. They have proven business models but are not yet fully recognized by institutional investors. This under-representation creates opportunities for early investors to gain extraordinary returns.
2. Characteristics of Midcap Multi-Bagger Stocks
Not all midcap stocks become multi-baggers. Successful midcap multi-baggers usually share some common characteristics:
Strong Revenue and Earnings Growth: Companies showing consistent growth in revenue and net profits, often higher than industry averages.
Scalable Business Model: Ability to expand operations, enter new markets, or increase product offerings without proportionally increasing costs.
Innovative Products/Services: Midcaps introducing unique products or services that create market disruption.
High Return Ratios: Consistently high ROE (Return on Equity) and ROCE (Return on Capital Employed) indicate efficient use of capital.
Low Debt Levels: Companies with manageable debt can reinvest profits into growth rather than servicing loans.
Institutional Recognition: Gradual interest from mutual funds and large investors often acts as a catalyst for price appreciation.
3. Factors Driving Multi-Bagger Moves
The movement of midcap stocks into multi-bagger territory is driven by a combination of fundamental, technical, and macroeconomic factors:
a) Fundamental Drivers
Profitability Expansion: Companies increasing margins due to operational efficiency, technology adoption, or scale benefits.
Sectoral Tailwinds: Industries experiencing high demand, regulatory support, or government incentives (like IT, renewable energy, pharmaceuticals).
Market Share Gains: Companies successfully capturing competitors’ market share through innovation or cost leadership.
b) Technical Drivers
Breakout Patterns: Price movements above historical resistance levels often attract momentum traders.
Volume Expansion: Rising volumes signal genuine investor interest and reduce liquidity concerns.
Institutional Accumulation: When large investors buy in gradually, it supports price stability and long-term uptrend.
c) Macroeconomic Factors
Economic Growth: Midcaps benefit more in a growing economy due to scalability and higher discretionary spending.
Policy Support: Favorable government policies like Make in India, tax incentives, or industry-specific reforms accelerate growth.
Liquidity Conditions: Low-interest rates and higher retail participation often drive up stock prices, including midcaps.
4. Strategies to Identify Midcap Multi-Baggers
Investors employ multiple strategies to identify potential midcap multi-baggers:
Fundamental Analysis:
Analyze balance sheets for revenue and profit growth.
Assess profitability ratios like ROE, ROCE, and profit margins.
Check debt-to-equity ratios and cash flows.
Sectoral Analysis:
Identify industries with high growth potential.
Look for midcaps within these sectors that are leaders or emerging leaders.
Technical Screening:
Use moving averages, trend lines, and volume indicators to spot breakout stocks.
Identify consolidation patterns that precede a rally.
Growth vs. Valuation Analysis:
A true multi-bagger is often undervalued relative to its growth potential.
Metrics like PEG ratio (Price/Earnings to Growth) can be useful.
Tracking Promoter Holding and Insider Buying:
Increasing promoter confidence is often a precursor to stock price appreciation.
Macro Awareness:
Be aware of government initiatives, economic cycles, and sector-specific reforms.
5. Risks Associated with Midcap Multi-Baggers
While midcap multi-baggers are enticing, they come with risks that every trader should be aware of:
Volatility: Prices can fluctuate dramatically due to low liquidity.
Market Sentiment: Negative news or global macro events can disproportionately impact midcaps.
Execution Risk: Companies may fail to scale operations efficiently, leading to missed expectations.
Overvaluation Risk: During bull markets, midcaps often get overvalued, leading to corrections.
Regulatory Risk: Policy changes can affect midcap companies more than established large-cap firms.
Risk management strategies like stop-loss orders, portfolio diversification, and position sizing are crucial to protect capital.
6. Trading Approaches for Midcap Multi-Baggers
There are multiple ways to approach midcap multi-bagger stocks in trading:
a) Long-Term Investment (Buy & Hold)
Buy fundamentally strong midcaps with multi-bagger potential.
Hold through market volatility to realize exponential gains over 3-5 years.
b) Momentum Trading
Focus on midcaps showing breakout patterns, high relative strength, and institutional buying.
Enter during upward trends and exit once momentum weakens.
c) Swing Trading
Identify short-term price oscillations in fundamentally strong midcaps.
Capitalize on price swings while limiting exposure to prolonged downturns.
d) Options Strategies
Use call options to leverage returns with limited capital in highly promising midcap stocks.
Protective puts can hedge against unexpected downtrends.
7. Case Studies of Midcap Multi-Baggers
Several midcap companies in India and globally have delivered exceptional returns:
Bajaj Finance (India) – Evolved from midcap to large-cap, delivering 10x+ returns over a decade.
Page Industries (India) – Niche player in textiles, achieved multi-bagger status due to consistent growth.
Eicher Motors (India) – Benefited from strong product positioning and market share gains.
Case studies highlight the importance of timely investment, research, and patience in reaping multi-bagger benefits.
8. Tips for Retail Traders
Diversify: Avoid putting all capital into one midcap stock.
Focus on Fundamentals: Short-term volatility may be high, but strong fundamentals increase multi-bagger chances.
Monitor Trends: Follow market news, sector growth, and macroeconomic indicators.
Patience is Key: Multi-bagger moves often take 3–7 years to materialize.
Avoid Herd Mentality: Don’t chase stocks just because they are trending; focus on research-based picks.
Conclusion
Midcap multi-baggers represent a unique opportunity for traders and investors willing to balance risk and reward. These stocks lie at the intersection of growth, innovation, and market inefficiencies. While identifying them requires a combination of fundamental research, technical analysis, and macroeconomic awareness, the potential rewards can be extraordinary. By understanding the drivers, risks, and strategies involved, traders can position themselves to benefit from the transformational wealth creation that midcap multi-baggers offer.
The world of midcap trading is not for the faint-hearted, but for disciplined investors with a growth mindset, it can be the playground of extraordinary returns.
Bitcoin – Let’s Play the Resistance Game at 114,500Bitcoin on the 1-hour chart has entered a critical resistance zone around 114,200–114,500. Price has rallied strongly from the recent lows near 113,000, but now faces a major supply area. The structure suggests that BTC could face rejection here and move back toward the support zone near 112,600 if sellers step in.
As long as price stays below 114,500, this resistance remains valid. A clean breakout above this level with strong momentum would invalidate the bearish view and open the path for higher levels. On the downside, holding support near 112,600 will be key for buyers to maintain control.
Disclaimer: This analysis is for educational purposes only and should not be taken as financial advice. Please do your own research or consult your financial advisor before investing.
Analysis By @TraderRahulPal (TradingView Moderator) | More analysis & educational content on my profile
👉 If you found this helpful, don’t forget to like and follow for regular updates.

BTC Crashes to 3-Week Low: A True Nerve Test for TradersHello fellow traders, Bitcoin has entered an extremely tense phase!
BTC has slipped below 109,000 USD, marking its lowest point in three weeks. The main pressure comes from the looming expiry of a massive 22-billion-USD options contract at the end of the month, which is driving strong short-term selling.
On the daily chart, prices keep getting rejected at the downtrend line and the Ichimoku cloud, confirming that bears still hold the upper hand.
The current scenario points to further downside, with key support zones at 104,000 USD (TP1) and 98,900 USD (TP2).
These are the critical “do-or-die” levels to watch closely — only if BTC manages to hold above them can we expect a recovery once the options-driven selling pressure eases.
In short: Bitcoin is at a make-or-break moment. Traders, keep your stops tight and stay alert!

ETHUSDT: Strong Uptrend with Solid SupportETHUSDT is currently experiencing a strong uptrend driven by the stability of the cryptocurrency market and strong fundamental factors. Despite some recent pullbacks, the primary trend remains bullish, supported by a solid foundation and positive investor sentiment.
Technical Analysis: ETHUSDT is currently testing a key support level at 3,985. If this level holds, there is a high probability of a rebound and continued upward momentum. The next resistance level is expected at 4,215.
Trading Strategy: If the price stays above the support level at 3,985, ETH is likely to continue rising towards the next resistance levels.
Outlook: Given the current fundamentals and technical indicators, ETHUSDT is likely to maintain its upward trajectory and target the 4,215 resistance level in the near future.

BTC/USD: Bearish Trend After Flash Crash and Key NewsThe BTC/USD chart shows a strong bearish trend following the "flash crash" event and contract liquidations. Currently, BTC is moving within a downward channel with support levels at 110,300 USD and 108,000 USD.
News Impact:
Morgan Stanley to Offer Crypto Trading: Morgan Stanley’s partnership with Zerohash to provide crypto trading on E*Trade could boost cryptocurrency acceptance, but it's not enough to reverse the bearish trend in BTC.
Fed Chairman Jerome Powell on Interest Rates: Jerome Powell's statements regarding the possibility of maintaining high interest rates have increased uncertainty, negatively impacting the cryptocurrency market.
Conclusion: The bearish trend of BTC/USD may continue. Traders should pay attention to support levels and stay updated with economic news to make informed trading decisions.

BTC/USD Eyeing Breakout Toward $121.5K – Supply Zone Retest ?Current Price: ~$119,872 showing consolidation just above the 0.618 Fibonacci retracement level.
Structure: Price has bounced from the supply zone (~118.4K–118.6K) and is currently pushing upward.
Ichimoku Cloud: Price is trading within a cloud breakout attempt, indicating potential bullish momentum.
Fair Value Gaps (FVG): Two unfilled FVGs above suggest liquidity targets at ~$120.6K and ~$121.5K.
Support Levels:
Strong Support: ~$115.8K–116.5K.
Local Supply Zone Support: ~$118.4K.
Target: Main upside target sits at $121,533, aligning with a prior high and liquidity pool.
Trade Plan (Long Setup):
Entry: $119,700 – $119,900 (current consolidation zone)
Stop Loss: Below $118,400 (below supply zone)
Take Profit 1: $120,600 (first FVG target)
Take Profit 2: $121,533 (major resistance/liquidity target)
Risk/Reward Ratio: ~2.8
Notes: Wait for a bullish confirmation candle or 1H close above $119,900 before entering. Avoid chasing if price spikes without retest.
This plan follows the chart’s bullish structure and aims to ride the move into the untested liquidity areas above.
If you want, I can also give you a short scenario plan in case price rejects here. That would make this a full two-way trade setup.

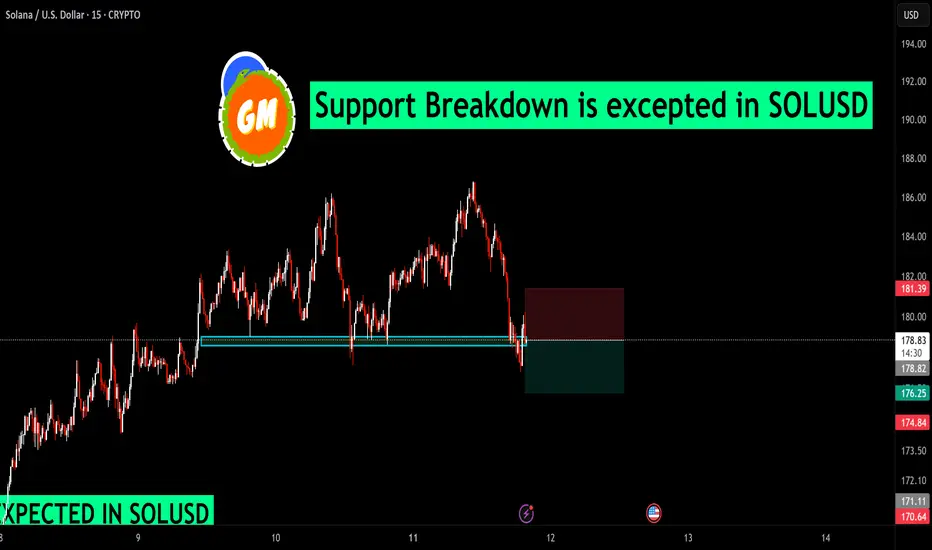
Support Breakdown is excepted in SOLUSDSOLUSD has breached a key support zone around the $178–$179 level, turning the area into potential resistance. Price action shows repeated rejections near this zone, followed by a decisive breakdown on strong bearish momentum.
If sellers maintain pressure below this level, further downside towards $175 and $171 could be on the cards. A sustained recovery back above $179 would be needed to invalidate the bearish outlook.
📉 Bias: Bearish below $179
🎯 Targets: $175 – $171
BTCUSD - Consolidation Breakout & RetestBitcoin has successfully broken out of its consolidation zone on the 15-minute chart. After a strong breakout above the horizontal resistance, we are now seeing a textbook retest of the breakout level, which may act as a fresh support.
✅ Bullish confirmation if price sustains above the breakout zone
📍 Resistance turned support at ~118,700
🎯 Upside momentum likely to continue if this retest holds

Options Trading vs Stock Trading👋 Introduction
If you've ever stepped into the world of the stock market, chances are you've heard about both stock trading and options trading. While they both exist under the umbrella of equity markets, they are fundamentally different beasts.
Imagine stock trading like buying a house — you own the asset. In contrast, options trading is like paying a small amount to rent the house with the option to buy it later — you get access, flexibility, and leverage, but also more complexity and risk.
In this guide, we’ll break it down in simple language, so you can understand:
What each involves
How they work
Risks vs rewards
Which one suits your trading style
📌 1. What Is Stock Trading?
Stock trading involves buying and selling shares of publicly listed companies on the stock exchange.
Example:
You buy 10 shares of TCS at ₹3,500, totaling ₹35,000. If the price rises to ₹3,800, and you sell, you make a ₹3,000 profit.
Key features:
Ownership: You become a partial owner of the company
No expiry: You can hold stocks forever
Dividends: You may earn income from dividends
Capital appreciation: Profit is made when price rises
Lower complexity: Ideal for beginners
📌 2. What Is Options Trading?
Options trading involves buying and selling contracts (not shares directly), that give you the right (but not the obligation) to buy or sell a stock at a specific price before a set date.
There are two main types of options:
Call Option: Betting that the price will go up
Put Option: Betting that the price will go down
Each contract typically covers 1 lot (e.g., 25 shares) of a stock or index.
Example:
You buy a Reliance 2800 Call Option for ₹50, and each lot = 250 shares. Your total cost = ₹12,500. If Reliance goes above ₹2800 and the premium rises to ₹100, you earn ₹12,500 profit.
Key features:
Leverage: Small capital, large exposure
Limited time: All options have expiry dates (weekly/monthly)
No ownership: You control a right, not the actual stock
Higher risk: Gains can be huge, losses can be total
Advanced strategy: Better for experienced traders
💥 3. Risk-Reward Trade-off
Stock Trading:
Lower volatility: Stock prices move gradually
Better for long-term wealth
Risk is limited to the price going down, but you still own the stock
Options Trading:
High leverage = high reward, high risk
Option premiums can decay rapidly due to time decay (theta)
Entire premium can become zero at expiry
Can be used for hedging or speculation
🧮 4. Margin & Capital Requirements
Stock Trading:
You pay the entire value of the stock upfront (unless using margin facilities)
Brokers may offer 5x margin for intraday, but that’s separate
Options Trading:
Option buyers pay only the premium
Option sellers (writers) require huge margin due to unlimited loss potential
Can start with as low as ₹500–₹5,000 per trade
🧠 5. Who Should Trade What?
You Are Prefer Stock Trading Prefer Options Trading
Beginner ✅ Yes ❌ No (unless trained)
Short-term trader ✅ Yes ✅ Yes
Investor ✅ Yes ❌ Not ideal
Hedger ❌ No ✅ Yes
Speculator ❌ Less ideal ✅ Perfect
🔁 8. Time Decay – The Invisible Killer in Options
One key concept in options is time decay (theta). As expiry nears, the premium loses value even if the stock doesn’t fall.
If you're long in options and your view is wrong or delayed, your option can become worthless.
Stock trading has no such concept — the price remains based on fundamentals and demand-supply.
🧮 6. Strategies Comparison
📈 Stock Trading:
Buy and Hold
Swing Trading
Intraday
🧩 Options Trading:
Buy Call / Buy Put (directional)
Sell Options (income)
Straddle / Strangle (neutral)
Iron Condor / Butterfly (advanced)
🧭 7. Regulatory Perspective
SEBI has increased margin requirements for option sellers due to high risk.
Recent data shows that:
90%+ retail option buyers lose money
85%+ option sellers make money, but require capital and strategy
Stock traders lose less on average, but make smaller % gains
💬 8. Psychological Factor
Stock trading is slower and requires patience
Options trading is fast, intense, and emotional — often leading to impulse trading
You must develop:
Strong discipline
Risk management
Understanding of Greeks (for options)
📚 9. Learning Curve
Area Difficulty (1 to 10)
Stock Trading 3–5
Options Trading 7–9
Options involve:
Understanding of strike prices, expiry, premium, Greeks (delta, theta, vega, gamma)
Quick decision-making under pressure
Multiple possibilities with the same price movement
Retail Trading vs Institutional Trading👋 Introduction
When we hear the term "trading," we often imagine someone sitting in front of a laptop buying and selling stocks — maybe even like you or me. But not all traders are the same.
There are two major types of traders in the stock market:
Retail Traders – Individual investors like students, salaried professionals, or small business owners.
Institutional Traders – Large organizations like mutual funds, hedge funds, pension funds, foreign investors, and banks.
Both operate in the same market but with very different tools, access, size, and influence.
Let’s break down the major differences between retail and institutional trading in a way that’s easy to understand and helps you think smarter as a trader.
📌 Who is a Retail Trader?
A retail trader is any individual who trades with personal money, not on behalf of others. These are regular people using platforms like Zerodha, Groww, Upstox, Angel One, etc.
Characteristics of Retail Traders:
Trade in small quantities
Use mobile apps or online platforms
Rely on technical indicators, news, social media, or trading courses
Face capital limitations (often under ₹1–5 lakhs or ₹10–20 lakhs for advanced ones)
Emotional decisions often play a bigger role
Impact on stock price is minimal due to small size
📌 Who is an Institutional Trader?
An institutional trader represents large financial institutions. They trade on behalf of clients, funds, or corporations with capital often running into crores or billions of rupees.
Examples:
FII (Foreign Institutional Investors)
DII (Domestic Institutional Investors)
Mutual Fund Houses (SBI MF, HDFC MF, ICICI Pru MF)
Insurance Companies (LIC)
Hedge Funds, Sovereign Funds, Investment Banks
Characteristics:
Trade in very large quantities (thousands to millions of shares)
Have dedicated research teams
Use high-frequency trading (HFT), algorithmic strategies, and block deals
Get priority access to stock allotments (like IPO anchor portions)
Influence stock prices due to their massive capital movements
🧠 How They Trade Differently
🔹 1. Entry Strategy:
Retail Trader: Buys based on chart breakout, news, or gut feeling.
Institutional Trader: Analyzes cash flow, management calls, macro factors, and even global risk.
🔹 2. Position Size:
Retail: Buys 10, 100, or 500 shares.
Institutional: May buy 1,00,000+ shares — sometimes slowly (accumulating) to avoid moving the price.
🔹 3. Holding Period:
Retail: Intraday, swing (few days), or positional.
Institutional: Depends — could be intraday (quant funds), quarterly, or multi-year holdings (pension funds).
🔹 4. Leverage:
Retail: Gets margin from broker, usually limited.
Institutional: Gets much larger and cheaper margin, due to strong balance sheets.
🔥 How Institutions Shape the Market
When a large FII like Vanguard or BlackRock enters or exits a stock, price reacts immediately. For example:
If FIIs buy ₹5000 crore worth of Infosys, it shows strength and attracts more buyers.
If Mutual Funds dump shares of Zomato in bulk, retail may panic and sell too.
So, institutions often act as market movers.
📈 Why Institutional Traders Perform Better (Generally)
They have teams of analysts, economists, risk managers
They avoid emotional mistakes — no panic buying or selling
They use models and simulations
They manage risk per trade very strictly
They get real-time global economic feeds
🙋 Why Do Retail Traders Lose More Often?
Studies show that over 85–90% of retail traders lose money, especially in F&O (Futures and Options). Why?
Lack of discipline – No stop-loss, random trading
Over-trading – Multiple trades a day without edge
Chasing news / tips – Not building conviction
No risk management – Betting all capital in one stock
Emotional trading – Fear & greed override logic
Meanwhile, institutions focus on:
Risk-to-reward
Long-term trends
Diversification
Hedging
Structured research
🛡️ Can Retail Traders Compete?
Yes — with proper knowledge and discipline.
Retail traders have some advantages too:
More flexibility: Can enter and exit faster due to small size
No committee pressure: Don’t answer to bosses or clients
Niche strategies: Can trade small-cap momentum where institutions avoid
Learning access: With internet, any trader can learn smartly today
🏁 Final Words: Use Institutional Moves to Your Advantage
Even if you’re a retail trader, you can follow institutional activity:
Track FII/DII flows daily (available on NSE)
Follow bulk/block deals
Use tools like Trendlyne, Screener, Moneycontrol to see where funds are buying/selling
Use this information to align your trades with "smart money", and avoid standing against institutional trends.
Institutional Option Trading🏛️ Institutional Option Trading
Institutional Option Trading refers to how large financial institutions like hedge funds 📊, investment banks 🏦, insurance firms 🧾, and asset managers 💼 use options contracts strategically to hedge risks, generate income, or make large, leveraged bets with controlled risk.
These institutions trade options using:
🧠 Advanced analytics & algorithms
📉 Volatility-based strategies (like straddles, condors, and spreads)
📊 Risk-neutral positioning using Greeks (Delta, Vega, Theta, etc.)
🛡️ Portfolio hedging & macroeconomic plays
💼 Multi-million dollar contracts with custom structures
Their trading is not based on emotions, but on probabilities, risk-reward analysis, and long-term objectives.
📌 In simple words:
Institutional Option Trading is how big players use options smartly to manage risk and extract value — with precision, scale, and professional tools. 💼⚙️📈

Small Account Scalping / Challenge Trading🔍 What is Small Account Scalping?
Scalping means taking very short, quick trades — entering and exiting the market in a matter of seconds to a few minutes — to capture small price moves.
Now combine this with a small account — typically ₹1,000 to ₹10,000 (or $100 to $500). You're looking at a trading style where:
Tiny profits are taken quickly
High discipline and speed are critical
Risk-to-reward ratios are tight
Compounding is the core idea (small wins stack up)
Scalping with a small account is not just about earning big money quickly — it's often done as a "challenge" to prove skill, build discipline, or simply to show that trading isn’t about how much money you have, but how well you manage it.
🎯 What is Challenge Trading?
Challenge Trading is when a trader publicly sets a goal, like:
Turning ₹5,000 into ₹50,000
Growing $100 to $1,000 in 30 days
Doubling capital in 10 trades
These challenges are usually:
Documented daily (on YouTube, Telegram, or Instagram)
Done with full transparency
Focused on scalping or intraday setups
Built around strict rules and money management
Why do people do it?
For credibility
To learn discipline
To inspire beginners
To prove skill without needing big capital
📉 Why Most Traders Fail with Small Accounts
Let’s be honest — 90% of small account traders blow their capital within days or weeks.
Here’s why:
1. Overleveraging
Trying to turn ₹1,000 into ₹5,000 in one day? Most traders overtrade, use max quantity, and take unnecessary risks.
2. No Risk Management
They don’t respect stop-losses. One bad trade wipes 50% or more of their account.
3. Emotional Trading
Small capital = High emotions. Losing ₹300 from ₹1,000 hurts more than ₹3,000 from ₹1,00,000.
4. No Consistency
They jump from strategy to strategy. From breakout trading to option buying to indicator-based setups — nothing sticks.
5. Trying to Get Rich in One Day
Small accounts are not magic lamps. Trying to “flip money” quickly always backfires without a strong base strategy.
✅ How to Actually Win at Small Account Scalping
Let’s now focus on how to do it right — step by step.
✳️ Step 1: Choose the Right Market Instrument
For scalping with small capital, you want:
High liquidity (easy entries & exits)
Fast movement
Low capital requirement
Some good choices:
Index options like Nifty/BankNifty Weekly
FinNifty (Tuesday expiry)
Micro lots in Futures (if margin allows)
USDT/INR scalping on crypto exchanges (Binance, CoinDCX)
Stocks like Reliance, Tata Motors, SBIN – but be cautious
Avoid:
Illiquid stocks
High lot-size contracts
Multi-leg option strategies with high cost
✳️ Step 2: Pick a Scalping Setup That Works
You don’t need 10 strategies. Just 1-2 that work well on a small timeframe.
Examples:
Breakout on 1-min chart
Mark consolidation
Wait for breakout candle with volume
Enter with tight SL, book in 1:1.5 or trail
VWAP Rejection Entry
Wait for price to test VWAP
If rejected, enter in the opposite direction
Small risk, quick reward
Fakeout Trap
Market fakes breakout → reverses
Enter with confirmation of reversal
Common in BankNifty scalping
News-Based Scalping
RBI decisions, GDP data, Budget day
Extreme volatility → use strict stop-loss
✳️ Step 3: Master Position Sizing
Golden rule: Never lose more than 2-3% in one trade.
With ₹2,000 capital:
Risk max ₹40–₹60 per trade
Use option buying, not futures
Focus on quantity control
If you're using 50% of capital in one trade, you’re doing it wrong. That’s not scalping — that’s gambling.
✳️ Step 4: Use a Simple Tool Setup
Keep your charts clean.
Timeframe: 1-min or 3-min
Indicators: VWAP, EMA (9 or 20), Volume
Levels: Draw basic support/resistance
Avoid: Overloaded charts with 6 indicators
✳️ Step 5: Take Only 1–3 Trades a Day
In small account scalping, overtrading kills faster than losing.
Max 3 trades per day
Win 2 out of 3 = Green Day
Lose 2 = Stop trading
Stick to the plan. Live to trade another day.
✳️ Step 6: Focus on % Growth, Not ₹ Profit
Don’t compare yourself to traders making ₹20K/day
If you make ₹150 on ₹2,000 → that’s 7.5% gain
Make 5% a day for 20 days = 100% monthly compounding!
Small wins matter. They build discipline, confidence, and capital.
🧠 Psychology Behind Challenge Trading
To win the small account game, your mindset matters more than your strategy.
Mental Rules:
Treat every rupee as if it’s ₹1,000
Never chase revenge trades
Accept red days calmly — they’re part of the game
Celebrate consistency more than profit
📌 Tracking Your Progress
Make a Trading Journal:
Entry/Exit time
Setup used
Why you entered
How you felt
Profit/Loss
Over 30 days, this builds emotional and strategic control.
🚫 Mistakes to Avoid in Small Account Scalping
❌ Averaging in loss
❌ Trading without stop-loss
❌ Copying random Telegram tips
❌ Overtrading after losses
❌ Ignoring brokerage and slippage
❌ Expecting daily profits
🏁 Final Words: Is Small Account Scalping Worth It?
✅ YES — if:
You want to build confidence and discipline
You want to master trading with risk management
You like fast-paced, quick decision-making
❌ NO — if:
You’re in a hurry to make big profits
You trade emotionally
You don’t journal your trades or follow structure
It’s a journey — not a race.
With patience and process, your ₹2,000 account can one day fund your ₹2 Lakh trading journey.