BITCOIN SETUP TRADE WIH 1:5 RISK REWARDBITCOIN SETUP TRADE WIH 1:5 RISK REWARD
A good selling setup detected on BTCUSD
It's showing a BEAR MOVE due to these reason
1. It's following THE 60 M trendline here
2. It's ready to break the neckline
3. In day chat it's showing the heavy bearish pressure
Just grab out will your own risk
With a small amount
Stay connected
Stay happy
Bande mataram
BITCOIN SETUP TRADE WIH 1:5 RISK REWARD
A good selling setup detected on BTCUSD
It's showing a fall due to these reason
1. It's following THE 60 M trendline here
2. It's ready to break the neckline
3. In day chat it's showing the heavy bearish pressure
Just grab out will your own risk
With a small amount
Stay connected
Stay happy
Bande mataram
Bitcointrading

BITCOIN SETUP TRADE WIH 1:5 RISK REWARDBITCOIN SETUP TRADE WIH 1:5 RISK REWARD
A good selling setup detected on BTCUSD
It's showing a BULL MOVE due to these reason
1. It's following THE 60 M trendline here
2. It's ready to break the neckline
3. In day chat it's showing the heavy bullish pressure
Just grab out will your own risk
With a small amount
Stay connected
Stay happy
Bande mataram
BITCOIN SETUP TRADE WIH 1:5 RISK REWARD
A good selling setup detected on BTCUSD
It's showing a BULL MOVE due to these reason
1. It's following THE 60 M trendline here
2. It's ready to break the neckline
3. In day chat it's showing the heavy bullish pressure
Just grab out will your own risk
With a small amount
Stay connected
Stay happy
Bande mataram

BITCOIN SETUP TRADE WIH 1:5 RISK REWARDBITCOIN SETUP TRADE WIH 1:5 RISK REWARD
A good Buying detected on BTCUSD
It's showing a BULL MOVE due to these reason
1. It's following THE 60 M trendline here
2. It's ready to break the neckline
3. In day chat it's showing the heavy bullish pressure
Just grab out will your own risk
With a small amount
Stay connected
Stay happy
Bande mataram
BITCOIN SETUP TRADE WIH 1:5 RISK REWARD
A good Buying detected on BTCUSD
It's showing a BULL MOVE due to these reason
1. It's following THE 60 M trendline here
2. It's ready to break the neckline
3. In day chat it's showing the heavy bullish pressure
Just grab out will your own risk
With a small amount
Stay connected
Stay happy
Bande mataram

BITCOIN SETUP TRADE WIH 1:5 RISK REWARD A good selling setup BITCOIN SETUP TRADE WIH 1:5 RISK REWARD
A good selling setup detected on BTCUSD
It's showing a BULL MOVE due to these reason
1. It's following THE 60 M trendline here
2. It's ready to break the neckline
3. In day chat it's showing the heavy bullish pressure
Just grab out will your own risk
With a small amount
Stay connected
Stay happy
Bande mataram
BITCOIN SETUP TRADE WIH 1:5 RISK REWARD
A good selling setup detected on BTCUSD
It's showing a BULL MOVE due to these reason
1. It's following THE 60 M trendline here
2. It's ready to break the neckline
3. In day chat it's showing the heavy bullish pressure
Just grab out will your own risk
With a small amount
Stay connected
Stay happy
Bande mataram

BITCOIN SETUP TRADE WIH 1:5 RISK REWARDBITCOIN SETUP TRADE WIH 1:5 RISK REWARD
A good Buying detected on BTCUSD
It's showing a BULL MOVE due to these reason
1. It's following THE 60 M trendline here
2. It's ready to break the neckline
3. In day chat it's showing the heavy bullish pressure
Just grab out will your own risk
With a small amount
Stay connected
Stay happy
Bande mataram
BITCOIN SETUP TRADE WIH 1:5 RISK REWARD
A good Buying detected on BTCUSD
It's showing a BULL MOVE due to these reason
1. It's following THE 60 M trendline here
2. It's ready to break the neckline
3. In day chat it's showing the heavy bullish pressure
Just grab out will your own risk
With a small amount
Stay connected
Stay happy
Bande mataram

BITCOIN IS READY TO FALL 50K❗❗❗❗Price will likely to reach 52 to 50 in one or two weeks.
Price already takes the buyside liquidity.
Last 3 to 4 days it's been dropping slowly with accumulating orders to short.
It's my prediction maybe it will not happen.
Learn to analysis by yourself is better for you.
Peace.

BITCOIN AGAIN TO 56K😱?Yeah as per technical analysis it should come to 56k.
In my opinion it gives confirmation candle to go 56k.
Maybe it will reach there on Thursday or Friday ( economic data news) .
Learn to analysis by yourself.
Peace.

BITCOIN BREAKING TRENDLINE IN 15 MIN CHATA good falling detected on bitcoin
It's showing a fall due to these reason
1. It's following THE 15 M trendline here
2. It's ready to break the neckline
3. In day chat it's showing the heavy bearish pressure
Just grab out will your own risk
With a small amount
Stay connected
Stay happy
Bande mataram
Follow for more

BTC Short Opportunity BTC Short Opportunity
BTC near Bearish OB of 66500
Short for Target 64800
it is very clear that BTC is respecting Bearish OB

BITCOIN GOOD DOWN MOMEMTUM DETECTED FOR SHORTTERM ALSO FOR LONGBITCOIN SHOWING A GOOD FALL
A good falling detected on bitcoin
It's showing a fall due to these reason
1. It's following the triangle pattern over here
2. It's ready to break the neckline
3. After a good. Move refreshment will occur
Just grab out will your own risk
With a small amount
Stay connected
Stay happy
ITS A SETUP FOR SHORT TERM ALSO FOR LONGTERM
Follow for more
A good falling detected on bitcoin
It's showing a fall due to these reason
1. It's following the triangle pattern over here
2. It's ready to break the neckline
3. After a good. Move refreshment will occur
Just grab out will your own risk
With a small amount

BITCOIN SHOWING A GOOD FALIt's showing a good falling due to the following reasons
1. First of all it's faceing a resistance from the upper marked trend
2. Second the deep confidence comes from the secondary neckline breaking on 15 min chat
3. Third confirmation comes from in days chat it's completely bearish
Like if agree
Follow for more
It's showing a good falling due to the following reasons
1. First of all it's faceing a resistance from the upper marked trend
2. Second the deep confidence comes from the secondary neckline breaking on 15 min chat
3. Third confirmation comes from in days chat it's completely bearish
Like if agree
Follow for more

BITCOIN SHOWING A GOOD FALLA good falling detected on bitcoin
It's showing a fall due to these reason
1. It's following the double top pattern over here
2. It's ready to break the neckline
3. After a good. Move refreshment will occur
Just grab out will your own risk
With a small amount
Stay connected
Stay happy
Bande mataram
Follow for more

BITCOIN SHORT❗DANGER AHEAD❌it's the perfect time to look for SHORT.
I am telling you purely on technical analysis.
May be gold continue up for sometime.
Halving is coming for BTC,but bankers buying the gold.
Because there is a confusion with the fed rate cuts, uncertainty become resilient.
So bankers go with gold to avoid impact near future( note the word).
SOMETHING IS COMING!!!!!

BITCOIN BREAKOUT STARTEDBITCOIN FACING A SUPPORT LINE DALY chat plus a neckline BREAKING
In daly chat bitcoin facing a support line
Please check your own
And you can see the neckline also breaking
And over here a good falling also swowing
it will balance the fall by retraceing
with powerly due to support plus breakout
So it's a good opportunity for buy
Don't hesitate to trade
Grab it
Follows me for more
In daly chat bitcoin facing a support line
Please check your own
And you can check the neckline also breaking
And over here
a good falling also swowing
So it's a good opportunity for buy
Don't hesitate to trade
Grab it
Follows me for more

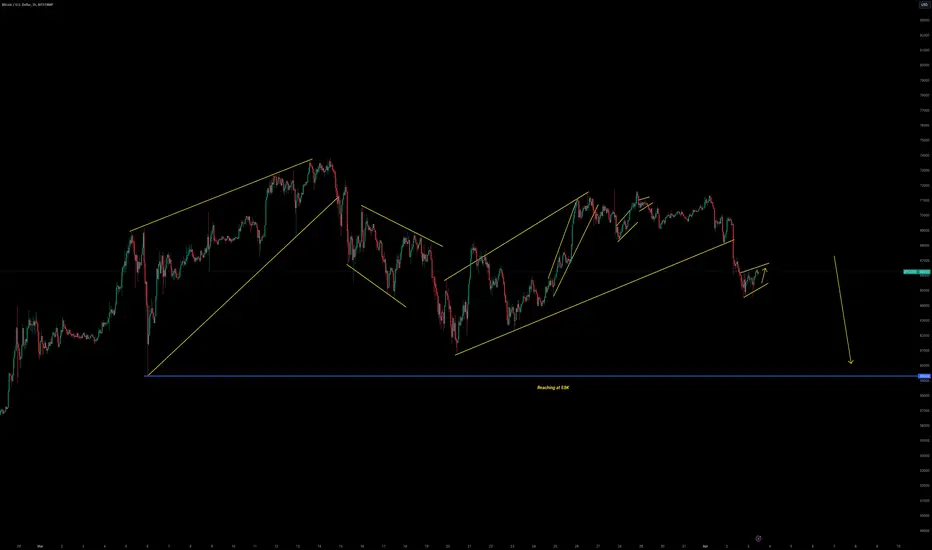
Movement to the downsideBTCUSD is forming a corrective formation for a movement to the downside & reaching to reach at 59K
#Bitcoin still Bullish upto $77k-81k As per 4-hourly chart Pattern,
#Bitcoin still be into Bullish Pattern and soon it will be towards FWB:77K -81k approx. but it will be many chances it goes towards Upwards into Bumpy rides just like previous one with some Pump-Dumps and Manipulations with Liquidations..!
Lets see...
what's and when next Ride goes..
but, #DYOR always as well Trade with #StopLoss in Crypto or in CRYPTOCAP:BTC
as well,
Share, Like, Comments on their too...

BITCOIN MOVE CAPTURED trendline breakoutA cleared breakout image shows on bitcoin chat
Without any confusetion
It's a Good entry don't hegitate to sell a good amount
big upcoming crypto move
enjoy the oppurtinity

The Bitcoin Charts Of 2020 And 2023Crypto Analyst Reveals Uncanny Similarities In The Bitcoin Charts Of 2020 And 2023
A crypto analyst has revealed what seems to be one of the most uncanny similarities in two separate Bitcoin charts. The two charts taken from 2020 and 2023 show a very similar price trend, and the most important part is what happens if Bitcoin continues to follow this trend.
What Happens If This Trend Continues?
If the historical performance of Bitcoin back in 2020 is repeating itself once more, then it is very bullish for the price. This is because 2020 is actually the year the last bull run began. From December 2020, going into the year 2021, the Bitcoin price would rise continuously to beat its previous all-time high set in 2018.

BTC Trade setup for 03-11-2023Hii Guys Nova this side, as per the previous key levels i have created a low risk high reward trade setup for you.
1:3 RRR

$BTC MacroOn the $BTCUSDT chart, I have highlighted all significant supports and resistance levels. In my opinion, we may see $14000 - $12000 before the next bull run, which might be before a rally to $38000 or after $BTC reaches $38k and then drops to the $14000 - $12000 zone.
In August, $Bitcoin might reach $14000 - $12000.You can DCA accordingly.
Trade at your own risk
Not Financial Advice

Bitcoin consolidating after a drop.Bitcoin for last 10 day is being consolidating after a nice fall of 10%.
The coin is consolidating in a range of 1% and there can be a nice move one it breaks the consolidation zone.
On the weekly charts, it is taking support from the 200 ema i.e. 25670 and has retested after testing the levels.
Even on the daily charts, there is also a bearish moving averages cross over and its trading below it. There might be a retest as there is a huge imbalance created.
For the intraday trades. The coin is trading around the 20 ema, on the hourly charts, and below the 200 ema.
The volumes are high when there is a fall and a reduction in the up move.
There is volatility which no giving a clear view in this range.
Let the coin give break out or break down of the levels and trades should be initiated accordingly.
Support :- 25860, 25670
Resistance :- 26185, 26500
Wait for the price action near the levels before entering a trade.

BTCUSD 5RR Trading SetupBTCUSD is Looking Bullish
BTC is in Their Strong Support
And IT is ready For a Bull run
