Perfect F&P on Bitcoins daily charts (21/01/26)Bitcoin forming good chart pattern on the daily charts.
The charts is a perfect example of a Flag and Pole pattern. If the pattern completes there are chance of seeing bitcoin dipping.
Identifying the last support around 85K. Be watchful if price dips below it.
Bitcoinusd

Bitcoin and Major Cryptocurrency Trends1. Bitcoin (BTC) Trends
Price Volatility: Bitcoin remains highly volatile, with rapid short-term swings influenced by macroeconomic events, regulation, and institutional adoption.
Institutional Adoption: Increasing interest from hedge funds, banks, and corporate treasuries drives long-term bullish sentiment.
Store of Value Narrative: Often called “digital gold,” Bitcoin is increasingly seen as a hedge against inflation, especially in uncertain economic periods.
On-chain Activity: Metrics like active addresses, transaction volume, and miner activity influence price trends and market sentiment.
Regulatory Impact: Changes in government regulations, especially in the U.S., Europe, and Asia, significantly affect price movements.
Correlation with Traditional Markets: Bitcoin sometimes moves in correlation with tech stocks and risk-on assets, but also shows periods of decoupling.
2. Ethereum (ETH) Trends
Smart Contract Growth: Ethereum dominates DeFi, NFTs, and dApp development, driving demand for ETH.
Transition to Proof-of-Stake (PoS): Ethereum’s shift from PoW to PoS reduces energy consumption and may improve scalability, impacting price sentiment.
DeFi & Layer-2 Solutions: Ethereum layer-2 networks like Arbitrum and Optimism enhance transaction speed and lower fees, increasing network adoption.
EIP Upgrades: Ethereum Improvement Proposals (EIPs), especially those reducing supply (like EIP-1559), impact ETH scarcity and valuation.
3. Binance Coin (BNB) Trends
Exchange Utility: BNB remains strongly linked to Binance exchange growth, offering discounted trading fees and token burns.
Expansion in Binance Smart Chain (BSC): Growth of BSC ecosystem and DeFi projects boosts BNB demand.
4. Cardano (ADA) Trends
Focus on Scalability & Sustainability: Cardano emphasizes peer-reviewed research and energy-efficient PoS validation.
Smart Contract Ecosystem: Adoption of smart contracts and DeFi projects on Cardano gradually increases network utility.
5. Solana (SOL) Trends
High-Speed Transactions: Solana offers high throughput and low fees, making it attractive for NFTs and DeFi projects.
Network Stability Concerns: Occasional network outages affect confidence but do not entirely diminish adoption.
6. Ripple (XRP) Trends
Banking & Payment Use Case: XRP remains focused on cross-border payments and partnerships with financial institutions.
Regulatory Developments: Legal outcomes, especially in the U.S., heavily influence XRP price and adoption.
7. Stablecoins Trends
USD-Pegged Coins (USDT, USDC): Stablecoins facilitate crypto trading, DeFi lending, and hedging against volatility.
Regulatory Scrutiny: Central banks and governments are increasingly monitoring stablecoin issuance and reserves.
8. General Cryptocurrency Trends
DeFi Expansion: Decentralized finance continues to grow, creating new yield opportunities and borrowing/lending mechanisms.
NFT Market Evolution: NFTs are diversifying beyond art into gaming, music, and real-world asset representation.
Institutional & Retail Interest: Adoption grows across both retail and institutional investors, boosting market liquidity.
Regulatory Focus: Global authorities are increasingly framing cryptocurrency regulation, impacting taxation, exchanges, and investor protection.
Layer-2 & Scaling Solutions: Technologies like Lightning Network (Bitcoin) and Ethereum L2s reduce transaction costs and improve scalability.
AI and Blockchain Integration: Emerging trend where AI analytics and blockchain-based data management intersect, creating innovative investment and utility models.

$BTC The Line in the Sand -Will the Multi-Year Trendline Retest?Market Context
Bitcoin is currently trading at a pivotal technical juncture. After the volatility seen in early December, we are now testing the major ascending resistance trendline that has broken this cycle. The next few daily closes will likely define the trend for the start of 2026.
The Trade Setup:
Bearish View: A short position can be taken near $92800 with $94800 as Stoploss.
potentially opening the doors for the Liquidity zones near $74500.
Invalidation: A breakout with high buying volume near $93500.
Final Thoughts:
Is this a "Buy the Dip" opportunity or the start of a deeper correction? I am leaning BEARISH as long as the BTC Rejects the TL holds, but I'm keeping a tight stop. What are your thoughts on the ETF flows impacting this level? Share in the comments!
#Bitcoin #BTC #Crypto #PriceAction #MacroAnalysis #TradingView

Solana Technical Reversal: MA Compression Resolves to the UpsideSolana is trading around 126 levels and there is a support which is being respected around 125 levels.
For last few weeks, no considerate candle is there. Only doji are being formed which shows the sideways moment in the charts.
If the market cycle changes, turning bullish, an entry can be made above 127 levels expecting a 10-11% movement in the crypto.
Major trend is bearish, Minor trend sideways.
The major support is around 100-110 level zone and there is not much of fall to capture as it has fallen 50% since Sept 2025.
On the hourly charts, there is a liquidity grab, taking out the bullish positions created on previous occassions.
A moving averages gate is also being created on the hourly charts as all the four EMAs (20, 50, 100 & 200) are moving in small range.
Now as per my view the market is trading in a range and it is also respecting a falling resistance line. A good R:R trade is there on the bullish side.
As per the plan, bullish position can be created in the assest once it crosses 127 levels.
Stop Loss :- 122.5
Target :- 144
R:R = 1:4
Multiple confluence there to enter the trade on the bullish side. Wait for the price action near the levels before entering the trade.

BLOOD BATH IN BITCOIN Bitcoin is going to crash within 1/2 days only if sustains below 106,400 USD. We can plan for sell side after closing below the level. CRYPTO:BTCUSD . Mark the level and simple wait for the confirmation.

BITCUSDALWAYS TAKE TRADE WITH CONFIRMATION
Note : Trading in any financial market is very risky. I post ideas for educational purpose only. It is not financial advice. Do not hold us responsible for any potential loss you may incur. Please consult your financial adviser before trading.

BTCUSD 1D Time frame📈 Price Action
Previous Close: $113,897.00
Day’s Range: $112,204.00 – $114,451.00
Current Price: $113,897.00
🔧 Technical Indicators
Relative Strength Index (14): 55.39 — Indicates neutral momentum.
MACD: Positive — Suggests upward trend.
Moving Averages:
5-day MA: $112,545.50
20-day MA: $112,519.63
50-day MA: $114,828.28
100-day MA: $109,519.30
200-day MA: $101,144.13
Stochastic Oscillator (14): 67.91% — Indicates bullish momentum.
Average True Range (ATR): $3,177.03 — Suggests moderate volatility.
Directional Movement Index (ADX): 10.23 — Indicates a weak trend.
📊 Support & Resistance Levels
Immediate Support: $112,000
Immediate Resistance: $115,000
🧠 Trend Analysis
Trend: Neutral to bullish
Momentum: Positive
Volatility: Moderate
Summary: Bitcoin is currently trading near $113,897, showing a neutral to bullish trend with positive momentum. The 50-day moving average is above the current price, indicating potential upward movement. Traders should monitor the support level at $112,000 and resistance at $115,000 for potential breakout opportunities.

SENSEX 1D Time frame📊 Current Snapshot
Current Price: ₹81,571
Day’s Range: ₹81,500 – ₹81,600
Previous Close: ₹81,425.15
Opening Price: ₹81,504.36
Volume: Moderate
📈 Trend & Indicators
Trend: Neutral to mildly bullish; trading near short-term resistance.
RSI (14): Neutral zone.
MACD: Positive → indicating mild bullish momentum.
Moving Averages: Short-term averages indicate neutral to slightly bullish outlook.
🔮 Outlook
Bullish Scenario: Break above ₹81,700 with strong volume could target ₹81,900.
Bearish Scenario: Drop below ₹81,400 may lead to further decline toward ₹81,200.
Neutral Scenario: Consolidation between ₹81,400 – ₹81,700; breakout needed for directional move.
📌 Key Factors to Watch
Economic Indicators: Interest rates, inflation, and RBI policy updates.
Sector Performance: Trends in the IT and financial sectors.
Global Cues: Global market trends, US indices, crude oil, and currency movements.

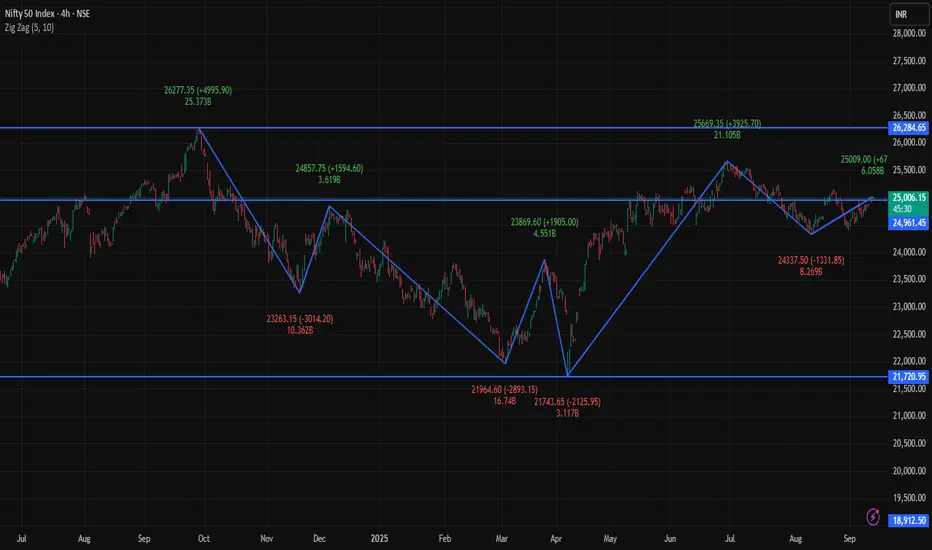
NIFTY 4H Time frame📊 Current Snapshot
Current Price: ₹24,976 - ₹25,006
Day’s Range (4H): ₹24,945 – ₹25,008
Previous Close: ₹24,973
Opening Price (4H): ₹24,991
Volume: Moderate
🔑 Key Support & Resistance Levels
Immediate Support: ₹24,945
Next Support: ₹24,900
Immediate Resistance: ₹25,008
Next Resistance: ₹25,050
📈 Trend & Indicators
Trend: Neutral to mildly bullish; trading near 50-hour and 200-hour moving averages.
RSI (14): 61 – Neutral zone.
MACD: Positive → indicating mild bullish momentum.
Moving Averages: Short-term averages suggest neutral to slightly bullish outlook.
🔮 Outlook
Bullish Scenario: Break above ₹25,008 with strong volume could target ₹25,050.
Bearish Scenario: Drop below ₹24,945 may lead to further decline toward ₹24,900.
Neutral Scenario: Consolidation between ₹24,945 – ₹25,008; breakout needed for directional move.
📌 Key Factors to Watch
Overall market sentiment.
Economic indicators: interest rates, inflation, RBI updates.
Global cues: US indices, crude oil, and currency movements.
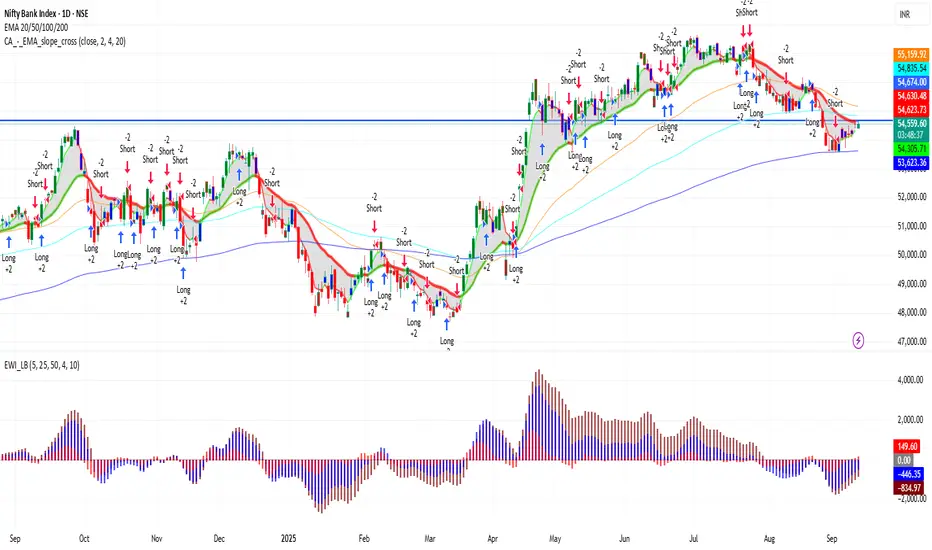
BANKNIFTY 1D Time frame📊 Current Snapshot
Current Price: ₹54,536.00
Day’s Range: ₹54,400 – ₹54,705
52-Week Range: ₹47,702.90 – ₹57,628.40
Previous Close: ₹54,216.10
Opening Price: ₹54,554.75
Market Cap: Approx. ₹3.78 lakh crore
Volume: ~77,647 contracts
📈 Trend & Indicators
Trend: Neutral to mildly bullish; trading near 50-day and 200-day moving averages.
RSI (14): 60 – Neutral; no immediate overbought or oversold conditions.
MACD: Positive → indicates bullish momentum.
Moving Averages: Short-term moving averages suggest neutral to slightly bullish outlook.
🔮 Outlook
Bullish Scenario: Break above ₹54,705 with strong volume could target ₹55,000.
Bearish Scenario: Drop below ₹54,400 may lead to further decline toward ₹54,000.
Neutral Scenario: Consolidation between ₹54,400 – ₹54,705; breakout needed for directional move.
📌 Key Factors to Watch
Banking Sector Performance: As BANKNIFTY comprises major banking stocks, sector-specific developments can influence index movement.
Economic Indicators: Changes in interest rates or inflation can impact index performance.
Global Cues: Developments in global markets can affect investor sentiment.
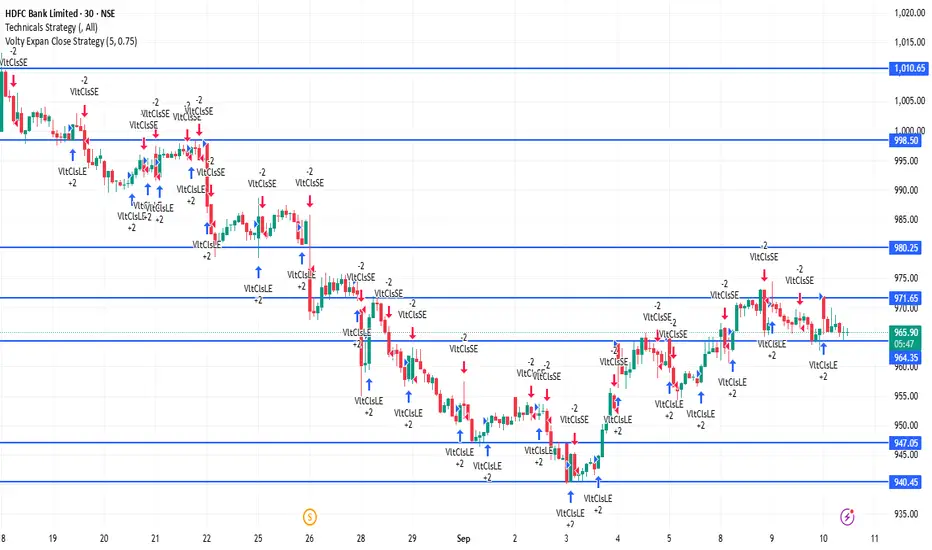
HDFCBANK 30Minutes Time frameHDFC Bank – 30M Important Levels (Current)
These levels are calculated using today’s intraday pivot data and provide reliable reference points for short-term trading.
Pivot Point (Mid-Level): ~₹967
First Resistance (R1): ~₹972
Second Resistance (R2): ~₹979
First Support (S1): ~₹960
Second Support (S2): ~₹955
These intraday pivots help highlight key zones where intra-day price action often stalls, reverses, or accelerates.
Intraday Trend Outlook (30M Chart)
Above ₹972: Bullish momentum may continue, with potential upside toward ~₹979.
Between ₹960 – ₹972: Neutral-to-bullish range; watch for sustain or reversal.
Below ₹960: Bearish pressure may build, potentially testing down to ~₹955.
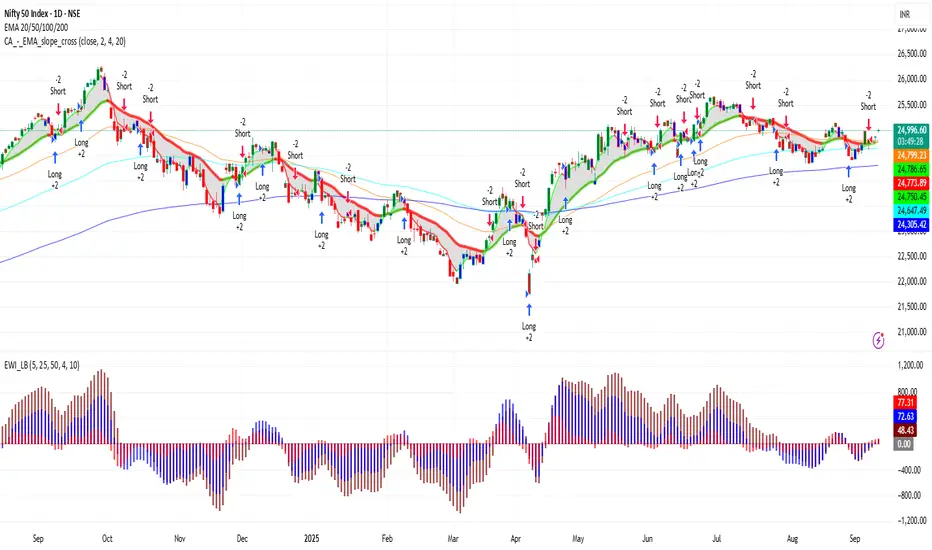
NIFTY 1D Time frame📍 NIFTY – 1D Important Levels
🔹 Support Zones
22,200 – 22,300 → Immediate daily support
21,900 – 22,000 → Strong support zone; buyers likely to step in here
21,500 – 21,600 → Major support; breakdown may shift trend to bearish
🔹 Resistance Zones
22,700 – 22,800 → Immediate daily resistance
23,000 – 23,100 → Strong resistance; breakout may fuel next leg higher
23,400 – 23,500 → Major resistance; if crossed, long-term bullish momentum strengthens
⚖️ Daily Trend Outlook
Nifty is currently in a bullish trend on the daily chart, making higher lows and sustaining above key moving averages.
Momentum remains strong as long as price holds above 22,200.
A breakout above 22,800 will likely push the index toward 23,000 – 23,500.
A breakdown below 22,200 could invite selling pressure toward 22,000 – 21,600.
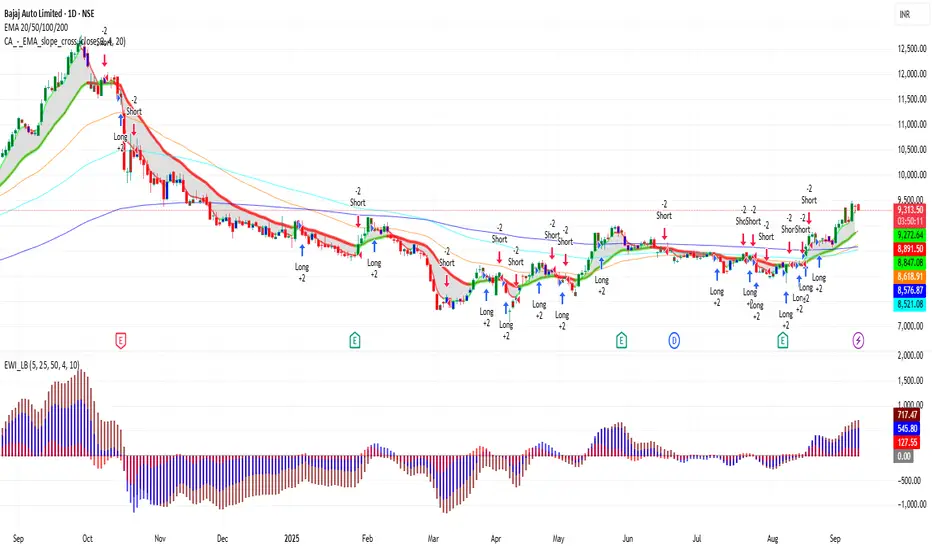
BAJAJ_AUTO 1D Time frame📍 BAJAJ_AUTO – 1D Important Levels (Current)
🔹 Support Zones
9,050 – 9,100 → Immediate daily support
8,800 – 8,900 → Strong support; buyers likely to defend this zone
8,500 – 8,600 → Major support; breakdown here may shift trend bearish
🔹 Resistance Zones
9,300 – 9,400 → Immediate daily resistance
9,550 – 9,650 → Strong resistance zone; breakout may extend upside momentum
9,800 – 10,000 → Major psychological resistance; if crossed, bullish trend strengthens further
⚖️ Daily Trend Outlook
Bajaj Auto is in a bullish structure on the daily chart, forming higher lows.
As long as price stays above 9,050, the stock remains positive.
A breakout above 9,400 – 9,650 can take it towards 9,800 – 10,000.
A breakdown below 9,050 could drag it towards 8,900 – 8,600.
XAUUSD 1H📍 XAUUSD – 1H Key Levels
🔹 Support Zones
$1925 – $1927 → Immediate intraday support
$1918 – $1920 → Stronger short-term support
$1910 – $1912 → Major support zone, breakdown could trigger deeper fall
🔹 Resistance Zones
$1935 – $1937 → First intraday resistance
$1945 – $1947 → Strong resistance area where sellers may re-enter
$1955 – $1960 → Major resistance; breakout above this can fuel a larger rally
⚖️ Quick Summary
Above $1935, bulls may push toward $1945 – $1960.
Below $1920, bears could drag price back to $1910 – $1900.
Range to monitor: $1920 – $1935 (decisive breakout will set next trend).
XAUUSD (Gold) – 1H Chart Analysis
🔹 Trend Overview
On the 1-hour chart, XAUUSD is currently showing short-term bullish bias but with nearby resistance.
Price action is making higher lows, but upside moves are facing supply zones.
🔹 Key Levels to Watch
Immediate Support Zone: $1918 – $1922
Major Support: $1910 – $1912
Immediate Resistance Zone: $1935 – $1940
Stronger Resistance: $1950
🔹 Indicators (1H Chart)
Moving Averages → Price trading above 20 EMA and near 50 EMA, showing short-term strength.
RSI (Relative Strength Index) → Around 60–65, leaning bullish but not overbought.
MACD → Positive crossover, momentum favoring buyers.
Volume → Buying volume spikes at dips, showing accumulation.
🔹 Intraday Trading Scenarios
Bullish Case
If price sustains above $1935, upside can extend to $1945 – $1950.
Breakout above $1950 opens path toward $1960+.
Bearish Case
If price drops below $1922, retracement towards $1912 – $1910 is possible.
Strong breakdown below $1910 may test $1900.
🔹 Summary
Bias: Mildly Bullish (as long as above $1920 support)
Support Levels: $1922 / $1910
Resistance Levels: $1935 / $1950
Traders should watch the $1920 – $1935 zone for the next decisive move.

USDJPY 1H📍 USDJPY – 1H
🔹 Support Zones
147.80 – 148.00 → Immediate intraday support
147.30 – 147.50 → Strong support; buyers likely active
146.80 – 147.00 → Major support; breakdown here may extend bearish momentum
🔹 Resistance Zones
148.50 – 148.70 → Immediate intraday resistance
149.00 – 149.20 → Strong resistance; breakout can trigger further rally
149.70 – 150.00 → Major psychological resistance
⚖️ Quick Summary
Bias: Currently range-bound with a bullish tilt as long as price stays above 147.80.
Breakout above 148.70 may open the way towards 149.20 – 150.00.
Breakdown below 147.80 may drag price back to 147.30 – 147.00.
Current watch zone: 147.80 – 148.70.

NIFTY 1H Important Levels 📍 NIFTY – 1H Important Levels
🔹 Support Zones
22,350 – 22,400 → Immediate intraday support
22,200 – 22,250 → Strong support zone
22,000 – 22,050 → Major support; breakdown here may trigger deeper selling
🔹 Resistance Zones
22,600 – 22,650 → Immediate resistance on 1H chart
22,800 – 22,850 → Strong resistance; breakout can push momentum higher
23,000 → Major psychological resistance
⚖️ Quick Summary
Bias: Mildly bullish as long as Nifty trades above 22,350.
Breakout above 22,650 may extend the rally towards 22,850 – 23,000.
Breakdown below 22,350 may drag it towards 22,200 – 22,000.
Current watch zone: 22,350 – 22,650.

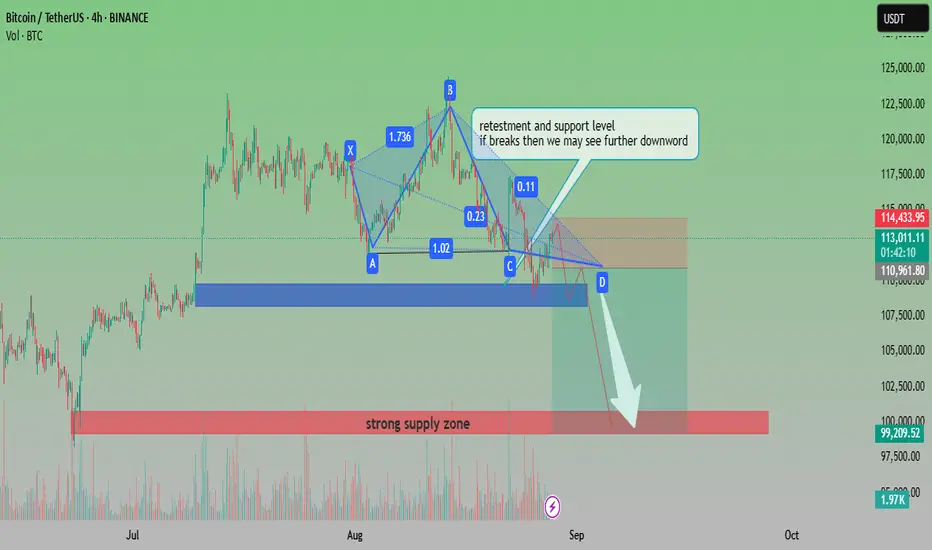
BTCUSDT Bearish Pattern with Key Support RetestAnalysis:
The chart shows Bitcoin (BTCUSDT) forming a harmonic pattern that signals potential bearish continuation. Price is currently retesting a critical support and resistance level around the 113,000–114,000 zone. If this level fails to hold, further downside movement is expected.
Pattern Formation: The harmonic structure (XABCD) suggests a bearish setup.
Support Zone: Around 110,900–111,000, a crucial level to watch.
Downside Target: If support breaks, the price could move toward the 99,000–100,000 strong supply zone.
Volume: A noticeable volume build-up supports potential continuation to the downside.
📉 Outlook: Bearish bias. A breakdown from current retest levels may accelerate selling pressure toward the 100k psychological zone.
Bitcoin 1 Day view Support Levels:
$112,000 — a critical short-timeframe level; a sweep below this could trigger opportunities according to @CryptoMichNL.
$113,000–$114,000 — active support zone where traders are positioning, as noted by Greeks.Live.
$111,200–$112,700 — a daily + 4-hour Fair Value Gap (FVG) support area. Holding this region may prevent further downside.
Resistance Levels:
$115,000 — identified as a pressure zone by crypto observers; its breach could lead to renewed momentum.
$115,700–$116,100 — Fibonacci-style resistance tiers from Barchart’s pivot-point analysis.
What to Watch Next
If BTC holds above $112,700–$113,000: Could attract buyers looking for a bounce, possibly aiming toward $115K+.
If BTC breaks below $112K: Risk of deeper correction; next meaningful stop near $111K.
If BTC clears $115K: Likely opens the path toward the $115.7–$116.1 zone and beyond.

BTC @ Strong Support - 117K Resistance turned Support areaIf Bitcoin is Bullish then price cant go further below than this area at 117K where price broke the resistance line forming the support. Which is the last and strongest support area for Bitcoin in chart.
I am 100% long in Bitcoin at this level now with all required margin in case of any more false down move. will need to hold this long for new ATH. I do not have any other strategy for now.
All data and impacting factors for Bitcoin suggesting +ve for Bitcoin.

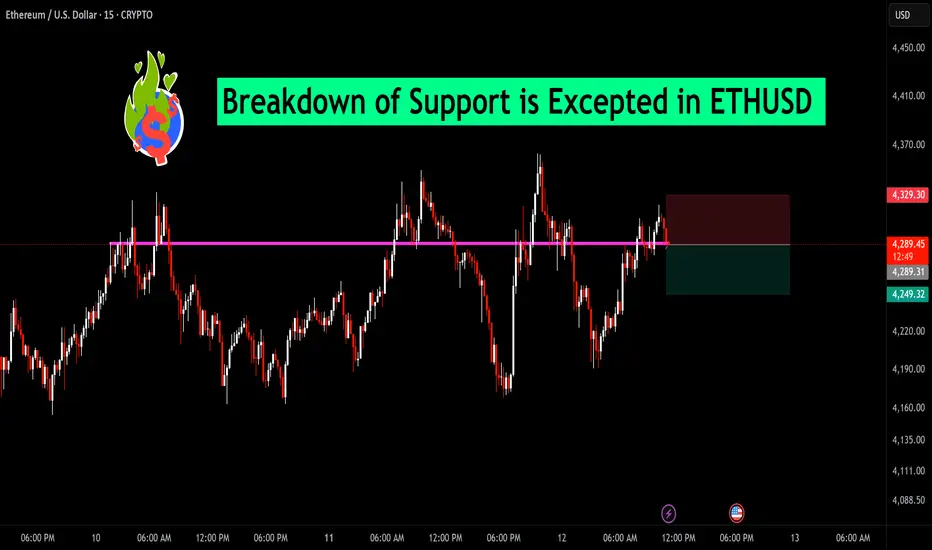
Breakdown of Support is Excepted in ETHUSD Ethereum is currently hovering just above a key horizontal support zone near $4,289. Price has tested this level multiple times, and selling pressure appears to be increasing. A decisive breakdown below this zone could trigger a short-term bearish move toward the next support near $4,249.
Traders should watch for a strong close below this support on the 15-min chart to confirm the breakdown. A tight stop above $4,329 could help manage risk for short positions.
Bias: Bearish below $4,289 | Bullish recovery only above $4,329
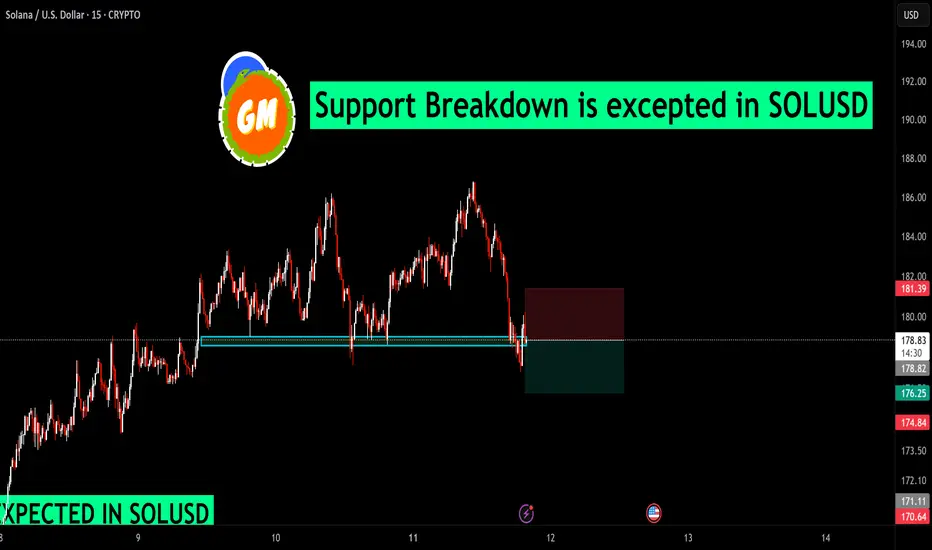
Support Breakdown is excepted in SOLUSDSOLUSD has breached a key support zone around the $178–$179 level, turning the area into potential resistance. Price action shows repeated rejections near this zone, followed by a decisive breakdown on strong bearish momentum.
If sellers maintain pressure below this level, further downside towards $175 and $171 could be on the cards. A sustained recovery back above $179 would be needed to invalidate the bearish outlook.
📉 Bias: Bearish below $179
🎯 Targets: $175 – $171
Trendline Support Retest in BTCUSDBTCUSD is currently retesting a crucial trendline support after a sharp pullback. Price broke above resistance earlier and has now returned to retest the breakout zone — a classic setup where buyers may step back in. ✅
📉 After a strong downtrend, we saw a bullish reversal pattern forming, followed by a clean breakout. This retest can act as a potential entry point for a long setup, provided the support holds.
📌 Key Levels:
Support Zone: ~$115,250 – $115,280
Resistance Zone: ~$116,180 – $118,200
Risk-Reward looks balanced with a well-placed SL below the retest candle.
🛡️ Watch for bullish confirmation (like a strong bullish engulfing or volume spike) before entering!
📅 Timeframe: 15-Minute Chart

Technical Analysis Mastery🧠 What is Technical Analysis?
Technical Analysis (TA) is the skill of analyzing price charts and patterns to predict future movements of stocks, indices, commodities, forex, or cryptocurrencies. It’s like reading the mood and psychology of the market by observing price and volume.
Instead of studying company balance sheets or industry trends (that’s fundamental analysis), technical analysis assumes that everything important is already reflected in the price. It’s used by intraday traders, swing traders, and even investors to make smarter entries and exits.
📚 The Core Principle of Technical Analysis
There are three main beliefs that form the base of technical analysis:
Price Discounts Everything
All news, emotions, expectations, and fundamentals are already priced into the chart. So, instead of worrying about inflation or earnings, a technical analyst looks at price action.
Price Moves in Trends
Markets don’t move randomly. They trend – either up, down, or sideways. TA helps you identify the direction of the trend and when it might be changing.
History Repeats Itself
Market behavior is repetitive because human psychology is repetitive. Fear and greed create familiar patterns. Candlestick patterns, chart patterns, and indicators are all built on this belief.
🧭 Types of Market Trends
To master technical analysis, you need to understand trends first:
📈 Uptrend (Bullish): Higher highs and higher lows.
📉 Downtrend (Bearish): Lower highs and lower lows.
➡️ Sideways (Range-bound): Price moves within a horizontal range.
Your first job as a technical analyst is to identify the current trend. Once you know this, your job becomes easier:
Buy in an uptrend, sell in a downtrend, stay cautious in a sideways market.
📊 Reading Price Charts (The Visual Language)
The chart is your battlefield. Let’s break down the types:
1. Line Chart
Shows the closing price over time.
Clean and simple, but lacks detail.
2. Bar Chart
Shows open, high, low, close (OHLC).
More informative than a line chart.
3. Candlestick Chart (Most Popular)
Shows OHLC in a visually rich format.
Green (or white) candles = price went up.
Red (or black) candles = price went down.
Candlesticks reveal trader emotions and help spot patterns like Doji, Hammer, Engulfing, etc.
🔍 Support & Resistance – The Foundation
Support = A price level where demand is strong enough to stop the price from falling further.
Resistance = A level where selling pressure prevents the price from rising.
Imagine support as a floor and resistance as a ceiling. Once broken, these levels often flip roles (old resistance becomes new support).
Example:
If Nifty keeps bouncing back from 21,000 – it’s a support zone.
If it keeps failing near 22,000 – that’s resistance.
✍️ Chart Patterns – Visual Clues to Price Moves
Chart patterns are shapes formed by price on a chart, often signaling upcoming moves.
✅ Continuation Patterns
Price will likely continue in the same direction.
🔺 Flag & Pennant
🔻 Triangle (Symmetrical, Ascending, Descending)
📦 Rectangle
🔄 Reversal Patterns
Suggests trend may reverse.
👨🦲 Head and Shoulders
🧍♂️ Double Top / Bottom
🛑 Rounding Top / Bottom
These patterns help you plan trades with entry, stop loss, and target.
🧠 Candlestick Patterns – Market Psychology in Action
Candlestick patterns show short-term momentum and emotion.
🔥 Bullish Candles
Hammer: Long wick at bottom – buyers stepping in.
Bullish Engulfing: Green candle swallows previous red one.
Morning Star: A 3-candle reversal pattern.
🧊 Bearish Candles
Shooting Star: Long wick at top – sellers taking over.
Bearish Engulfing: Red candle engulfs previous green one.
Evening Star: Opposite of Morning Star.
Candlestick mastery = understanding buyer vs seller fight in every candle.
🧰 Indicators & Oscillators – Your Technical Tools
Indicators are formulas applied to price data to give more insight.
🛣️ Trend Indicators
Moving Averages (MA):
SMA: Simple Moving Average.
EMA: Exponential (gives more weight to recent price).
Used to identify and confirm trends.
MACD (Moving Average Convergence Divergence):
Measures momentum and crossover signals.
Parabolic SAR:
Gives entry/exit dots on chart.
📉 Momentum Indicators (Oscillators)
RSI (Relative Strength Index):
Measures overbought (>70) or oversold (<30).
Stochastic Oscillator:
Shows momentum, good for spotting reversal zones.
CCI (Commodity Channel Index):
Helps detect cyclical trends.
These are tools to confirm what you see on price action – never trade based on indicators alone.
🧪 Volume – The Fuel Behind Moves
Volume tells you how strong or weak a price move is.
Rising volume + rising price = strong uptrend.
Low volume + breakout = fakeout risk.
Volume spike at support/resistance = possible reversal or breakout.
Smart traders always watch volume with price action. It shows institutional interest.
🧱 Building a Trading Setup (Strategy Framework)
A solid technical trading setup has:
Market Context (Trend, Sentiment)
Entry Trigger (Pattern, Indicator, Breakout)
Stop Loss Level (Support/Resistance, ATR, Swing High/Low)
Target (Risk:Reward ratio, Resistance/Support, Fibonacci)
Volume Confirmation
Risk Management Plan
🧠 Psychological Mastery in TA
Even the best technical setup can fail without the right mindset.
Stick to Plan: Don’t react emotionally.
Accept Losses: TA gives probabilities, not guarantees.
Avoid Overtrading: Quality > Quantity.
Backtest Your Strategies: Practice builds confidence.
Mastering TA is not just about charts – it’s about mastering yourself.
🧪 Advanced Concepts in Technical Analysis
Once you’re comfortable with the basics, explore:
🔁 Fibonacci Retracement & Extensions
📏 Average True Range (ATR) for volatility
📈 Ichimoku Cloud for trend + momentum
🔎 Multi-Time Frame Analysis
🔄 Divergence (RSI/Price divergence for reversal signals)
These tools help fine-tune entries and exits.
🧩 Common Mistakes in Technical Analysis
Avoid these traps:
Trading every breakout – wait for confirmation.
Ignoring the trend – don’t go against it.
Using too many indicators – analysis paralysis.
Revenge trading – leads to big losses.
Disrespecting stop loss – small loss can become disaster.
✅ How to Master Technical Analysis?
Learn from real charts – theory alone won’t help.
Practice Daily – track 1-2 instruments closely.
Journal Your Trades – analyze what worked/failed.
Backtest Setups – check success over historical data.
Follow Experts – learn from professional TA traders.
Join Communities – share and get feedback.
Consistency is the key to mastery. 📈
🧠 Final Thoughts: Why Technical Analysis Works
Because humans behave in predictable patterns, and TA captures those behaviors in charts. Whether it’s fear of missing out or panic selling, the psychology leaves footprints on price action.
You don’t need to predict the future. You need to react smartly to what the chart is telling you.
Mastering technical analysis takes time, patience, and lots of screen time – but once you get it, it becomes a powerful edge in the market.