Advance Option Trading💡 Why Advance Option Trading?
While beginner traders focus on price movement, advanced traders focus on:
Time decay (theta)
Volatility (vega)
Delta hedging
Neutral or range-bound markets
Income generation through spreads and option writing
This style of trading provides better capital efficiency, defined risk, and consistent performance across all market conditions (bullish, bearish, or sideways).
2. Implied Volatility (IV)
Higher IV = Expensive options
Lower IV = Cheap options
Key for strategies like IV Crush, Calendar Spreads, or Vega-neutral plays
3. Volatility Smile/Skew
Institutions track which strikes have higher IV. Advanced traders position accordingly.
🔧 Common Advanced Strategies
✅ 1. Straddle & Strangle (Neutral Volatility Strategy)
Straddle: Buy/Sell ATM Call + Put
Strangle: Buy/Sell OTM Call + Put
Use when expecting big movement or no movement (based on IV)
✅ 2. Iron Condor (Range-Bound Strategy)
Sell OTM Call and Put, Buy further OTM Call and Put (as hedge)
Best for sideways markets
Generates consistent income with limited risk
✅ 3. Calendar Spread (IV-Based Strategy)
Sell near-expiry option and buy same strike of a later expiry
Profits from increase in IV and time spread
✅ 4. Butterfly Spread (Limited Risk Strategy)
Example: Buy 1 OTM Call, Sell 2 ATM Calls, Buy 1 ITM Call
Small risk and good reward if price stays within expected range
✅ 5. Ratio Spread
Sell more options than you buy (e.g., sell 2 OTM Calls, buy 1 ITM Call)
Advanced version of directional bet with built-in hedge
✅ 6. Delta Neutral / Gamma Scalping
Balancing option position so that price movement doesn’t affect value
Common in institutions for high-frequency trading
📈 How to Select Right Strategy
✅ Identify Market Trend: Bullish, Bearish, Sideways
✅ Measure IV: Is it high or low?
✅ Track OI (Open Interest): Where are institutions positioning?
✅ Calculate Risk-to-Reward: Does your strategy offer good payoff?
✅ Time to Expiry: Shorter expiry = faster theta decay
⚠️ Risk Management in Advanced Option Trading
Professional traders always:
Set max loss per trade (usually <2% of capital)
Use hedged strategies (never naked short)
Adjust positions if the market breaks range
Keep an eye on Greeks changing with time
Track IV movement before entering trades
📊 Tools Used by Advanced Option Traders
Tool Purpose
Option Chain + OI Analysis Track smart money activity
Greeks Calculator (Sensibull, Opstra) Real-time risk data
IV Charts & Skew Analysis Measure volatility pricing
Backtesting Engines Validate strategies over past data
Algo Execution Tools Automate multi-leg strategies
🧠 Institutional Tactics in Advanced Option Trading
Institutions and prop firms often:
Build delta-neutral portfolios
Sell options with high IV and buy protection
Trade around key levels (VWAP, ATR ranges)
Use gamma scalping for directional bias
Exploit retail option traps near expiry
🔁 Adjustment Techniques (When Trade Goes Wrong)
Rolling the Position – Move strikes up/down or to next expiry
Convert into Ratio Spreads or Butterfly
Hedge with Futures
Close partially and rebalance
Switch to opposite bias if directional conviction is lost
💼 Who Should Learn Advanced Option Trading?
Traders already familiar with basic Calls & Puts
Intraday or swing traders wanting consistency
People managing 6- or 7-figure capital
Option sellers who want defined risk strategies
Anyone seeking market-neutral strategies for steady income
🔚 Final Thoughts
Advanced Option Trading is not about taking more trades — it's about trading smarter, with risk-managed, probability-based setups. When you learn how to use Greeks, volatility, and structure trades, you gain a huge edge over emotional retail trading.
Bitcoinusd

Institutional Objectives in Options Trading1. ✅ Hedging Existing Positions
Primary use of options by institutions is to hedge large portfolios against downside risk.
Example:
A mutual fund holding ₹100 crore of Nifty 50 stocks may buy ATM or slightly OTM Put options to protect against market correction.
Protective puts and collars are commonly used to limit drawdowns while staying invested.
🧠 Why?
Institutions can’t exit positions quickly without affecting prices. Hedging gives them protection without selling.
2. 💸 Generating Consistent Premium Income
Institutions frequently sell options (especially OTM calls or puts) to generate passive income.
Strategies like:
Covered Call Writing
Iron Condors
Short Strangles
They profit from time decay (theta) and the fact that most options expire worthless.
🧠 Why?
Consistent income + statistical edge + capital utilization = institutional trading edge.
3. 📊 Volatility Trading
Institutions exploit differences between implied volatility (IV) and expected volatility (realized).
If IV is overpriced: they sell options (e.g., strangles, straddles)
If IV is underpriced: they buy options (vega-positive strategies)
They may also trade volatility directionally, using long vega positions before events, then closing post-event for IV crush profits.
🧠 Why?
Volatility is measurable, forecastable, and less random than price.
4. ⚖️ Market-Neutral Strategies (Delta-Neutral Trading)
Institutions construct delta-neutral portfolios using options + futures or stock positions.
Aim: To remain neutral to price movement and profit from volatility or theta decay.
Example: Sell ATM straddle, hedge delta with futures, adjust gamma regularly.
🧠 Why?
Neutral strategies reduce directional risk and offer better control over large portfolios.
5. 🧮 Arbitrage Opportunities
Institutions exploit pricing inefficiencies between:
Spot and Futures vs. Options
Call-Put Parity violations
Time spread (Calendar arbitrage)
Skew arbitrage (buy underpriced, sell overpriced)
These strategies are often automated and require fast execution & deep capital.
🧠 Why?
Low-risk opportunities with high-frequency trading models.
6. 🧱 Portfolio Construction & Rebalancing
Options help institutions structure complex multi-asset portfolios using derivatives to offset sectoral risk, beta exposure, and drawdowns.
Example:
Hedging a tech-heavy portfolio by buying sector puts or using index options to balance exposure.
🧠 Why?
Options allow flexible risk management without directly altering core holdings.
7. 🔍 Event-Based Positioning
Institutions position themselves before key events:
Central bank meetings
Earnings reports
Budgets & elections
Fed rate decisions
They use options to:
Capture volatility spikes
Benefit from large moves
Hedge against adverse outcomes
Common strategy: Buy straddles or strangles pre-event, close post-event.
🧠 Why?
Leverage big events for volatility profit, while limiting risk to premium paid.
8. 🔐 Capital Efficiency and Leverage
Options allow institutions to:
Take positions with lower capital
Control large amounts of underlying using premiums
Enhance portfolio yield without leveraging core assets
Example: Buying call options instead of holding stocks for limited upside exposure.
🧠 Why?
Use of derivatives increases return-on-capital with controlled downside.
9. 🧠 Strategic Positioning via Open Interest (OI)
Institutions often create positions in options to:
Build pressure zones
Influence price action at key strikes (especially on expiry)
Track and trap retail option buyers (via fake breakouts or max pain theory)
🧠 Why?
Control over OI levels gives them an edge over uninformed players.
10. 🔁 Rolling, Adjusting & Managing Large Positions
Institutions don’t just enter and exit. They:
Roll positions across strikes or expiries
Adjust delta/gamma exposure
React to market shifts quickly without liquidating core holdings
Example:
Rolling a short call up if market is bullish
Converting short put into put spread if volatility increases
🧠 How Can Retail Traders Learn from Institutional Objectives?
Avoid naked option buying unless IV is low
Learn to sell options in range-bound or high-IV markets
Use Greeks to manage risk and adjust positions
Start tracking OI shifts before expiry
Never trade based on emotions — trade based on structure
🔚 Conclusion
Institutional options trading is driven by clear objectives, probability-based decisions, and risk frameworks. They use options not to gamble, but to optimize performance, protect portfolios, and generate edge.
If retail traders start thinking like institutions — by focusing on risk, volatility, structure, and data, rather than emotions — they’ll not only survive in the market, but begin to thrive.

Technical Class🎯 What is a “Technical Class”?
A Technical Class is a structured learning session or course designed to teach technical analysis – the skill of forecasting price movement in financial markets based on charts, price patterns, indicators, volume, and historical data.
It’s one of the most essential skillsets for traders and investors, especially those involved in stock trading, intraday trading, swing trading, options, forex, or crypto.
📘 Purpose of a Technical Class
The main goal of a technical class is to train participants to:
Read and analyze price charts confidently
Use indicators and tools to generate buy/sell signals
Recognize institutional footprints and volume patterns
Make independent, logic-based trading decisions
Avoid emotional or speculative trades
🧱 What Topics Are Covered in a Technical Class?
✅ 1. Chart Reading Basics
Candlestick types (Doji, Hammer, Engulfing, Marubozu)
Price vs. Volume relationship
Support & Resistance levels
Timeframes: Intraday (5m/15m), Positional (1D/1W)
✅ 2. Price Action Trading
Trend structure: HH-HL / LH-LL sequences
Breakouts & Fakeouts
Supply-Demand zones
Liquidity traps
✅ 3. Technical Indicators
Trend Indicators: Moving Averages (SMA/EMA), MACD
Momentum Indicators: RSI, Stochastic, CCI
Volume Indicators: VWAP, OBV, Volume Profile
Volatility Indicators: Bollinger Bands, ATR
✅ 4. Chart Patterns
Continuation Patterns: Flags, Pennants, Triangles
Reversal Patterns: Head & Shoulders, Double Top/Bottom, Wedges
Range Patterns: Rectangles, Channels
✅ 5. Support & Resistance Mastery
Dynamic (Moving averages, trendlines)
Static (Horizontal S/R, Round numbers)
Institutional S/R zones with Volume & OI
✅ 6. Trend Analysis
Identifying Bullish, Bearish, and Sideways markets
Role of Volume in confirming trends
Using Dow Theory and Market Structure
✅ 7. Advanced Concepts
Divergence (Price vs. RSI/MACD)
Multi-Timeframe Analysis (MTA)
Fibonacci Retracement & Extensions
Chart psychology (why price behaves irrationally)
🧠 Skills You Gain from a Technical Class
How to time entries and exits based on confirmation
How to avoid false breakouts
When to use indicators and when to trust price action
How to combine volume + price for high-probability setups
How to align with smart money and institutional footprints
🎓 Who Should Attend a Technical Class?
✅ New traders wanting a strong foundation
✅ Intraday and swing traders aiming for consistency
✅ Investors looking to time entry/exit better
✅ Option traders who want to read chart behavior
✅ Crypto/forex traders who rely on pure price movement
📈 Real-World Applications
Identify trend reversals before they happen
Spot breakouts with volume confirmation
Align trades with institutional positioning
Reduce overtrading and increase accuracy
Make data-backed decisions, not emotional guesses
⚠️ Common Mistakes Covered in a Technical Class
❌ Overuse of indicators (indicator overload)
❌ Trading without stop-loss
❌ Misreading breakouts and breakdowns
❌ Ignoring volume and confirmation
❌ Lack of patience or plan in trade execution
🔚 Final Thoughts
A Technical Class is more than just learning chart patterns — it’s about understanding how the market thinks, how price reacts, and how you can trade in sync with logic, not emotion.
Whether you're into stocks, futures, options, or crypto — a strong technical foundation increases your edge, reduces losses, and boosts confidence.

Intraday Breakout + Fakeout TradingPart 1: What Is a Breakout?
A breakout happens when the price moves decisively beyond a key level — like a recent high/low, trendline, or chart pattern.
Example: If the stock "ABC" has traded between ₹100–₹105 all morning and then suddenly moves above ₹105 with momentum, that’s a breakout.
Breakouts often occur with increased volume, indicating real interest and strong buyer or seller participation.
Why Breakouts Matter:
They signal a new trend beginning — price can continue the breakout move.
Give good entry points for intraday traders, with momentum and direction aligned.
Part 2: The Hidden Danger — Fakeouts (False Breakouts)
A fakeout looks like a breakout initially but fails.
Price might pop past ₹105 momentarily, lure traders into buying, then reverse back inside the range.
This traps breakout buyers and gives fast momentum to the opposite side.
Fakeouts are common because:
Institutional traders (banks, funds) trigger stops to create liquidity
They force retail traders to enter at highs or lows, then reverse.
Why Fakeouts Happen
Liquidity needs: Big orders need counterparties. Institutions use stop hunting to liberate liquidity from retail participants.
Retail psychology: People see a breakout and jump in, hoping for a move, not realizing large players might be on the other side.
Pattern triggers: A small breakout can trigger algos or smart traders, but institutions may let it fail and reverse.
Part 3: Trading the Breakout — The Bullish Method
1. Identify a Breakout Level
Use recent swing high, consolidation zone, trendlines, or chart patterns (triangles, flags).
Example: ABC stock ranges between ₹100–₹105. Highlight ₹105 as key.
2. Watch Volume
Look for increased volume as price breaks out.
A genuine breakout usually has higher-than-average volume.
3. Enter the Trade
Go long when price is clearly above ₹105 by a few ticks.
Make sure price doesn’t immediately reverse after breakout.
4. Set Stop Loss (SL)
Place SL just below breakout point — e.g., ₹104.50.
Keep risk small (1–2% daily capital per trade).
5. Plan Target
Simple method: Target range size — if range is ₹5, target ₹110.
You can also trail stop as price moves in your favor.
6. Ride or Fade
If breakout momentum is strong, stay in.
If breakout fades early (price returns to range quickly), exit fast with small profit/loss.
Part 4: Trading the Fakeout — The Reversal Strategy
Fakeouts are dangerous but also profitable when traded smartly.
1. Spot the Fakeout
Price breaks above ₹105, but returns inside range within minutes without volume or momentum.
Watch candlestick behavior: long wick, small body, low volume.
2. Manage Delay
Don’t react instantly. Wait for confirmation — price must clearly move back below breakout level.
3. Enter Short (or Long on Breakdown false in opposite direction)
Example: If price drops back below ₹105 by ₹1–₹2, you can short with tight risk.
Stop loss goes just above failed breakout high — e.g., SL at ₹106.
4. Aim for Targets
Range low or midpoint makes sense — e.g. ₹100–₹102.
Use ATR (Average True Range) to estimate a reasonable target distance.
Part 5: Examples in Real Language
Example 1: Breakout in a 5-Min Chart
ABC stock consolidates 10–15 mins between ₹100–₹105.
At 10:30, price surges to ₹106 with strong green candle and large volume.
Entry: ₹106. SL: ₹105.50. Target: ₹110. You ride a strong up move.
Example 2: Fakeout in a 15-Min Chart
DEF stock ranges ₹200–₹205 all morning.
At 11:00, price spikes to ₹207 but turns into a long upper wick and low volume.
Price pulls back below ₹205 at ₹204 quickly.
You short at ₹203. SL at ₹207. Target around ₹200–₹202.
Part 6: Tools & Indicators for Intraday Trading
Volume Bars: Watch for spikes during breakout.
VWAP (Volume Weighted Average Price): Key mid-price support/resistance.
ATR: Measure average daily range to avoid unrealistic targets.
Price Action: Candlestick patterns like doji, pin bars show indecision or false moves.
Market Structure: Chart patterns like triangles, rectangles, head & shoulders for scan points.
Part 7: Risk Management — The Secret to Longevity
Trade size: Only risk 1–2% of capital per trade.
Stop loss discipline: Always have one — don’t skip it.
Multiple trades: Treat each trade as an independent probability event.
Journaling: Note entry, exit, what worked, what didn’t — helps improve your edge.
Part 8: Psychology — Stay Sharp
Avoid FOMO: Missing a breakout isn’t the end of the world.
Don’t revenge-trade: A loss? Take a breather — no emotional trades.
Be calm: Fast-moving markets need clear, calm decisions.
Faith in your edge: Breakout/fakeout method gives you a statistical edge. Trust your rules.
Part 9: When It Works Best
High liquidity stocks: Participate in assets with clear range and volume (e.g., Nifty, BankNifty, Infosys).
News quiet sessions: Breakouts are cleaner without macro news noise.
Market in range or coiling: Avoid breakouts in parabolic trending environments — risk of strong false moves.
Part 10: Sample One-Month Plan
Week 1: Learn pattern spotting, practice range identification.
Week 2: Track 5–10 breakout setups, journal volume & outcome.
Week 3: Introduce fakeout reading — analyze failed breakouts.
Week 4: Combine breakout/fakeout strategy with VWAP and ATR for entry confirmation.
Regularly review: entry quality, risk management, and behavioral mistakes.
Risk setup: Pre-calculate target and stop-loss before market open.
🔑 Final Summary
Breakouts are powerful moves above key levels — but confirm with volume and momentum.
Fakeouts trap breakout buyers — these often reverse quickly and offer profitable setups.
Combine both: enter breakouts smartly; trade fakeouts when momentum fails.
Always manage risk — stop-loss, position size, and psychology matter most.
Stick to high-liquidity names and keep perfect trade records.

Volume Profile🧠 What Volume Profile Tells You:
Where Smart Money is Positioned: Institutions trade size at certain price levels. If a level has massive volume, it likely involves institutional orders.
Where Price May Reverse: Low volume areas are like "no-man's land." Price often doesn’t stay long there and either gets rejected or moves quickly.
Where Breakouts or Reversals May Happen: Combining price action with volume profile gives you powerful insight.
📥 What is Order Flow Trading?
📘 Definition:
Order Flow Trading is the real-time reading of buying and selling activity in the market by analyzing:
Bid-ask spread
Market orders
Limit orders
Volume clusters
Delta (Buy volume vs Sell volume)
This tells you who is in control: Buyers or Sellers, and whether their momentum is strong or weakening.
💡 Why Combine Volume Profile + Order Flow?
Separately, both tools are powerful. Together, they form a deadly accurate system for identifying:
Institutional interest zones
Breakout traps
Liquidity pools
Stop hunts
True vs false momentum
Where the market is likely to go next
🧱 Building Blocks: How to Read and Use Volume Profile
1. Identify the POC (Point of Control)
This is the battlefield where the most contracts were traded.
Price tends to revisit the POC like a magnet.
Trade Idea: If price is above POC and rising with volume — strong uptrend confirmation. If price breaks below POC with volume, it may reverse.
2. Look at Value Area High & Low
VAH = Value Area High = Potential resistance
VAL = Value Area Low = Potential support
Trade Idea: If price bounces from VAL with strong delta → go long. If price rejects VAH with large seller volume → go short.
3. Watch for Low Volume Nodes
These are areas where price moved fast with little trading.
Often leads to explosive breakouts or breakdowns.
Trade Idea: Trade the breakout into LVN zones with confirmation from order flow.
🧠 How to Read Order Flow (Simplified)
Step 1: Use Footprint Charts
Look inside candles at volume per price.
Find imbalances: For example, if buyers heavily dominate the top of a candle — strong breakout.
Step 2: Watch Delta
Positive Delta = More aggressive buyers
Negative Delta = More aggressive sellers
Caution: Sometimes delta diverges from price — this can signal reversals.
Step 3: Observe Cumulative Delta
Shows overall trend of buyers vs sellers.
Helps confirm whether a breakout has real commitment or is just a trap.
🔁 Example: How a Trade Comes Together
Market Context:
Nifty is approaching yesterday’s high.
Volume profile shows an LVN above the current price.
Footprint chart shows increasing buyer imbalances.
Delta is rising sharply.
Trade Idea:
Go long when price breaks into the LVN zone with rising delta.
Target is POC from previous day or upper HVN.
Stop loss just below breakout candle or VAL.
🎯 Real-World Institutional Trading Behavior
Institutions don’t chase price. They:
Accumulate at low volume pullbacks
Defend key POC levels
Trigger fake breakouts to trap retail traders
Use high volume zones to hide big orders
When you use Volume Profile + Order Flow, you’re reading their footprints. You can literally “see” where they’re active.
📌 Practical Tips to Get Started
Start With Volume Profile First
Understand where price is attracted (POC), where it stalls (VAH/VAL), and where it moves quickly (LVN).
Add Footprint Charts for Confirmation
Look at volume imbalances, delta pressure, and trapped buyers/sellers.
Use Volume Profile Across Timeframes
Weekly Volume Profile = Big picture
Daily Volume Profile = Context
Intraday Volume Profile = Execution
Mark Key Levels Before the Session
POC, VAH, VAL from previous day
Watch for reactions
Use Replays to Practice
Many platforms (like NinjaTrader, Sierra Chart, Quantower, TradingView) allow market replays. Watch how price reacts to volume levels.
🚫 Mistakes to Avoid
Don’t blindly trade every POC touch — wait for confirmation from order flow.
Don’t trade inside the value area unless volatility is high.
Don’t ignore market context (news, macro, global indices).
Don’t over-analyze — simplicity wins.
💻 Tools and Platforms
To trade with Volume Profile + Order Flow effectively, you’ll need:
TradingView (Paid plans for Volume Profile)
Sierra Chart / NinjaTrader / Quantower for full order flow features
Volume Profile indicators like Visible Range, Fixed Range, Session Volume
Footprint Chart and DOM for advanced flow reading
🧩 Final Thoughts: Is This Right for You?
Volume Profile + Order Flow Trading is used by professional traders, proprietary firms, and institutions to:
Time entries and exits with precision
Understand market logic and manipulation
Avoid false breakouts and trap zones
Follow the real flow of smart money
While it takes time to learn, this method offers unmatched insight into how markets really work.
Macro + Rate-Sensitive Asset Trading✅ What is Macro + Rate-Sensitive Asset Trading?
In basic terms:
Macro Trading is trading based on big picture economic trends — like inflation, interest rates, GDP growth, central bank policies, and geopolitical risks.
Rate-Sensitive Asset Trading focuses on those assets that react strongly when interest rates change, like:
Government bonds
Bank stocks
Real estate investment trusts (REITs)
Gold
Growth tech stocks
Commodities
Currency pairs (like USD/INR, EUR/USD)
Together, macro and rate-sensitive asset trading means analyzing global and national economic data to predict movements in specific assets and sectors.
🧠 Why is This So Important?
Because big players (FII, DII, Hedge Funds) move billions of dollars based on these macro themes.
Imagine this:
If inflation spikes → Central bank may raise interest rates
If rates go up → Bond yields rise → Bank profits rise
At the same time → Real estate slows down, gold may fall, tech stocks may suffer
And the currency (like USD or INR) may strengthen or weaken
As a trader, understanding these domino effects lets you ride big, high-conviction trades that can last for days, weeks, or even months.
🏛️ Who Controls Interest Rates?
Central banks — like the Federal Reserve (USA) or RBI (India) — adjust interest rates to control inflation and support economic growth.
Rate Hike = Borrowing becomes expensive = Slows the economy
Rate Cut = Borrowing becomes cheaper = Boosts growth
Market participants react even to expectations of these changes.
So, successful traders often read between the lines of central bank speeches, economic releases, and policy statements.
🧮 Examples of Rate-Sensitive Assets
Let’s break them down one by one:
1. Banking Stocks (HDFC Bank, ICICI Bank, SBI, Axis)
Banks make more profit when interest rates are high.
They charge more on loans and earn better margins.
So, when the RBI hikes rates, banking stocks usually go up.
📈 Trade Idea: Buy banking stocks on rate hike expectations, especially when inflation is rising.
2. Bonds and Bond Yields
Bond prices move inversely to interest rates.
When rates go up, bond prices go down, and yields go up.
Traders use this to position in debt instruments or short-duration bonds.
📉 Trade Idea: Short long-duration bonds when interest rates are expected to rise.
3. Gold and Silver
Gold is a non-interest-bearing asset.
When rates rise, bonds become more attractive → People shift from gold to fixed income → Gold falls
But during high inflation or crisis, gold can also rise as a hedge.
⚖️ Trade Idea: If real interest rates (adjusted for inflation) rise → Sell gold. If inflation is rising faster than rates → Buy gold.
4. Tech and Growth Stocks (Rate-Sensitive Equities)
High-growth companies (like tech startups or innovation companies) often rely on borrowing.
Rising interest rates increase their cost of capital.
This can compress future profits, and stock prices fall.
📉 Trade Idea: Avoid high-P/E or growth stocks during rising rate cycles. Favor value or dividend-paying stocks.
5. Real Estate / REITs
Real estate is interest-rate sensitive because home loans, EMIs, and mortgages get costlier.
When rates rise, property demand slows, and REITs (real estate investment trusts) fall.
📉 Trade Idea: Short REITs or reduce allocation during rate hike cycles.
6. Currency Pairs (Forex)
When a country hikes rates, its currency becomes stronger because it offers better returns to foreign investors.
For example, if the US Fed raises rates, the USD strengthens against INR, EUR, JPY, etc.
📈 Trade Idea: Go long on USD/INR or USD/JPY when Fed is expected to hike.
📌 How Traders Use This Information (Practical Steps)
Step 1: Develop a Macro View
Ask: Is the global economy growing or slowing?
Is inflation rising or under control?
What are central banks signaling?
Step 2: Find Asset Classes That React
If inflation rising → Buy banks, sell bonds and gold
If growth slowing → Buy bonds, sell cyclicals, maybe gold
Step 3: Time Your Entry with Technicals
Use charts (e.g., TradingView) to find good levels to enter.
Look for breakout or pullback entries.
Step 4: Manage Risk
Macro trades can move fast and big.
Always use stop losses and size your position smartly.
🧠 Pro Tips From Institutional Traders
Macro moves are slow but deep.
These trades often play out over days or weeks. Be patient.
Market moves on expectations, not news.
Price reacts before the news comes out. Get in early.
Central banks don’t always do what they say.
Learn to interpret tone, not just statements.
Watch global flows.
US rate hikes can affect Indian markets. Always zoom out.
Be aware of cycles.
Every asset class has cycles. Learn when each one outperforms.
⚠️ Risks of Macro and Rate-Sensitive Trading
Data surprises can flip the market instantly
Correlations can break (e.g., gold going up with rates)
Over-trading on news can lead to losses
Requires understanding of multiple asset classes
Long holding periods may tie up capital
📈 Real-Life Example: RBI Hike Cycle in India
Let’s say inflation in India is rising fast — food prices, fuel, etc.
RBI responds by:
Raising repo rates from 6.5% to 7.0%
Goal: Slow down spending and borrowing
What happens?
Banks rally → Nifty Bank goes up
Bonds fall → 10-year yield rises
Real estate cools off
Gold weakens if INR strengthens
Tech stocks underperform
A smart trader could:
Go long on Bank Nifty Futures
Short REITs or real estate stocks
Exit tech or auto sector temporarily
This is a textbook example of macro + rate-sensitive trading in action.
📚 Final Thoughts: Is This For You?
Macro trading with rate-sensitive assets is not for absolute beginners, but it is a powerful approach for intermediate and advanced traders.
✅ Advantages:
Big moves with logic behind them
Insight into how institutions think
Ability to diversify across assets
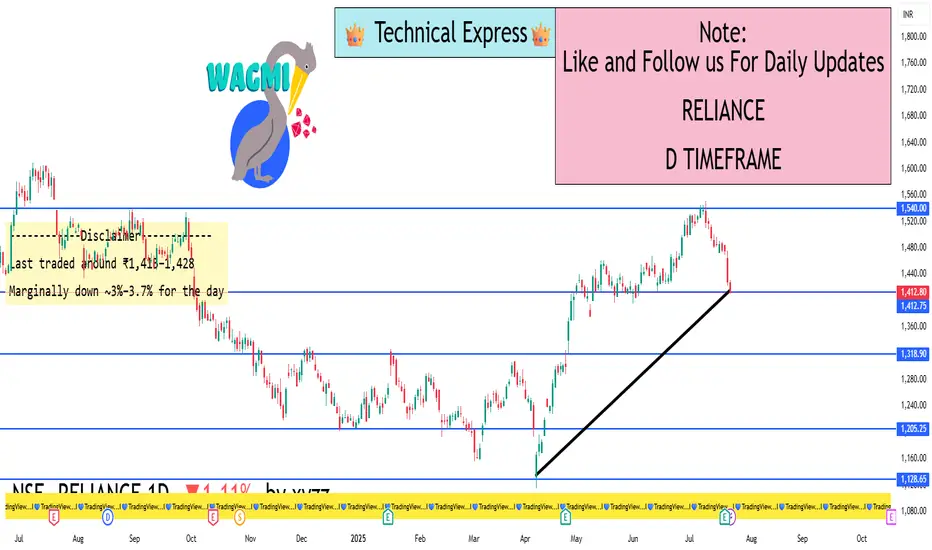
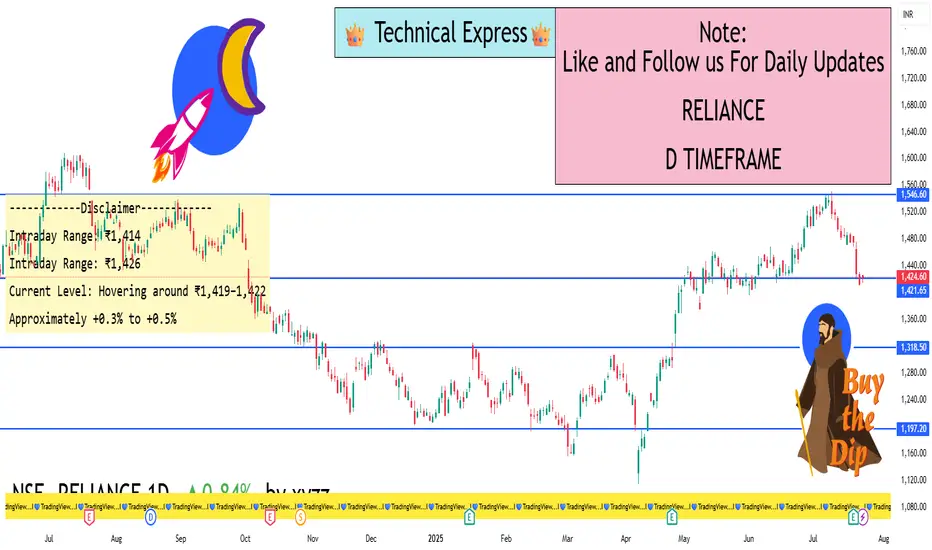
RELIANCE 1D TIMEFRAME🧾 Basic Market Overview
Open: ₹2,990
High: ₹3,012
Low: ₹2,943
Close: ₹2,956
Change: Down by ~₹34 (approx. -1.13%)
Today, Reliance started strong but faced immediate selling near the ₹3,000 mark, resulting in a negative close. The price remained weak for most of the session, and closed near the day’s low, which is a bearish sign.
🕯️ Candlestick Formation
The candle formed on the daily chart resembles a strong bearish candle — possibly a long red candle or bearish engulfing if it closes below the previous day’s close. This shows:
📈 Trend Overview
Short-Term Trend: Weak — downward momentum building
Medium-Term Trend: Sideways to slightly bullish
Long-Term Trend: Bullish — still intact unless price breaks ₹2,850
Today’s weakness has not yet broken long-term structure, but short-term traders should be cautious.
🔮 What Could Happen Next?
✅ Bullish Recovery:
If Reliance moves back above ₹3,000 and sustains with volume, it can retest ₹3,050–₹3,080
A bullish engulfing or reversal pattern needed for upside confirmation
⚠️ Bearish Continuation:
If it breaks below ₹2,940, more downside is possible toward ₹2,915–₹2,875
Traders may take short positions below this level with tight stop-loss
🔄 Consolidation:
If the price holds between ₹2,940 and ₹3,000, expect sideways movement or base building before a big move
🎯 Strategy Suggestions
For Intraday Traders:
Watch ₹2,940 – ₹3,000 levels closely
Short below ₹2,940 with a target of ₹2,915
Long above ₹3,000 only if backed by strong buying
For Swing Traders:
Avoid new longs until daily candle shows strength
Consider fresh buys near ₹2,900–₹2,915 with SL below ₹2,875
Wait for a breakout above ₹3,050 to confirm bullish reversal
For Investors:
No need to panic; long-term uptrend still valid
Add in dips if it reaches ₹2,875–₹2,850 with confirmation
Fundamental strength supports medium-to-long-term outlook
📌 Summary
Reliance showed bearish sentiment today, breaking below the short-term support of ₹2,975 and closing weak at ₹2,956. It’s trading between a critical support zone of ₹2,940–₹2,915 and facing resistance around ₹3,000–₹3,020.
Short-term: Bearish bias
Medium-term: Neutral to weak bullish
Long-term: Still bullish unless ₹2,850 breaks decisively
Traders should be cautious and wait for confirmation before taking aggressive positions.
Buyers attempted a push above ₹3,000 but failed.
Bears took over the session.
Closing near the day’s low suggests strong downside momentum.
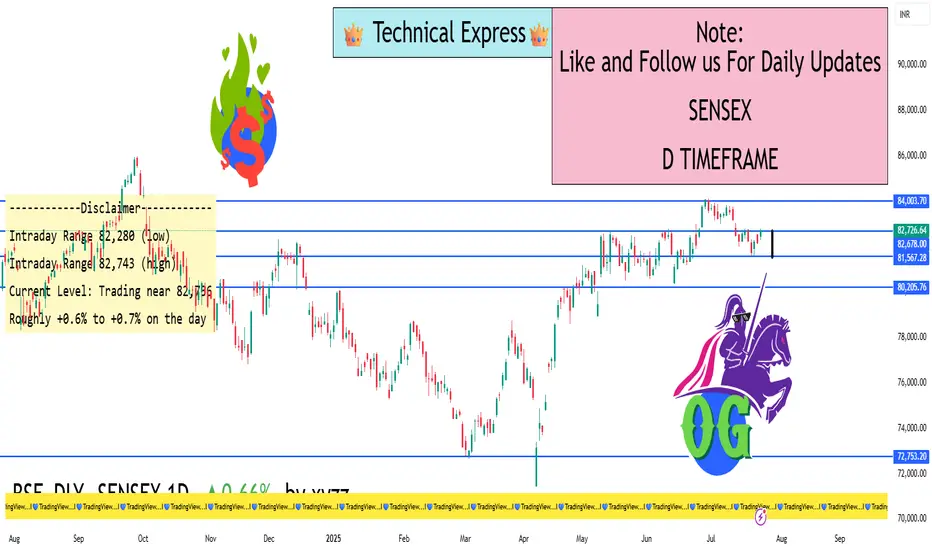
SENSEX 1D TIMEFRAME🧾 Basic Market Overview
Open: ~80,135
High: ~80,177
Low: ~79,513
Close: ~79,698
Net Change: Down by approximately -437 points or -0.55%
The SENSEX index opened slightly positive today but faced strong resistance near the 80,200 level and then reversed sharply during the session. It closed lower than the opening, indicating bearish pressure.
🕯️ Candlestick Analysis
Today’s candlestick is bearish, forming something close to a bearish engulfing or long red candle. It:
Opened higher than yesterday’s close
Rejected higher levels
Closed near the bottom of the day’s range
This suggests supply pressure and profit-booking near the all-time high zone.
📈 Trend & Structure
Short-Term: Weakening; showing signs of reversal
Medium-Term: Still bullish, but cautious near highs
Long-Term: Uptrend still intact (higher highs and higher lows)
The index is currently facing a resistance zone around 80,200–80,300. This is a psychological and technical barrier.
📌 Sector-wise Observation
Banks (ICICI, HDFC Bank): Weak today; contributed to downside
Reliance: Also showed weakness; contributed to fall
IT Sector: Mixed performance; Infosys held flat
FMCG and Pharma: Stable or slightly positive
Major drag came from financials and heavyweight Reliance.
📉 Price Action Summary
SENSEX failed to hold above 80,000, showing resistance
Sellers active at higher levels
First signs of minor distribution phase near the top
May now move into short-term correction or consolidation
🔮 Possible Scenarios Ahead
✅ Bullish Case:
If Sensex can reclaim and hold above 80,200, a breakout rally toward 80,800–81,000 is possible
⚠️ Bearish Case:
If it breaks below 79,400, the index could fall to 78,800, which is the 20-day moving average and prior swing support
🔄 Consolidation Case:
If it trades between 79,400–80,200 for a few days, it would be in a range-bound phase, waiting for new cues
🧠 Strategy Suggestions
Intraday Traders: Look for reversals near support/resistance. Volatility likely near 79,500 and 80,200.
Swing Traders: Avoid fresh long positions until SENSEX closes above 80,300. Short only below 79,400.
Investors: Trend is healthy but wait for a correction before adding large-cap positions.
✅ Conclusion
SENSEX on July 23, 2025, showed clear signs of resistance at 80,200 and closed lower. Although the broader trend remains intact, today’s action hints at short-term profit booking and potential consolidation.
Be watchful of the 79,400–79,500 support zone tomorrow. A break below this could trigger further weakness, while holding above it could stabilize the index.
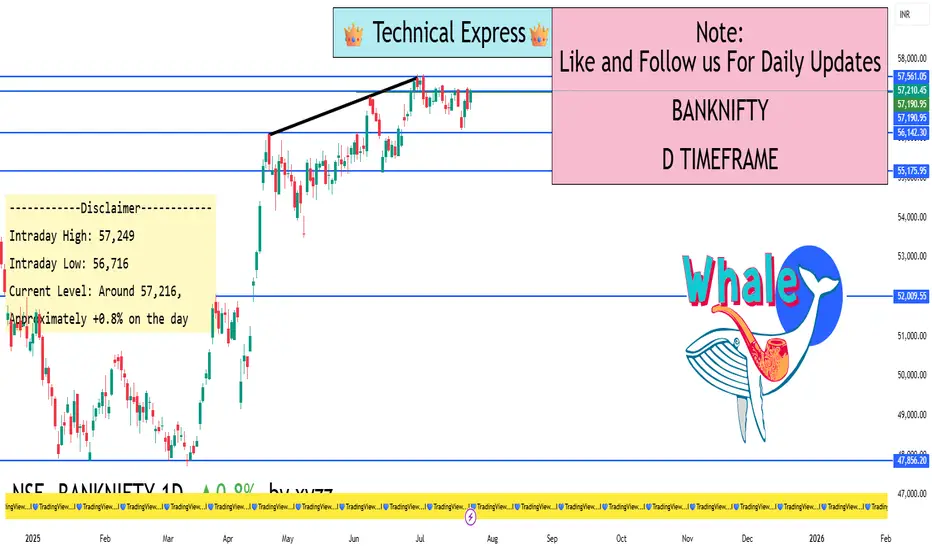
BANKNIFTY 1D TIMEFRAME📉 Market Overview
On the daily chart (1D timeframe), Bank Nifty showed signs of weakness today. It opened strong in the morning, moved higher during the first half, but faced selling pressure at higher levels and eventually closed near the day’s low.
This kind of price movement typically indicates short-term bearish sentiment and hesitation among buyers at higher levels.
📌 Key Market Data
Open: Around 57,200
High: Near 57,286
Low: Around 56,692
Close: Approximately 56,756
Net Change: Down by around 0.35% for the day
🔍 Candlestick Pattern
The candle formed today is bearish in nature. It could resemble something like a dark cloud cover or inverted hammer depending on the exact structure. This shows that bulls tried to push prices higher, but bears took over by the end of the session.
This candle near a resistance level usually suggests a reversal or at least a pause in upward momentum.
🔧 Technical Indicators (Daily Chart)
RSI (Relative Strength Index): Around 50–52
This shows a neutral zone — neither overbought nor oversold. It means the index has room to go either way depending on market sentiment.
MACD (Moving Average Convergence Divergence): Slightly positive
The MACD line is still above the signal line, showing some bullish momentum is intact — but it's fading.
Moving Averages:
20-day EMA: Bank Nifty closed below this line, showing short-term weakness.
50-day SMA: Still holding above this line, so the broader trend remains mildly bullish.
📊 Price Action Summary
Bank Nifty failed to break above the 57,300 zone.
Sellers became active at higher levels, pushing the index down.
Closing near the day's low shows bearish pressure is currently dominant.
The index is moving in a range, with no clear trend yet.
📈 What to Watch for Tomorrow
✅ Bullish Scenario:
If Bank Nifty moves above 57,300 with volume, we may see it head toward 57,500–57,800 in the next few days. This would indicate bulls are regaining control.
⚠️ Bearish Scenario:
If it breaks below 56,600, a further drop toward 56,000 is likely. This would be a signal that short-term correction is underway.
🔄 Sideways:
If the price stays between 56,600 and 57,300, the market is consolidating and waiting for a trigger (earnings, global news, RBI policy, etc.)
🎯 Strategy Outlook
Intraday traders: Be cautious near resistance (57,300) and support (56,600). These are zones where reversals happen.
Swing traders: Watch for a clear breakout or breakdown before taking big positions.
Options traders: Expect volatility to rise if it breaks out of the current range.
📌 Conclusion
Bank Nifty on the daily chart is showing signs of indecision and minor weakness. The index is stuck in a tight range, and traders are waiting for a clear breakout above resistance or breakdown below support. Until then, range-bound trading with proper stop-loss is advised.
If you’d like the same type of analysis for Nifty 50, Sensex, or specific stocks like Reliance or HDFC Bank, just ask — I’ll deliver them without links and in the same easy language.
NIFTY 1D TIMEFRAME🟢 Market Overview
Current Status: Nifty 50 opened with strength today, showing positive momentum.
Previous Close: Around 25,123
Today’s Opening: Roughly +60 to +90 points higher, showing bullish intent
Intraday Range: Between 25,100 (Low) and 25,290 (High)
Current Price (as of late afternoon): Trading around 25,270 to 25,285, indicating a +0.6% to +0.7% gain
🔍 Technical Structure
📈 Trend:
Nifty remains in a bullish trend on the daily chart. Price is holding above 21-EMA and 50-EMA, a sign of strength. The recent breakout above 25,100 confirms bullish continuation.
💹 Candlestick Pattern:
The current candle is forming a strong green bar with minor upper wick – indicating buyers are in control.
Past few candles show a rising channel or ascending triangle, suggesting higher highs and higher lows.
📊 Key Technical Levels
Level Type Price Zone Description
🔼 Resistance 25,300 – 25,350 Immediate resistance zone
🔽 Support 25,050 – 25,100 Strong support (breakout retest area)
📉 Deeper Support 24,800 – 24,900 Demand zone if correction happens
🔁 Indicators Summary
RSI (Relative Strength Index): Around 65–68, in bullish territory but not overbought
MACD: Positive crossover still active, supporting bullish momentum
Volume: Healthy volume on green days, slightly higher than red days — bullish sign
🧠 Price Action Summary
Nifty broke out from a consolidation range between 24,800–25,100
The breakout is holding above the resistance now turned into support, showing market strength
No major reversal patterns spotted yet – trend is intact unless we see heavy selling with volume
🔮 Possible Scenarios
✅ Bullish Case
If Nifty breaks above 25,300, expect move toward 25,450 – 25,500 in coming days
Strength in banking, IT, and auto sectors support this view
⚠️ Bearish Case (Short-Term Only)
If it closes below 25,100, could test 24,800 in short term
Watch for sudden global triggers or heavy profit booking
📦 Sector Performance Overview
🔋 Strong: Banking, Auto, FMCG
🛑 Weak/Flat: Realty, Pharma, Metal
📝 Expert Notes
Institutional buying seen in index-heavyweights like HDFC Bank, Reliance, and TCS
FIIs (Foreign Institutional Investors) have shown net buying in the last two sessions
Market breadth is positive – more stocks advancing than declining
📌 Conclusion
Nifty 50 is showing strong bullish momentum on the 1D chart. Unless we see a sudden breakdown below 25,100, the trend remains positive. A breakout above 25,300 will add more fuel to the rally, possibly pushing the index toward 25,500+ in the coming sessions.
Ideal strategy: Buy on dips near 25,100–25,150 with a stop loss below 25,000 and upside targets of 25,300–25,500.

Trading Master Class With Experts🔰 Introduction
In today’s fast-moving financial markets, trading has evolved from basic buying and selling to data-driven strategies, advanced analysis, and systematic execution. A Trading Master Class With Experts is not just another course—it’s a comprehensive mentorship program that bridges the gap between beginner-level knowledge and professional-level performance.
This class is designed for those who are serious about trading as a skill, business, or career, and who want to learn directly from experienced traders, analysts, and market strategists. The program focuses on real-time learning, practical strategies, market psychology, and risk management, giving participants the tools to trade confidently and consistently.
🎯 Objective of the Master Class
The primary goal of the Trading Master Class With Experts is to transform retail traders into independent, strategy-based professionals. It’s structured to help you:
Understand how markets really work
Learn proven strategies from professional traders
Avoid common beginner mistakes
Build and test your own trading system
Develop the mindset and discipline of institutional-level traders
🧠 What You Will Learn
This master class covers a holistic approach to trading with a strong focus on practical execution, including:
🔍 1. Market Basics & Trader Foundation
How stock markets work
Key players: Retail vs Institutions
Types of markets: Bullish, Bearish, Sideways
Trading styles: Intraday, Swing, Positional, Scalping
Asset types: Equity, Derivatives, Forex, Crypto, Commodities
🕯️ 2. Technical Analysis
Reading and analyzing candlestick patterns
Support and Resistance theory
Trend identification and trendline accuracy
Price Action-based entry and exit techniques
Volume analysis and institutional behavior spotting
📊 3. Indicators and Tools
Moving Averages (SMA, EMA)
RSI, MACD, Bollinger Bands, Supertrend
Fibonacci retracement and projection
Volume Profile and VWAP
How to avoid indicator overloading
🧱 4. Chart Patterns & Setups
Reversal patterns: Double Top/Bottom, Head and Shoulders
Continuation patterns: Flags, Pennants, Triangles
Breakout trading vs Pullback trading
Building entry/exit rules with confirmation signals
🧮 5. Options and Futures Trading (Optional Module)
Understanding Calls and Puts
Option chain analysis and Open Interest
Option Greeks (Delta, Theta, Vega, Gamma)
Directional vs Non-directional option strategies
Institutional Option Trading Techniques
💹 6. Risk Management
Capital allocation methods
Risk-to-reward ratio and win-rate planning
Stop-loss and trailing stop methods
Diversification and exposure control
Avoiding overtrading and emotional decisions
🧘 7. Trading Psychology & Discipline
How to handle losses without fear
Dealing with greed and overconfidence
Mindset of a consistent trader
Journaling, post-trade analysis, and routine building
💻 8. Live Trading & Practical Learning
Real-time market sessions with expert commentary
Watching experts plan, execute, and review trades
Hands-on assignments and trade simulations
Market opening/closing routines
Building your personal trading plan
🔧 Advanced Topics (for Experienced Traders)
Institutional Trading Strategies
Smart Money Concepts
Volume Spread Analysis (VSA)
Multi-leg Option Strategies
Algo-trading basics (optional)
Trading Journals and performance analysis tools
👨🏫 Who Are the Experts?
This master class is conducted by a team of seasoned professionals:
Full-time traders with 10+ years of market experience
Certified technical analysts and SEBI-registered mentors
Option strategists and quantitative traders
Risk managers and trading psychologists
They provide you with:
Live mentorship
Real trade breakdowns
Direct Q&A sessions
Feedback on your trading plans
👥 Who Should Join This Master Class?
This program is ideal for:
Aspiring traders who want to start with clarity
Traders stuck at breakeven or in losses
Professionals looking to become part-time traders
Students or working individuals with serious interest in trading
Anyone who wants to trade like an institution, not a gambler
📜 Certification & Support
Upon completion, you will receive:
A certificate of participation
Access to recorded sessions
A trading toolkit: Checklists, planners, and journals
Lifetime access to community/mentorship group
🧭 Final Words
A Trading Master Class With Experts is not about shortcuts or tips. It’s a structured pathway to build you into a professional-level trader who understands risk, follows a system, and survives long-term.
Markets will always test you—but this master class gives you the skills, mindset, and mentorship to pass every test with confidence.

Master Institutional Trading✅ Introduction: What Is Institutional Trading?
Institutional trading refers to the strategies and market activities carried out by big players—like hedge funds, mutual funds, insurance companies, foreign institutional investors (FIIs), banks, and proprietary trading firms.
Unlike retail traders (individuals), institutions manage large capital, influence markets, and use advanced data-driven strategies to enter and exit positions silently and smartly.
"Master Institutional Trading" is all about learning how these big players operate, how they make decisions, and how you—an individual trader—can read their moves and trade alongside the smart money instead of against it.
🧠 Why Learn Institutional Trading?
Most retail traders lose money because they trade emotionally or follow the crowd. Institutional traders, on the other hand:
Follow data, not emotions
Trade with discipline and risk management
Use volume, price action, and order flow
Focus on capital protection as much as profits
Mastering Institutional Trading helps you:
Understand how smart money moves
Identify hidden demand and supply zones
Trade with precision using volume and price action
Avoid retail traps and manipulation zones
Develop a rule-based, professional approach
📘 What You Learn in Master Institutional Trading
Here’s what a full-fledged Master Institutional Trading program or strategy guide includes:
1️⃣ Market Structure: Understanding the Battlefield
Difference between retail and institutional behavior
Market cycles: Accumulation → Manipulation → Distribution
Price action and how institutions create fake breakouts
Liquidity hunting: How institutions trap retail traders
2️⃣ Smart Money Concepts
Smart money refers to capital controlled by professional institutions. You’ll learn:
How to track smart money footprints
Concepts like Order Blocks, Liquidity Zones, Fair Value Gaps (FVG)
Role of volume spikes and open interest in showing big trades
How smart money builds positions slowly to avoid moving the market
3️⃣ Volume Profile and Order Flow
Institutional traders focus on volume and flow, not indicators.
How to use Volume Profile (POC, Value Area High/Low)
Footprint charts and Delta analysis
How to read Buy vs Sell pressure
Spotting imbalances where smart money takes control
4️⃣ Institutional Candlestick Behavior
Candles tell a story—especially when institutional players are involved.
You’ll learn:
Master Candle setups
Break of Structure (BOS) and Change of Character (CHOCH)
Identifying manipulation wicks and liquidity grabs
Candlestick rejections at key institutional levels
5️⃣ Option Chain Analysis (Institutional Option Trading)
Institutions use options to hedge and speculate quietly.
Interpreting Open Interest (OI) data
Spotting institutional positions at strikes
Using PCR (Put Call Ratio) and Max Pain
Advanced option strategies like short straddles/strangles, iron condors
6️⃣ Institutional Risk Management
Institutions are masters of risk.
You will learn:
Capital allocation strategy
Stop-loss planning based on liquidity zones, not random points
Scaling into trades, position sizing
Trade management and profit-booking plans
7️⃣ Market Psychology & Trap Detection
Institutional traders create fake moves to trap retail traders.
How to avoid bull traps and bear traps
Understand news-based manipulation
The concept of dumb money vs smart money
Mindset training for following your edge
8️⃣ Building Your Institutional Strategy
The final goal is to trade like an institution, even with a small account.
You will build:
A structured plan based on smart money concepts
Entry/Exit criteria using price action + volume
Trade journaling system
Performance review framework
💼 Who Is This For?
"Master Institutional Trading" is ideal for:
Intermediate and advanced traders
Option traders looking to time entries better
Intraday, swing, and positional traders
Traders tired of using random indicators
Anyone serious about building a long-term profitable system
🧭 Real-World Application Examples
Bank Nifty Levels: Institutions often build positions using weekly options and defend key OI levels.
Nifty50 Zones: Watch for institutional buying during heavy dips or selling into rallies.
Futures Volume: A sudden spike in Bank Nifty Futures + Open Interest jump = Institutional entry.
Option Writers: At resistance zones, call writing increases sharply = probable reversal zone.
🎓 Conclusion
Mastering Institutional Trading is not about getting secret indicators or magic tips. It’s about understanding the market at its core—through price, volume, structure, and behavior of smart money.
Once you learn this, you stop following the herd. You become a confident, calm, data-driven trader who knows how to read the market like a pro.
🔹 Whether you're trading Nifty, Bank Nifty, stocks, or forex – the principles of institutional trading remain the same

Technical ClassA Technical Class for Trading is a structured learning program that helps aspiring traders understand how to analyze financial markets using technical analysis. Unlike guessing market movements or relying on news, technical analysis is a science of price behavior, built on charts, patterns, indicators, and market psychology. This class is essential for anyone who wants to become a self-reliant trader in stocks, options, futures, forex, or crypto.
✅ What You Learn in a Technical Trading Class
A good technical trading class teaches how to analyze price action, spot trading opportunities, and apply disciplined risk management. Here’s what’s typically covered:
📈 1. Introduction to Technical Analysis
What is Technical Analysis?
Difference between Technical and Fundamental Analysis
Importance of studying price action and volume
Types of traders: Day Trader, Swing Trader, Positional Trader, Scalper
🕯️ 2. Candlestick Chart Reading
Candlestick charts tell stories of price movement and trader psychology.
You'll learn:
Structure of a candlestick (open, high, low, close)
Key single candlestick patterns (Hammer, Doji, Marubozu)
Dual & triple patterns (Engulfing, Morning Star, Evening Star)
How to use candles to detect reversals or continuations
📊 3. Chart Types and Timeframes
Line chart vs Bar chart vs Candlestick chart
Timeframe selection for different trading styles:
Intraday (5 min, 15 min)
Swing (1 hour, 4 hour)
Positional (Daily, Weekly)
📌 4. Support and Resistance
What are support and resistance levels?
How to identify major levels using price action
Role of psychological round numbers
Breakouts and false breakouts
How to use them for entry, exit, and stop-loss
📉 5. Trend Analysis
Understanding the direction of the market is critical.
You will learn:
How to spot uptrends, downtrends, and sideways markets
How to draw trendlines correctly
Using price structure: Higher Highs / Higher Lows
Tools like Moving Averages to confirm trends
📐 6. Chart Patterns
Chart patterns help forecast future moves.
Key patterns covered:
Reversal Patterns: Head & Shoulders, Double Top/Bottom
Continuation Patterns: Flags, Pennants, Triangles
Breakout strategies and volume confirmation
⚙️ 7. Technical Indicators
Indicators help confirm entries and manage trades.
Most-used indicators:
Moving Averages (SMA/EMA)
Relative Strength Index (RSI)
MACD (Moving Average Convergence Divergence)
Bollinger Bands
Volume analysis
How to combine indicators for smarter entries
⏳ 8. Time, Volume & Volatility
Importance of volume spikes
Volatility analysis for risk management
Understanding market sessions and timing your trades
🎯 9. Risk Management
This is where most traders fail. A technical class teaches:
How much to risk per trade (1–2%)
Risk-to-reward ratios
Where to place a stop-loss
How to avoid revenge trading
Capital preservation first, profit later
🧠 10. Trading Psychology
Handling emotions: Greed, Fear, Impatience
Importance of discipline and patience
Building confidence through planning
Developing a trading journal and sticking to rules
⚡ 11. Practical Strategy Building
The real power of a technical class lies in combining all the knowledge to build strategies:
Trend-following strategy
Reversal setups
Breakout/breakdown trades
Momentum-based trades
Intraday vs swing setups
📚 Benefits of Joining a Technical Class
Learn systematic trading instead of gambling
Avoid common beginner mistakes
Practice through live market examples
Prepare to move toward professional-level trading
Save time by learning from expert mentors
🔎 Who Should Take a Technical Class?
Aspiring full-time or part-time traders
Stock market beginners
Intraday traders, swing traders, or positional investors
Option traders who want to improve timing
Anyone who wants clarity and structure in their trading
📌 Final Thoughts
A Technical Class for Trading is not just about indicators and charts. It’s about learning a structured, rule-based approach to understanding the market. It empowers you to make trading decisions confidently and helps you grow from a beginner to a skilled, strategy-driven trader.
Whether you’re trading stocks, Bank Nifty, Nifty50, or even crypto — technical analysis is your foundation. Learn it well, practice with discipline, and your chances of success in the markets will dramatically improve.

Institution Option TradingWhy Do Institutions Use Options?
Hedging Large Portfolios:
Institutional investors often manage portfolios worth billions. They use options to hedge against unexpected market movements.
✅ Example: A mutual fund holding a large amount of Nifty 50 stocks might buy put options on Nifty as insurance against market crashes.
Generating Income (Option Selling):
Institutions often sell options to earn consistent income (like premiums). They use strategies like covered calls or cash-secured puts to generate returns even in sideways markets.
Capital Efficiency:
Options provide leverage, meaning institutions can control large positions with relatively less capital. This helps them manage cash flow better.
Volatility Arbitrage:
Institutions track and exploit differences in Implied Volatility (IV) vs. Realized Volatility (RV). When the IV is overpriced, they may sell options; when it’s underpriced, they may buy.
Algorithmic and Quant-Based Trading:
Many institutions rely on algorithms and quantitative models that execute thousands of options trades based on volatility, delta exposure, or arbitrage opportunities.
Tools and Techniques Used by Institutions
🔹 1. Option Greeks Mastery
Institutional traders constantly analyze Delta, Gamma, Theta, Vega, and Rho to build and adjust complex positions:
Delta-neutral strategies are used to stay market-neutral.
Theta-positive positions (time decay advantage) are used for income.
Vega-sensitive positions help trade volatility instead of direction.
🔹 2. Open Interest and Volume Tracking
Institutions monitor Open Interest (OI) and volume build-up to identify where other big players are active. A sudden rise in OI on certain strikes may indicate accumulation or unwinding by institutions.
🔹 3. Option Chain Data + Order Flow Analysis
Institutions use Option Chain Analysis with depth data (buy/sell orders) to track smart money movement. Tools like Delta Hedging ratio calculators and OI heatmaps help them find critical levels.
🔹 4. Institutional Spread Strategies
They execute multi-leg strategies like:
Calendar spreads
Diagonal spreads
Ratio spreads
Iron Condors
Iron Butterflies
These are designed to control risk and reward precisely, often with market neutrality.
Examples of Institutional Option Strategies
✅ Covered Call Strategy:
Used by asset managers to generate extra returns on stocks they hold. They sell out-of-the-money calls on the stock positions.
✅ Protective Put Strategy:
A long-term investor may buy put options to protect their holdings against short-term downside risks (especially around earnings or global events).
✅ Straddle or Strangle Before Events:
Institutions sometimes buy or sell straddles/strangles before major events like:
Budget announcements
Central bank meetings
Election results
These help them play or hedge volatility without picking a direction.
Institutional Footprint: How to Spot It
As a retail trader, you can follow institutional activity by:
Watching sudden spikes in OI with price movement.
Observing IV movements before major events.
Looking at the Put/Call Ratio (PCR) and Max Pain points.
Analyzing volume build-up in deep ITM/OTM strikes.
Important: Institutions Are Often Option Sellers
Most institutions are option sellers because:
They have enough capital to absorb risk.
They manage trades professionally.
They benefit from time decay.
They hedge and adjust positions dynamically.
This is why most option premiums decay, and retail buyers often lose unless timed perfectly.
Conclusion
Institutional Option Trading is all about control, precision, and risk management. Institutions don’t look for jackpot trades. They build portfolios, hedge positions, generate consistent income, and use complex strategies that are rarely visible to retail eyes.
For retail traders aiming to "Trade Like Institutions", the path is:
Learn the Greeks deeply.
Understand volatility behavior.
Build strategies with proper risk-to-reward ratios.
Use data, not emotions.
Don’t chase profits—focus on consistency.
You can’t match institutions in capital, but you can definitely match them in discipline, knowledge, and system-based trading.

Option TradingWhat Is an Option?
An option is a financial contract that gives the buyer the right, but not the obligation, to buy or sell an underlying asset at a specific price (called the strike price) on or before a specific date (called the expiry date).
There are two main types of options:
Call Option – Gives the right to BUY the underlying asset.
Put Option – Gives the right to SELL the underlying asset.
🔹 Example:
If you buy a Call Option on Reliance with a strike price of ₹2,500 and the stock goes to ₹2,600, you can buy it at ₹2,500 and sell it at market for ₹2,600 – making a profit.
Basic Terminologies in Option Trading
Strike Price: The fixed price at which the option holder can buy or sell the asset.
Premium: The price paid to buy the option contract.
Expiry Date: The last date on which the option can be exercised.
Lot Size: The fixed quantity of the underlying asset in one options contract.
ITM/ATM/OTM (Moneyness):
In the Money (ITM): Option has intrinsic value.
At the Money (ATM): Strike price = current market price.
Out of the Money (OTM): Option has no intrinsic value yet.
Core Concepts of Option Trading
1. Option Buying vs Option Selling
Option Buyers pay a premium and have limited risk but unlimited profit potential.
Option Sellers (Writers) receive the premium but take on potentially higher risk.
2. Time Decay (Theta)
Options lose value as they approach expiry. This is called time decay. It works against buyers and in favor of sellers. Therefore, option sellers benefit more from time decay.
3. Volatility (Vega)
Volatility affects the premium of options. Higher expected volatility leads to higher premiums. Traders often use Implied Volatility (IV) and Historical Volatility (HV) to make trading decisions.
4. Option Greeks
Advanced traders use Greeks to measure different risks in an option:
Delta: Sensitivity to price change.
Gamma: Change in Delta with price movement.
Theta: Impact of time decay.
Vega: Impact of volatility changes.
Rho: Impact of interest rate changes.
Understanding Greeks is crucial for adjusting and managing option positions.
Popular Option Strategies
Once a trader understands calls and puts, they can use strategies combining multiple options:
✅ Single-Leg Strategies (Basic)
Buying Call or Put: Speculative strategy to profit from movement in one direction.
Selling Call or Put: Used to earn premium with a view that the market will stay flat or move in the opposite direction.
✅ Multi-Leg Strategies (Advanced)
Bull Call Spread: Buy one call and sell another at a higher strike. Used in moderately bullish outlook.
Bear Put Spread: Buy one put and sell another at a lower strike. Used in moderately bearish outlook.
Straddle: Buy a call and a put at the same strike and expiry. Used when expecting a big move, but unsure of the direction.
Iron Condor: Four-option strategy used in sideways markets to earn limited profits with limited risk.
Risk Management in Option Trading
Because options involve leverage, managing risk is crucial. Key practices include:
Position sizing: Only use a small portion of capital per trade.
Stop-loss and Target levels: Always have a predefined exit plan.
Avoid overtrading: Overuse of leverage leads to quick losses.
Understand margin requirements: Especially important for sellers.
Tools Used in Option Trading
Traders use various tools to analyze the market:
Option Chain Analysis: Shows available strike prices, premiums, and Open Interest (OI).
OI Data: High OI at certain strikes indicates strong support/resistance.
IV Chart: Helps spot overbought or oversold options.
Payoff Diagrams: Visual representation of potential profit or loss.
Why Trade Options?
Advantages:
Lower capital requirement
Multiple strategies in all market conditions
Potential for high returns
Useful for hedging equity positions
Disadvantages:
Complex for beginners
Time decay works against buyers
Can incur large losses if misused (especially in option selling)
Conclusion
Option trading offers a dynamic and powerful way to engage with the stock market. It provides flexibility, leverage, and a range of strategies to suit any market condition — bullish, bearish, or neutral. However, it's not a shortcut to riches. Success in option trading demands proper knowledge, discipline, and strategy. Whether you're a beginner or an advanced trader, continuously learning and practicing is key. Start small, understand the risk, and build a system that suits your trading psychology and capital.
If you master the fundamentals — Calls, Puts, Greeks, Time Decay, Volatility, and Risk Management — you can take your trading to the next level and even venture into the world of institutional-style trading strategies.

Advance Option TradingKey Concepts in Advanced Options Trading
Multi-Leg Strategies:
Advanced options trading heavily involves multi-leg strategies — using two or more options contracts in a single trade. Popular ones include:
Iron Condor: A neutral strategy involving four different options contracts to profit from low volatility. It generates a limited profit if the stock remains within a specific range.
Straddles and Strangles: Used when expecting a large price move, but unsure of the direction. Traders buy both a call and a put option.
Butterfly Spreads: These limit both risk and reward and are ideal when the trader believes the stock will stay near a specific price.
Adjustments and Rolling:
Unlike basic options traders who may let contracts expire, advanced traders constantly adjust positions. For example, if a trade moves against them, they may "roll" the position — closing it and reopening another at a different strike or expiry.
Understanding Option Greeks:
Advanced traders don’t just bet on direction; they manage exposure to:
Delta (Direction)
Gamma (Rate of change of delta)
Theta (Time decay)
Vega (Volatility sensitivity)
Rho (Interest rate impact)
This helps in building more calculated, data-driven trades.
Volatility Trading:
Volatility is key in advanced options. Some traders look to exploit Implied Volatility (IV) — pricing of future volatility — by trading IV crush around earnings or economic events. For instance, an Iron Condor may be used when IV is high, aiming to profit from the IV drop.
Directional vs. Non-Directional Trading:
Advanced traders often prefer non-directional strategies. These are setups where you can make money even if the market goes sideways, such as with Iron Condors or Calendar Spreads.
Risks in Advanced Options Trading
While the rewards can be higher, so are the risks. Complex strategies can lead to significant losses if misunderstood. Margin requirements can be high, and some trades may have unlimited loss potential (e.g., uncovered calls). Hence, strict risk management, stop-loss rules, and position sizing are essential.
Final Thoughts
Advanced options trading is not for beginners, but for those who want to move beyond simply guessing market direction. It’s about constructing trades that work in various market conditions — bullish, bearish, or sideways — and using volatility and time as weapons. With the right knowledge and discipline, advanced options can become a powerful tool in any trader’s arsenal. However, success requires education, continuous learning, and a clear understanding of risk and reward

Institutional Objectives in Options Trading🎯 1. Hedging Large Portfolios
One of the primary institutional goals is to protect investments from unfavorable market movements. Since institutions hold large quantities of stocks, they face massive risk if the market turns against them.
✅ Example:
A mutual fund holding ₹100 crore worth of Nifty 50 stocks might buy Put Options on Nifty to protect against a market crash.
This acts like insurance — a small premium is paid to avoid a huge loss.
🔹 This is called a protective put strategy.
📈 2. Generating Additional Income
Institutions also use options to generate consistent income. Since they often hold large amounts of shares, they can write (sell) options against these positions.
✅ Example:
Selling Covered Calls against stock holdings generates premium income, especially when expecting the market to remain sideways.
Writing Cash-Secured Puts allows them to earn premium while preparing to buy a stock at a lower price.
🔹 This enhances portfolio returns without needing to sell the core holdings.
📉 3. Managing Volatility Exposure
Volatility is a double-edged sword. Institutions analyze and trade implied volatility (IV) rather than just direction. They adjust their portfolios using options to profit from volatility changes or to reduce risk when volatility spikes.
✅ Common practices:
Use straddles and strangles before major events like earnings or elections.
Buy options when IV is low (expecting a spike) and sell options when IV is high (expecting it to drop).
🔹 This is called volatility arbitrage or vega trading.
🔁 4. Portfolio Adjustment and Rebalancing
Institutions use options to rebalance exposure without triggering capital gains taxes or disturbing existing stock positions.
✅ Example:
Instead of selling shares, an institution might:
Buy puts to reduce downside risk.
Sell calls to lock in profits.
Use spreads or collars to control price bands of risk/reward.
🔹 This helps in making tactical moves without liquidating long-term holdings.
💡 5. Directional Bets With Limited Risk
Though not their primary objective, institutions sometimes make directional bets using options for leveraged exposure, with defined risk.
✅ Example:
If a fund expects a strong upside in a stock, it might buy call options instead of the stock itself.
This reduces capital requirement and limits downside to the premium paid.
🔹 This is common in event-driven trading, such as earnings, mergers, or regulatory announcements.
🔄 6. Capital Efficiency
Institutions are under constant pressure to manage capital efficiently. Buying or selling options allows them to control larger positions with less money, keeping more capital available for other trades.
✅ Example:
Instead of buying 1,00,000 shares of a company, they might buy deep ITM call options to replicate stock movement with lower capital.
🔹 This is known as synthetic long exposure.
⚖️ 7. Risk Transfer and Insurance
Options allow institutions to transfer market risk to willing counterparties. They use customized derivatives or listed options to insure specific risks, such as:
Currency risk
Interest rate risk
Commodity price risk
Equity drawdowns
🔹 Large institutions like banks and insurance firms use over-the-counter (OTC) options for complex hedging.
🛠️ 8. Complex Strategy Execution
Institutions often use multi-leg strategies for market-neutral setups or for fine-tuned payoff structures. These include:
Iron Condors
Butterfly Spreads
Calendar/Diagonal Spreads
Box Spreads
Delta-neutral gamma scalping
🔹 These allow fine control over expected profits and losses, based on volatility, time decay, and price movement.

Institutional Trading StrategiesWhat is Institutional Trading?
Institutional trading means the buying and selling of stocks, futures, options, and other financial instruments by large organizations. These organizations are often:
Mutual Funds
Pension Funds
Hedge Funds
Banks and Insurance Companies
Foreign Institutional Investors (FII)
Domestic Institutional Investors (DII)
Unlike retail traders who trade with small amounts of capital, institutional players move huge sums of money, sometimes trading in crores or billions in a single day.
Why Do Institutions Trade Differently?
Institutions have massive capital, so their approach is completely different:
They can’t enter or exit a stock quickly without moving its price.
They focus more on long-term positions or large short-term trades.
They use advanced tools like algorithms, high-frequency trading, and exclusive market data.
In simple words: they trade like whales in the ocean, while retail traders are like small fish.
Core Institutional Trading Strategies Explained
1. Order Flow and Volume Analysis
Institutions often leave their footprint in the market by how much they buy or sell. This is visible through volume spikes and order flow. Retail traders can track this by:
Watching unusual volume on a stock
Monitoring delivery percentage (for cash segment)
Using indicators like VWAP (Volume Weighted Average Price) to see where large trades are happening
Institutions use volume as a key indicator because when big money flows in, prices generally follow.
2. Order Block and Supply-Demand Zones
Institutions don’t buy stocks in one go. They accumulate positions slowly within certain price ranges. These areas are called:
Order Blocks – zones where large buying or selling has happened in the past.
Supply-Demand Zones – areas where the market reacts due to prior institutional activity.
When price comes back to these zones, you will often see a strong bounce (demand) or rejection (supply).
3. Breakout and False Breakout Manipulation
Institutions are masters of manipulation. They often cause:
False Breakouts to trap retail traders.
Breakdown traps to collect positions cheaply.
You will see prices breaking key levels (like support or resistance), triggering retail stop losses, and then reversing sharply. Institutions use liquidity from these retail stop losses to enter or exit positions.
4. Volume Weighted Average Price (VWAP) Strategy
Most institutions benchmark their trades around VWAP.
When prices are above VWAP, the bias is bullish.
When prices are below VWAP, the bias is bearish.
Institutions often buy when price retraces to VWAP after a breakout and sell when it tests VWAP after a breakdown. VWAP acts like a fair value line for many large traders.
5. Liquidity Hunting and Stop Loss Fishing
Institutions need liquidity to place large orders. So they create fake moves:
Push prices higher to make retail buy, then sell into it.
Push prices lower to trigger retail stop-losses and then reverse the price upwards.
This is why retail traders often feel the market is “hitting my stop-loss and then moving in my direction”.
6. Options Data Analysis
Institutions hedge their cash and futures positions using options:
High Open Interest (OI) at certain strike prices indicates important levels.
Sudden OI build-up can show institutional call writing (bearish) or put writing (bullish).
Institutions use Option Selling strategies because time decay (theta) works in their favor.
Retail traders can track option data to understand institutional bias, especially around expiry.
7. Algorithmic Trading (Algo Trading)
Institutions use computers (algos) to execute trades based on pre-defined rules:
Speed: Algos trade in microseconds.
Precision: No emotions, just system-based entries and exits.
Scalability: Handles thousands of orders simultaneously.
You can’t compete with algos on speed, but you can follow the flow by watching patterns like sudden large candles without news or price bouncing off VWAP repeatedly.
8. Fundamental Catalysts Trading
Institutions also trade based on news, earnings, and economic data:
Positive quarterly results → gradual accumulation before the news
Interest rate changes → repositioning in banking stocks
Government policy changes → entering sectors like infrastructure or defense
They often buy early before the public knows and sell after retail traders start entering.
9. Sector Rotation Strategy
Institutions rotate money between sectors:
Moving from IT to Banks
From FMCG to Auto
From Metal to Pharma
Retail traders get stuck chasing one stock, while institutions follow where big sector money is flowing. You can track sector indices (like Nifty Bank, Nifty Auto) to ride these moves.
10. Index Balancing Strategy
In indices like Nifty 50 or Sensex, institutions adjust portfolios based on:
Index addition/removal
Rebalancing due to quarterly reviews
Passive fund flows
Stock prices often jump or fall sharply around these events, giving smart traders easy trading opportunities.
How to Identify Institutional Activity as a Retail Trader
Look for unusual volume spikes
Watch for rejection or breakout around order blocks
Use VWAP as a guidance tool
Track option chain data before key events
Follow sector rotation via index charts
Watch price-action near important news events
Practical Tips for Retail Traders
Trade less, trade better: Institutions don’t chase every small move, neither should you.
Wait for confirmation: Let institutions show their hand through volume before entering.
Avoid emotional trades: The market is designed to make you emotional — don’t fall for it.
Risk management is king: Institutions have risk teams; you must use stop-loss.
Never blindly follow tips: By the time you hear news, institutions are already in or out.
Why Institutional Strategies Work Better
Institutions follow a data-driven approach backed by:
Risk management policies
Trained analysts
Large capital to manage volatility
No emotional trading
Use of technology (Algos)
Retail traders who respect market structure and trade alongside institutions improve their win rate dramatically.
Final Thoughts
Institutional Trading is all about structure, discipline, and patience. It’s not about guessing but about observing market behavior — where are the big players active? Why is volume rising? Where is liquidity flowing?
You don’t need huge capital to benefit from institutional strategies. You simply need to follow the footprints, avoid traps, and focus on high-probability trades.
Option Trading Advanced Strategies📌 Introduction: Why Go Beyond Basic Options?
Basic option strategies like buying calls or puts, or even covered calls, offer simplicity—but they don’t fully unlock the potential of options as a strategic tool.
When you enter the advanced territory, you gain the power to:
Profit in sideways markets
Neutralize directional risks
Create high-probability income
Minimize drawdowns
Take advantage of volatility shifts
Advanced strategies require you to understand multi-leg positions, greeks, risk/reward shaping, and market timing.
Let’s break it all down into clear, real-life explanations.
🧩 1. Iron Condor – Profit in Range-Bound Markets
🔍 What is it?
An Iron Condor involves selling a call spread and a put spread at the same time, expecting the stock/index to stay in a tight range.
🔧 Construction:
Sell 1 OTM Call
Buy 1 further OTM Call
Sell 1 OTM Put
Buy 1 further OTM Put
All with same expiry.
🎯 Ideal Market View:
Market is range-bound
You expect low volatility
No major event expected
💰 Max Profit:
Occurs when stock expires between the two short strikes
⚠️ Max Loss:
Happens when stock moves beyond outer strikes
✅ Why use it?
Generates monthly income
Defined risk
High probability if used smartly
⚖️ 2. Butterfly Spread – Profit from Precision
🔍 What is it?
The Butterfly Spread is a neutral strategy where the trader expects the stock to close near a specific price.
🔧 Construction (Call Butterfly):
Buy 1 ITM Call
Sell 2 ATM Calls
Buy 1 OTM Call
All with same expiry.
🎯 Ideal Market View:
You expect stock to move very little
Great for expiry day setups or low-volatility trades
💰 Max Profit:
When stock closes exactly at strike price of sold calls
⚠️ Max Loss:
When price moves significantly up or down
✅ Why use it?
Cheap entry cost
Controlled risk
Can return 200–300% with precise movement
🌀 3. Calendar Spread – Play on Time and Volatility
🔍 What is it?
A Calendar Spread profits from time decay and implied volatility expansion.
🔧 Construction:
Sell 1 Near-Term Option
Buy 1 Longer-Term Option
Same strike, same type (Call or Put)
🎯 Ideal Market View:
Expect stock to stay around strike price in short term
Expect volatility to increase
💰 Max Profit:
When the short-term option decays and stock remains near the strike
⚠️ Max Loss:
If stock makes a strong move or IV drops unexpectedly
✅ Why use it?
Good for earnings events
Plays time + volatility
Low capital strategy
💡 4. Ratio Spread – When You Want a Controlled Gamble
🔍 What is it?
A Ratio Spread involves selling more options than you buy (like buying 1 Call and selling 2 Calls). It’s directional but nuanced.
🔧 Construction (Call Ratio Spread):
Buy 1 ATM Call
Sell 2 OTM Calls
You can reverse for puts if bearish.
🎯 Ideal Market View:
Expect a mild bullish move, not a breakout
Moderate volatility
💰 Max Profit:
When stock closes near the short strike
⚠️ Max Risk:
If stock moves too much upward, losses can be unlimited (unless hedge is applied)
✅ Why use it?
High reward-to-risk if market behaves
Can be converted into a risk-free structure using debit/credit adjustments
🏹 5. Straddle and Strangle – Playing Big Moves
🔍 What is it?
Straddle and Strangle are volatility-based strategies.
Straddle = Buy Call + Buy Put at same strike
Strangle = Buy OTM Call + Buy OTM Put
🎯 Ideal Market View:
Expect a big move but unsure of direction
Perfect for events: earnings, budget, Fed announcements
💰 Max Profit:
When market makes a big move, either up or down
⚠️ Max Loss:
When market stays flat
✅ Why use it?
Useful before news or big breakout
Non-directional but aggressive
🧮 6. Delta-Neutral Trading – Profit Without Direction
🔍 What is it?
Delta-neutral trading aims to neutralize directional risk (delta = 0) using a combination of options and/or futures.
💡 Example:
Sell ATM Call + Buy underlying stock in proportion so total delta = 0
Or balance long and short options across strikes
🎯 Ideal Market View:
Expect volatility or time decay
No strong directional bias
✅ Benefits:
Income generation regardless of market direction
Hedged and flexible
🔁 7. Rolling Strategies – Actively Adjust for Profit
🔍 What is it?
Rolling means shifting an existing position to a new strike or expiry to manage risk or lock profit.
Use Cases:
Roll down puts in falling market
Roll up calls in bull trend
Roll to next expiry to extend time decay
✅ Benefits:
Dynamic control
Prevents stop-loss triggers
Protects profits in trending markets
🛑 Risk Management Tips for Advanced Traders
Always define max loss – Use spreads, not naked trades
Check IV before trading – High IV = sell premium; Low IV = buy premium
Position sizing – Never go all-in on a strategy
Use alerts and automation – Advanced strategies need fast reaction
Avoid illiquid options – Stick to Nifty, Bank Nifty, liquid stocks
Paper trade first – Test complex strategies without real money
📈 Real-Life Example – Iron Condor on Nifty
Let’s say Nifty is at 24,300 and expiry is 7 days away. You expect Nifty to stay between 24,000 and 24,600.
Trade Setup:
Sell 24,000 Put
Buy 23,800 Put
Sell 24,600 Call
Buy 24,800 Call
Net credit: ₹50–60
Max Profit: ₹50 if Nifty stays between 24K–24.6K
Max Loss: ₹150 if market breaks either side
This gives a 1:3 risk-reward with 70%–75% probability.
💬 Final Thoughts
Advanced option strategies aren’t about gambling—they’re about precision, hedging, and income generation with structure. They offer you more control than simple buying/selling.
But with more power comes more responsibility:
Know your market view
Know the structure of your strategy
Know when to adjust or exit
Once you understand how to read volatility, manage risk with Greeks, and construct defined-risk trades, options can become your most flexible and profitable tool in the market.
Sensex 1D Timeframe
📈 Sensex (BSE 30) Today’s Overview (1D Time Frame)
Opening Level: Sensex opened higher around 82,350 to 82,500 points, continuing the positive momentum from previous sessions.
Intraday High: Reached around 82,530 in the first half of the session.
Intraday Low: Dropped to approximately 82,170–82,200 in the afternoon session.
Current Trading Range: Mostly trading between 82,200 and 82,500 levels, with a slight upward bias.
Previous Close: Around 82,180–82,200.
Net Change: Trading +0.2% to +0.3% higher, showing slight gains.
🔍 Key Market Drivers Today
Positive Impact:
Strong earnings from banking stocks, especially HDFC Bank and ICICI Bank, are boosting index strength.
Eternal Group (parent of Zomato) surged significantly, adding positivity to market sentiment.
Low volatility today, with India VIX falling, indicating reduced fear in the market.
Negative Impact:
Realty, PSU Banks, and Media sectors underperformed, capping higher gains.
Profit booking seen in auto and pharma stocks, causing minor mid-session dips.
📝 Technical Summary
Trend: Overall uptrend remains intact, with minor intraday corrections.
Support Levels: Immediate support around 82,170–82,200 zone.
Resistance Levels: Strong resistance around 82,500–82,550, breakout beyond which could take Sensex toward 83,000.
Volatility: Low volatility suggests possible slow and steady upward movement
✅ Summary Conclusion
Today, Sensex is mildly positive, driven by financial sector strength and earnings momentum. Some sector rotation is visible with pockets of weakness in PSU and Realty stocks. Volatility remains low, supporting a controlled trading session with limited intraday swings.

Nifty 1D Timeframe📈 Nifty 50 – Market Overview
Opening Level: Nifty 50 opened positive above 25,100, continuing momentum from the previous session.
Intraday High: Touched around 25,166 during the early session.
Intraday Low: Hovered around 25,111 in the later session.
Current Range: Mostly trading between 25,110 to 25,160, with a slight upward bias.
Previous Close: Around 25,090.
Current Gains: Around +0.1% to +0.3% for the day.
🔍 What’s Driving Nifty Today
Banking Sector Strength: Strong performance from HDFC Bank, ICICI Bank, and other financial stocks lifted the index.
Quick Commerce Rally: Companies like Eternal (Zomato parent) showed double-digit gains, adding upward pressure.
Volatility Decline: The India VIX dropped nearly 3%, suggesting reduced market fear and more stable price action.
Mid-Session Profit Booking: Sectors like Realty, Pharma, and Media witnessed some selling, causing small dips during the day.
📊 Technical Snapshot
Support Level: Immediate support seen around 25,100, below which the next strong zone is around 24,950.
Resistance Level: Strong resistance around 25,160–25,200, with breakout potential toward 25,300–25,400 if breached.
Trend Outlook: The market is holding a bullish tone, with minor intraday corrections typical in a trending market.
💡 Traders’ Perspective
Direction Trigger Level Expected Move
Bullish Scenario Above 25,166–25,200 Target next zone between 25,300–25,400
Neutral/Range-bound Between 25,100–25,160 Choppy movement, watch sector rotation
Bearish Scenario Below 25,100 Possible quick slide toward 24,950–25,000
✅ Summary
Today’s session on Nifty 50 shows mild positivity driven by financial stocks and quick-commerce momentum. The market remains range-bound near recent highs, with sectors like realty and pharma underperforming. The index is showing strength above 25,100, and a breakout above 25,200 could lead to further upside in the coming days
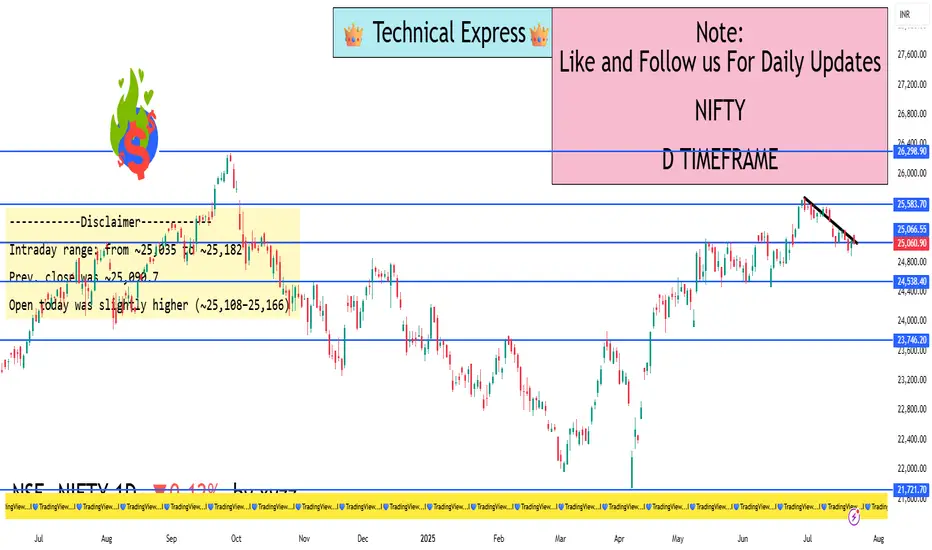
Banknifty 1D Timeframe📈 Bank Nifty – Market Overview
Opening Price: Opened strong near 57,250–57,300.
Intraday High: Touched around 57,286 in early trading hours.
Intraday Low: Dropped towards 56,730 during mid to late session.
Current Trading Range: Between 56,730 and 57,280, with a mild negative bias.
Previous Close: Around 56,953.
Current Loss: Trading -0.3% to -0.5% lower compared to previous close.
🔍 Key Drivers Today
Private Banks Hold Strength: Stocks like HDFC Bank and ICICI Bank showed resilience, limiting the downside.
PSU Banks Under Pressure: Public sector banks including SBI, PNB, and Canara Bank underperformed, causing the index to drift lower.
Profit Booking Seen: After an early positive move, intraday profit booking pulled the index back.
Low Volatility: Reduced intraday swings, though a narrow downtrend was visible after the first hour.
📊 Technical Picture
Support Zone: Strong support is visible around 56,730–56,700. A breach could see a quick move toward 56,500–56,000.
Resistance Zone: Resistance remains at 57,250–57,300. If this level is crossed, the next upside target is around 57,500–57,700.
Trend Bias: Neutral to bearish for the day due to selling pressure after opening strength.
✅ Summary Conclusion
Bank Nifty is showing slight weakness today, mainly dragged by public sector banks. The index gave up early gains, but private banks kept the fall in check. Current range is 56,730–57,280. Watch for either a bounce above 57,300 or a break below 56,700 for the next clear trend direction.

Reliance 1D Timeframe📊 Reliance Industries – Intraday Overview
Previous Close: ₹1,428.6
Opening Price: Opened slightly lower around ₹1,427–₹1,431.
Intraday High: Approximately ₹1,432 during early session.
Intraday Low: Dropped towards ₹1,410 during the mid-session.
Current Trading Price: Trading near ₹1,415, showing around 0.9% to 1% decline from the previous close.
🔍 Key Reasons for Movement Today
Post-Earnings Pressure: After recent earnings, Reliance faced profit booking as some investors booked gains following a previous rally.
Sector Weakness: Energy and telecom segments showed subdued strength while retail remained flat.
Heavy Volume: Trading volume remained above average, suggesting active participation from institutions and retail traders.
📈 Technical Snapshot
Immediate Support Zone: ₹1,410–₹1,412. If this breaks, next support could be near ₹1,400.
Immediate Resistance Zone: ₹1,430–₹1,432. A breakout above this may lead towards ₹1,440–₹1,450.
Trend Positioning: Reliance is currently below its short-term (20-day) moving average, indicating mild short-term weakness but no major breakdown.
💡 Intraday Strategy Levels
Scenario Trigger Point Expected Move
Bullish Reversal Above ₹1,432 Potential upside towards ₹1,445–₹1,450
Neutral/Bearish Between ₹1,410–₹1,430 Consolidation zone with limited moves
Breakdown Risk Below ₹1,410 Could slide to ₹1,400 or even ₹1,390 short-term
✅ Summary Conclusion
Reliance is trading with a mild negative bias, with price action holding between ₹1,410–₹1,432. The overall short-term structure remains weak after intraday profit booking, but key support is holding near ₹1,410. Watch for recovery above ₹1,432 for any bullish reversal or break below ₹1,410 for further downside.