Ethereum Technical Analysis for the Week of June 16-June 231. Price Overview
Current Price: As of June 16, 2025, Ethereum's price is approximately $2,610.36 USD, with a 24-hour trading volume of $16.83 billion USD. It is up 2.59% in the last 24 hours.
Market Cap: Ethereum holds the #2 rank with a live market cap of $315.13 billion USD. Circulating supply is 120.72 million ETH.
Recent Performance:
Over the last 7 days, ETH has risen by 20%, showing strong upward momentum.
In the past month, ETH increased by 16.61%, adding an average of $624.97 to its value.
ETH has underperformed compared to Bitcoin in 2025 but shows signs of recovery with institutional interest growing.
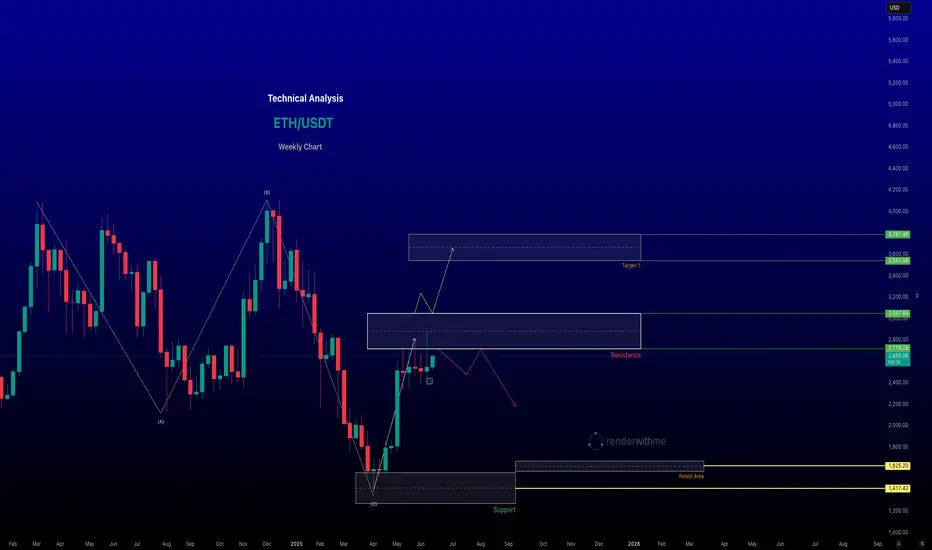
# Support and Resistance Levels:
Support: Key support is around $2,160–$2,020
Resistance: Immediate resistance lies between $2,739–$2,850. A breakout above $2,800–$3,000 could target $3,400–$4,100.
-- Disclaimer --
This analysis is based on recent technical data and market sentiment from web sources. It is for informational purposes only and not financial advice. Trading involves high risks, and past performance does not guarantee future results. Always conduct your own research or consult a SEBI-registered advisor before trading.
#Boost and comment will be highly appreciated
Bitcoinusd
Bitcoin (BTC) Technical Analysis for the Week of Jue 02 -June 09Technical Analysis
Price Action: Bitcoin is consolidating around $105,000–$108,000 after a sharp rally from April lows (~$74,000) and a peak near $112,000. A recent 3% correction was driven by profit-taking, with BTC stabilising near $106,000.
Trend: Medium-term trend remains bullish, but momentum is slowing. BTC has broken the previous resistance , indicating a potential slower rise or horizontal movement.
Note : Indicator MACD making bearish diversions in my view its not strong .
Key Levels:
Support: ~$102,600–$103,500 (recently tested)
Resistance: ~$106,000 (current resistance) and $110,500–$123,000 (next major target).
-- Disclaimer --
This analysis is based on recent technical data and market sentiment from web sources. It is for informational purposes only and not financial advice. Trading involves high risks, and past performance does not guarantee future results. Always conduct your own research or consult a SEBI-registered advisor before trading.
#Boost and comment will be highly appreciated

Bitcoin to 101.500 support ?Bitcoin continues to trade within a well-defined descending channel, respecting both the upper and lower bounds consistently. Price is currently rejecting the midline of the channel, suggesting bearish continuation. A fresh short position has been marked, with a tight stop above local structure and a projected target at the lower boundary near $101,528, offering a favorable risk-reward ratio. Until price breaks convincingly above the channel, the trend remains bearish.

BTC SELL Recommendation down 109400Timeframe: M15
Strategy in use: Trend-following and supply/demand zone-based trading
Technical tools:
Moving Averages (MA): Short-term (red) and long-term (blue) SMAs. Price is below both — confirming a bearish trend.
Volume: Declining volume during consolidation suggests weak buying interest.
Resistance zone: Around 110,890 - 110,930, clearly acting as a barrier as shown by repeated candle rejections.
Price Pattern: After a technical pullback, BTC hits resistance and forms a short setup.
📉 BTC SELL Recommendation
Sell Entry: 110,840 – 110,900
Stop Loss (SL): 111,023 (above resistance zone)
Take Profit (TP): 109,400
Risk:Reward Ratio: Estimated at 1:3 — suitable for a short-term swing strategy.
🧩 Reasons for Entering a Short Trade
Price below MAs, showing bearish momentum.
Strong resistance zone at 110,890 – 111,023 with multiple rejections.
Falling volume during the pullback, indicating weak demand.
Bearish candle structure: Sellers are currently in control.
Good R:R ratio, with profit potential down to 109,400.
⚠️ Warning
If the price closes above 111,023 with strong volume, this setup becomes invalid.
Watch for price action during the U.S. session — it’s key to the next major move

Bitcoin Weakly Technical (21 To 27 Apr-2025)
As of the most recent data point on April 15, 2025, Bitcoin was trading at approximately $85,123.23, with a slight decline to $84,165.79 later that day. For today, April 20, 2025, forecasts suggest #Bitcoin could reach $85,502.80, reflecting a modest increase of 0.61% from the prior day. The #cryptocurrency appears to be in a consolidation phase, balancing between key support and resistance levels, with mixed technical signals and external influences shaping its trajectory.
#Chart for your reference

BTCUSD Buy setup Bitcoin (BTC) - A Brief Description
Bitcoin (BTC) is the world's first and most widely recognized cryptocurrency. It was created in 2009 by an anonymous person or group known as Satoshi Nakamoto. Bitcoin operates on a decentralized, peer-to-peer network using blockchain technology, which ensures transparency, security, and immutability of transactions.
Unlike traditional currencies issued by governments (fiat money), Bitcoin is not controlled by any central authority such as banks or governments. Instead, it is maintained by a distributed network of computers (nodes) through a process called mining, where transactions are verified and recorded on the blockchain.
Key Features of Bitcoin:
1. Decentralization – No single entity controls Bitcoin.
2. Limited Supply – Only 21 million BTC will ever exist, making it scarce.
3. Security – Uses cryptographic techniques to ensure safe transactions.
4. Transparency – Transactions are recorded on a public ledger (blockchain).
5. Fast and Borderless Transactions – Can be sent anywhere in the world without intermediaries.
6. Store of Value – Often referred to as "digital gold" due to its potential as a hedge against inflation.
Bitcoin is widely used for investment, trading, and online payments, and it has influenced the creation of thousands of other cryptocurrencies.

When to Buy This Bitcoin Dip - My Technical Take on current PAOn BTC ,Yesterday's bounce is worth noting, but I'm approaching it with caution. The recently broken support trendline (now visible as a diagonal resistance) will likely act as resistance in the 89-91K zone, also we have a Horizontal resistance at 83-85K which is previous support now becomes resistance .
For potential entries, I'm watching two key scenarios:
Bullish Case 1: If BTC can reclaim and close above the broken trendline (89-91K), it would suggest the breakdown was a fakeout. This could set up a potential move back toward previous highs.
Bullish Case 2: If price continues lower to the 73K major support zone (marked by the green rectangle), this could provide an excellent buying opportunity with a favorable risk/reward ratio. A strong bounce from this level could signal the end of the correction and the start of a new uptrend.

BitcoinBitcoin rising from $85,189 to $88,000 today implies an anticipated increase of about 3.3%. Given the current market conditions and recent price movements, such a rise is within the realm of possibility, though it would require a reversal of the current downward trend.
It's important to note that Bitcoin's price has experienced significant fluctuations recently. Following President Donald Trump's announcement of a U.S. strategic crypto reserve, Bitcoin's value surged by over 11%, reaching a high of $95,136. However, it remains below its record high of $109,135 achieved in January 2025.

Bitcoin Mini Future Bearish Price ActionAfter the accelerated fall post breakdown of horizontal channel, the price dropped to fill the gap and bounced back.
The bounce took price back into the horizontal channel but the price slid out of it.
Then price dropped towards the gap and bouncing just above it.
The price tried to enter the horizontal channel but took resistance, further confirming bearish price action.
As it remains outside the channel, it seems bearish.

Ratio Chart of Gold/Bitcoin Breaking OutAs the bitcoin drops and gold is hovering around ATH, the ratio chart jumped and broke out. Follow up price action is key.

NIFTY analysis sell? Let's see!!!According to my analysis, there is a Trend line ,price rejecting it.
If price break the 22750 then go selling for rest of the month.
If price break the 23200 then go bullish for the month.
I think most possible is downside . Be careful while trading.
Learn to trade by yourself is better for you.

Ethereum at a Critical Turning Point: Head & Shoulder PatternEthereum Technical Chart Study
Ethereum is showing some interesting price action. It recently took resistance from its resistance zone and is now forming a classic Head & Shoulder pattern—a structure often signaling potential reversals.
Currently, the price is sitting right at the neckline of the Head & Shoulder pattern. If this neckline breaks, it could lead to further downside movement.
Looking below, there’s some key support to watch:
1. The 2800 resistance zone, which Ethereum broke out of earlier, hasn’t been tested yet. This zone might now act as a strong support if the price moves downward.
2. There’s also a trendline support in play, adding another layer of potential price stability.
So, what’s next?
If Ethereum breaks the neckline, we could see the price fall towards the 2800 zone or possibly to the trendline support. These are the levels to keep an eye on for the next big move.

BTC#8: Read BTC price line and trading plan
💎 💎 💎 Did you make a profit in the previous post #7? Like and follow the channel to follow the earliest trading plan. 💎 💎 💎
🔥 Let's plan for the next BINANCE:BTCUSD BINANCE:BTCUSDT 🔥
1️⃣ **Fundamental analysis:**
📊The Federal Reserve keeps interest rates unchanged
🚀Today is the expiration date of BTC futures
📌 US Senator Cynthia Lummis: will hold a public hearing on strategic Bitcoin reserves. This is important information. If BTC is accepted as a reserve asset. The cash flow into BTC will be huge in the near future.
2️⃣ **Technical analysis:**
🔹 **Frame D**: Once again, the price reacted in the 106xxx area. This test gives a weaker price reaction than the previous one.
🔹 **H4 frame**: The price has not surpassed 107xxx so it is not certain that BTC will break the peak.
🔹 **H1 frame**: The short-term price structure is still increasing. It is highly likely that the price will find the support zone below.
3️⃣ **Trading plan:**
⛔The price line has not completely escaped the SW zone, so if you participate in trading in this area, you must stick to the price structure.
✅ In my personal opinion, BTC will likely have another correction before it can break through the old peak. For the time being, we will wait for the price reaction at important support zones.
💪 **Wish you successful trading!**
📌 For any questions, please contact us directly. I am ready to answer you for free

BTC#6: SW is uncomfortable but coming to the breakthrough.💎 💎 💎 Plan #5 first helps you make a profit. Please leave a comment and tag your friends' names to share. 💎 💎 💎
1️⃣ ** Basic analysis: **
📊 Trump signed the executive command on cryptocurrencies: Clarifying the framework of management and discovery of national cryptocurrency reserves
Buffett of Buffett's Berkshire Hathaway is gradually grasping cryptocurrencies.
🚀 Ohio state proposes a Bitcoin reserve bill
📌 A series of information that brings optimistic psychology to the cryptocurrency market in general and BTC in particular.
2️⃣ ** Technical analysis: **
🔹 ** Frame D **: The price is still swing in the past few days
🔹 ** H4 **: Price structure is still increasing and has not changed.
🔹 ** Frame H1 **: The price is still swing in the triangle and progresses to the breakthrough
3️⃣ ** Transaction plan: **
⛔ This is the SW area that is not suitable for the command. It is difficult to predict the price line in the current area. Control greed.
✅ My personal opinion that about the structure of large and small frame prices is increasing. If there is a structure, we can confirm about a adjustment beat. The current trend should wait for Buy when the price is important.
💪 ** Wish you successful transactions! **
📌 Any questions please contact directly. I am ready to answer for free
#trading #trade #tradeindia #newtrader #newbie #Blockchain #Forex #tradingView #plants #trader #tradingforex #btcusd #bitcoin

BTC#4: Things to watch out for when BITCOIN breaks the top💎 💎 💎 Plan BTC3# helps you make a profit. Leave a comment and tag your friends to share. 💎 💎 💎
1️⃣ **Fundamental analysis:**
📊 Trump plans to make cryptocurrency a "policy priority" and consider suspending related lawsuits and establishing a national reserve fund.
🚀 The Fed's dovish stance combined with Trump's pro-crypto stance creates the foundation for the market to grow.
📌 Liquidation of positions has exceeded $90 million, most of which are sell orders. This also contributes to pushing BTC prices higher.
2️⃣ **Technical analysis:**
🔹 **D frame**: As you can see, after scanning the 89xxx~90xxx area and closing with a pinbar, the price line has been increasing continuously until now.
🔹 **H4 frame**: The resistance zone of 102xxx has been broken and acted as support to push the price above the old peak. The price structure has been confirmed in the H4 frame that the old peak has been broken by a candle closing through the 106k~108k area
🔹 **H1 frame**: You can see the price line testing the trend line and increasing according to the textbook theory. You can see that I drew the support zone in #3 just now. Currently, the price has broken through the old trendline, but the price is still reacting at the old peak area.
3️⃣ **Trading plan:**
⛔ As I have provided you, the number of liquidated sell orders is very large. So we should not go against the trend to catch falling knives at this time.
✅ Currently, in my personal opinion. Market information is very excited with TRUMP's moves in the past time. This will attract many new investors and push BTC prices to continue to increase in the near future. However, today I will not give a trading plan because we do not know how high BTC prices can increase. Establishing a position at resistance brings high risks because R:R is no longer reasonable. 🚀 Give yourself a period of time to observe the price line and listen to information to make long-term decisions.
💪 **Wish you successful trading!**

BTC#3: Will Bitcoin continue to increase? What to do when you mi🔥 🔥🔥 Plan BTC#2 Has gone as planned. Currently, the BTC price has surpassed the Key lever 1026xx. And is approaching the old peak. I will continue to plan to help everyone have a panoramic view to make trading decisions for themselves. 🔥 🔥🔥
1️⃣ **Fundamental analysis:**
📊 Information about Donald Trump's inauguration has contributed to promoting optimism for the electronic market.
🔴 In addition, the possibility of Trump announcing a strategic Bitcoin reserve will further boost the demand for BTC in the near future when other major countries will also launch corresponding strategies.
2️⃣ **Technical analysis:**
🔹 **Frame D**: You can see that BTC is still increasing very strongly. We still don't see any signs that the price line wants to adjust, which shows the very positive sentiment of the current market.
🔹 **H4 frame**: The bearish price structure has been broken as I analyzed in the previous article #2. Currently, the price has not had any correction. However, the price is also very close to the resistance zone above
🔹 **H1 frame**: There is not much difference compared to H4, it can be seen that although there are slight corrections, the price line is still showing that the bulls are still absolutely dominant
3️⃣ **Trading plan:**
⛔ Absolutely do not hold losses at this time. The price line increasing without signs of adjustment will further torture the trading psychology of traders trading against the trend. In addition, the price increases continuously without stopping will form a FOMO mentality for those who have missed the opportunity. However, if we set up a buy position here, it will be difficult for us to achieve the desired profit when the R:R ratio is too risky
✅ The current price zone is no longer suitable for setting up a position. My advice for you is to patiently wait for the next correction when the price returns to important support zones.
🚀 At the present time, if anyone has a good position in the 955xx area, we can completely wait for even greater profits.
💪 **Wish you successful trading!**

BTC#2 : Summary of things to watch out for in the current uptren🔥 The previous plan helped you make a profit. Leave a comment and share the joy. 🔥
Today I will continue to bring everyone a perspective on BTC and the next trading plan.
1️⃣ **Fundamental analysis:**
📊 🔴US CPI rose slightly more than expected in December as energy costs rose, suggesting inflation is still rising
▫️ In addition, a recovery in Bitcoin was supported by the release of December PPI on Tuesday, which showed weaker-than-expected inflation data.
2️⃣ **Technical analysis:**
🔹 **D Frame**: Yesterday's candle close shows strong market confidence in BTC rising. However, the price has reacted when touching the trendline. This is the area we need to pay attention to
🔹 **H4 frame**: The bearish price structure was broken when the price crossed 968xx and went straight to the trendline, which caused the bullish momentum to slow down somewhat. It is likely that we will need a slight correction to gain momentum to break the resistance area above
🔹 **H1 frame**: Looking at the price structure, you can see more clearly. The bullish wave has not shown any signs of ending, but the important resistance area requires us to be more patient if we want to find profits.
3️⃣ **Trading plan:**
✅ If you want to have a BUY position at the moment, my advice is that we can patiently wait for the price to test the support area of 958xx as I marked on the chart. Don't be hasty, when the R:R ratio of the important resistance area is always low. The bullish price structure also needs confirmation by a higher bottom than the previous bottom. FOMO at this time is not a wise choice
⛔ The resistance zone will always make you want to stop the ship. However, wait for the bearish price structure in the small time frame M5. M15 to make sure your judgment is correct. If you have a good position, you should not expect high profits when the bearish price structure is temporarily broken, closing part of the profit when the price touches support and leaving SL positive will be a wise choice.
💪 **Wish you successful trading!** 🚀

Bitcoin chart updateBitcoin now at resistance level
If level break we can see good move at upside
Otherwise again going down


Bitcoin Bearish View Bitcoin Going On Trend HL LH
If Break 92000 Level Its Going Down Somthing 88000

Bitcoin Analysis Yesterday, we didn’t get a clear breakout and the market remains stuck between two level like forming red green pattern.
This chart shows the Bitcoin-to-USD (BTC/USD) price action, likely on the 1-hour timeframe, with indications of a potential bearish movement. Here’s a quick analysis based on the provided image:
Key Observations:
1. Current Price: The price is around $94,921, showing a slight decline (-0.23%).
2. Ascending Channel: The chart indicates a rising channel (black trendlines) that is nearing its upper boundary, suggesting potential exhaustion of the upward momentum.
3. Resistance Zone: A purple rectangle marks a resistance area where the price has struggled to break through.
4. Bearish Rejection and Projection:
• The price appears to be consolidating near the upper trendline but lacks strong bullish momentum.
• An arrow indicates a potential breakdown from the channel, aiming toward lower levels around $93,000.
5. CCI Indicator:
• The Commodity Channel Index (CCI) shows a decline from overbought territory (above 100), indicating bearish momentum could be building.
Potential Scenario:
• Bearish Breakdown: If the price breaks below the ascending channel, it could test the $93,000 level or even lower to the $92,000 support zone.
• Invalidation: If the price breaks above the resistance zone and holds, the bearish outlook would be invalidated, leading to further upward movement.
Trading Suggestion:
(Don’t follow me blindly as I am not a certified trader)
• Consider short positions if the price breaks below the channel and confirms with volume or candlestick patterns.
• Monitor support zones near $93,000 and $92,000 for potential profit-taking or reversal signals.
• Place a stop-loss above the resistance zone to manage risk.

BTCUSD Friday Analysis Bitcoin chart update
If we gave bitcoin yesterday the level we gave, then we gave a move of 3900 points from there, today that level is broken and the side is coming down.
Below is again a support level
#btcusd #bitcoin

BTCUSD SHOWING A GOOD UP MOVE NOW WAIR FOR TRAD LINE BREAKOUT A. its following a rectangle pattern that stocked the market
which preventing the market to move any one direction now it trying to break the strong resistant lable
B. after the break of this rectangle it will boost the market potential for break
C. also its resisting from a strong neckline the neckline also got weeker ald the price is ready to break in the outer region
all of these reason are indicating the same thing its ready for breakout BREAKOUT trading are follws good risk reward
please dont use more than one percentage of your capitalfollow risk reward and tradeing rules
that will help you to to become a bettertrader
thank you
