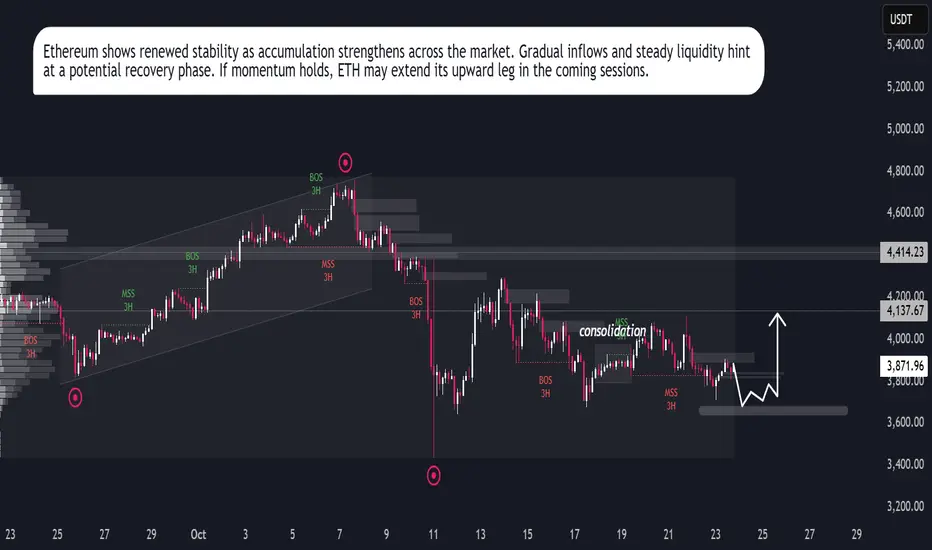
ETH Eyes Upside RunEthereum shows signs of regaining strength after a prolonged corrective phase. The asset is currently stabilizing, supported by gradual inflows from institutional participants and renewed investor accumulation. Market behavior indicates controlled volatility, suggesting a preparation phase before a potential expansion.
Network data reflects consistent transaction activity, while liquidity concentration hints at sustained participation from long-term holders. The recent stabilization in funding rates and improved open interest add weight to the recovery outlook.
If momentum continues to build under these conditions, Ethereum could enter a structured growth cycle in the coming sessions.
Blockchain
Cryptocurrency and Blockchain TradingIntroduction
Cryptocurrency and blockchain trading represent a transformative evolution in global financial markets. Unlike traditional fiat currencies governed by central banks and financial institutions, cryptocurrencies operate on decentralized networks built on blockchain technology. This paradigm shift has created unique opportunities and challenges for traders, investors, and institutions worldwide.
At its core, cryptocurrency trading involves buying, selling, and exchanging digital assets, often with the goal of making profits from price fluctuations. Blockchain technology, the underlying framework for cryptocurrencies, ensures transparency, security, and decentralization, enabling peer-to-peer transactions without intermediaries.
This article explores the principles, mechanisms, strategies, and risks involved in cryptocurrency and blockchain trading, offering a detailed guide for beginners, intermediate, and advanced market participants.
Understanding Cryptocurrencies
Definition and Characteristics
A cryptocurrency is a digital or virtual currency that uses cryptography for security and operates on a decentralized ledger called a blockchain. The defining characteristics include:
Decentralization: No single entity controls the network. Decisions are made through consensus mechanisms.
Security: Cryptographic algorithms secure transactions and wallets, making fraud extremely difficult.
Transparency: Blockchain ensures that all transactions are visible to participants, enhancing trust.
Limited Supply: Many cryptocurrencies, like Bitcoin, have a capped supply, creating scarcity that can influence value.
Programmability: Smart contracts enable programmable transactions, automatically executing when predefined conditions are met.
Popular Cryptocurrencies
Bitcoin (BTC): The first and most valuable cryptocurrency, often regarded as digital gold.
Ethereum (ETH): Known for its smart contract capabilities and decentralized applications (dApps).
Ripple (XRP): Focused on cross-border payments and banking solutions.
Litecoin (LTC): A faster, lighter alternative to Bitcoin for peer-to-peer transactions.
Binance Coin (BNB): Initially used for exchange fee reductions on Binance, now powering multiple DeFi applications.
Blockchain Technology: The Backbone
How Blockchain Works
A blockchain is a distributed digital ledger that records transactions across multiple computers. Key components include:
Blocks: Data structures that store transaction records.
Chains: Blocks are linked sequentially, forming a chain. Each block contains a cryptographic hash of the previous block, ensuring integrity.
Nodes: Computers participating in the network that validate and store blockchain data.
Consensus Mechanisms: Protocols like Proof of Work (PoW) and Proof of Stake (PoS) ensure agreement on the blockchain's state.
Benefits for Trading
Security: Immutable records prevent fraud and manipulation.
Transparency: Publicly accessible ledgers allow traders to verify transactions.
Efficiency: Automated smart contracts reduce reliance on intermediaries.
Global Reach: Cryptocurrencies are borderless, allowing participation across nations.
Cryptocurrency Trading Explained
Cryptocurrency trading differs from traditional markets due to high volatility, continuous operation (24/7 trading), and unique technical dynamics.
Types of Cryptocurrency Trading
Spot Trading
Spot trading involves buying and selling cryptocurrencies for immediate settlement. Traders profit from price differences in the short term or long term. Exchanges like Binance, Coinbase, and Kraken facilitate spot trading.
Margin Trading
Margin trading allows traders to borrow funds to increase their market exposure. This amplifies both potential profits and losses. For example, using 10x leverage, a $1,000 investment controls $10,000 worth of crypto.
Futures Trading
Futures contracts are agreements to buy or sell cryptocurrency at a predetermined price on a future date. Platforms like BitMEX, Binance Futures, and Bybit provide derivatives markets. Futures trading enables speculation on price movements without owning the underlying asset.
Options Trading
Options give traders the right, but not the obligation, to buy or sell cryptocurrency at a set price within a specific period. This allows hedging and risk management strategies.
Algorithmic and Automated Trading
Bots and trading algorithms execute orders based on predefined strategies, such as arbitrage, trend-following, or market-making, enabling high-frequency trading and consistent execution.
Market Participants
Cryptocurrency trading involves diverse participants, each influencing market behavior differently:
Retail Traders: Individual investors seeking profit from short-term or long-term price movements.
Institutional Investors: Hedge funds, asset managers, and corporations investing in crypto assets, influencing liquidity and stability.
Market Makers: Entities providing liquidity by continuously buying and selling assets, reducing bid-ask spreads.
Speculators: Traders aiming to profit from volatility without necessarily believing in the long-term value of the asset.
Arbitrageurs: Traders exploiting price differences across exchanges for risk-free profit.
Key Factors Influencing Cryptocurrency Prices
Market Sentiment: News, social media, and influencer activity can dramatically affect prices.
Regulation: Government policies, legal status, and taxation of cryptocurrencies impact market confidence.
Technology Upgrades: Network updates, forks, and innovations influence asset value.
Liquidity and Market Depth: Higher liquidity reduces volatility, whereas low liquidity can amplify price swings.
Global Economic Factors: Inflation, fiat currency performance, and geopolitical events indirectly affect crypto markets.
Technical Analysis in Cryptocurrency Trading
Common Tools
Candlestick Patterns: Identify trends and reversals through patterns like doji, hammer, or engulfing candles.
Moving Averages (MA): Track average prices to determine trend direction. Popular types include SMA (Simple Moving Average) and EMA (Exponential Moving Average).
Relative Strength Index (RSI): Measures overbought or oversold conditions.
MACD (Moving Average Convergence Divergence): Identifies trend changes and momentum.
Fibonacci Retracements: Used to predict support and resistance levels.
Trading Strategies
Day Trading: Entering and exiting positions within a single day to profit from intraday volatility.
Swing Trading: Holding assets for days or weeks to capitalize on medium-term trends.
Scalping: Rapid, high-volume trades exploiting small price movements.
HODLing: Long-term holding based on belief in the asset’s future potential.
Fundamental Analysis
Fundamental analysis evaluates a cryptocurrency’s intrinsic value based on qualitative and quantitative factors:
Whitepapers: Documents detailing a project’s goals, technology, and tokenomics.
Development Team: Experienced and reputable developers increase project credibility.
Community Support: Active communities on forums, social media, and GitHub indicate long-term viability.
Partnerships and Adoption: Integration into businesses and financial systems enhances value.
Supply Mechanisms: Token supply, staking incentives, and burning mechanisms influence scarcity.
Risk Management in Cryptocurrency Trading
Due to extreme volatility, risk management is crucial:
Position Sizing: Limit exposure based on account size and risk tolerance.
Stop-Loss Orders: Automatically close positions to prevent excessive losses.
Diversification: Spread investments across multiple assets to reduce concentration risk.
Leverage Caution: High leverage can magnify losses; traders should use it judiciously.
Security Practices: Use hardware wallets, two-factor authentication (2FA), and secure exchanges.
Regulatory and Legal Considerations
Cryptocurrency trading regulations vary globally:
United States: Regulated by SEC, CFTC, and FinCEN, focusing on securities compliance and anti-money laundering.
European Union: Markets are gradually regulated under MiCA (Markets in Crypto-Assets Regulation).
Asia: Countries like Japan and Singapore have clear licensing frameworks, while India’s stance fluctuates.
Other Regions: Some nations ban crypto entirely, while others encourage innovation.
Traders must stay informed to comply with taxation, reporting, and legal requirements.
Emerging Trends
Decentralized Finance (DeFi): Peer-to-peer financial systems offering lending, borrowing, and staking opportunities.
Non-Fungible Tokens (NFTs): Unique digital assets creating new investment classes and liquidity opportunities.
Institutional Adoption: Companies adding crypto to balance sheets or offering trading platforms.
Layer-2 Scaling Solutions: Enhancements like Ethereum’s Polygon reduce fees and increase transaction speed.
AI-Driven Trading: Advanced algorithms analyzing market sentiment and predictive trends.
Challenges in Cryptocurrency Trading
Volatility: Rapid price swings can lead to significant losses.
Security Risks: Exchange hacks, phishing, and wallet theft remain major concerns.
Regulatory Uncertainty: Changing laws can disrupt markets and affect liquidity.
Liquidity Constraints: Low trading volume in certain coins can cause slippage.
Emotional Trading: Fear and greed often lead to irrational decisions.
Conclusion
Cryptocurrency and blockchain trading is a dynamic and rapidly evolving domain combining technology, finance, and human behavior. While it offers opportunities for significant profit, it carries substantial risk. Successful trading requires a blend of technical analysis, fundamental research, risk management, and regulatory awareness.
As blockchain adoption grows and institutional participation increases, cryptocurrency markets are likely to mature, offering more stability, innovative instruments, and integration into the broader financial ecosystem.
Traders who stay informed, disciplined, and adaptable are best positioned to navigate this revolutionary landscape. With proper education, robust strategy, and caution, cryptocurrency trading can transform from a speculative gamble into a structured, potentially rewarding endeavor.
How to Build a Crypto Portfolio for Long-Term Wealth?Hello Traders!
The crypto market can look exciting, fast profits, new coins every week, and hype everywhere.
But those who build long-term wealth in crypto don’t chase trends; they build structured portfolios with strategy.
Let’s understand how to create a crypto portfolio that can grow steadily over time, not just in bull runs.
1. Decide Your Investment Horizon
Before buying anything, decide your goal, 3 years, 5 years, or 10 years.
Longer horizons allow you to ride out volatility and benefit from compounding.
If you’re thinking short term, you’re speculating, not investing.
2. Allocate Wisely – The 60/30/10 Rule
60%: Blue-chip cryptos like Bitcoin (BTC) and Ethereum (ETH) , the foundation of your portfolio.
30%: Promising large/mid-cap projects (Layer-1s, AI, DeFi leaders).
10%: High-risk, high-reward small-cap or emerging tokens.
This keeps your portfolio stable while still giving growth exposure.
3. Diversify Across Categories
Don’t just hold coins, diversify across crypto sectors:
~Layer-1 platforms (ETH, SOL, AVAX)
~DeFi (AAVE, UNI)
~Infrastructure (LINK, ARB)
~AI/Metaverse (INJ, RNDR, MATIC)
This ensures that if one sector underperforms, others balance your returns.
4. Use SIP or DCA Method
Instead of buying everything at once, invest gradually through Systematic Investment Plans (SIP) or Dollar Cost Averaging (DCA) .
This helps you accumulate more during dips and reduces emotional stress during corrections.
5. Secure and Rebalance Regularly
Use hardware wallets for long-term storage. Don’t keep large amounts on exchanges.
Review your portfolio every 3–6 months and rebalance to maintain original allocation.
Trim profits from overperforming assets and add to undervalued ones.
Rahul’s Tip:
Crypto investing is not about catching every rally, it’s about staying long enough to see technology grow and adoption rise. Patience is your biggest alpha.
Conclusion:
A strong crypto portfolio is like a business, diversified, secure, and managed with discipline.
If you build it smartly, it can become a powerful wealth creator over time.
If this post helped you plan your crypto journey, like it, drop your thoughts in comments, and follow for more practical investment insights!
EOS Super bullish toward $10 because WLFI Buying$EOS/USDT Weekly Technical Breakdown
🔰 Price Action:
EOS is currently trading at $0.85, following a rejection from the key weekly resistance zone between $1.24–$1.31. This zone has acted as a historical supply area, and the failure to break above it has triggered a short-term corrective move.
🔰 Bullish Development:
EOS has recently broken out of a multi-year falling wedge pattern, signaling a potential long-term trend reversal. Post-breakout, the asset is now retesting lower levels — a common occurrence before continuation.
🔰 Key Demand Zones:
Primary Accumulation Zone: $0.83–$0.69
Major Weekly Support: $0.47–$0.40
These zones coincide with historical consolidation and low-volume nodes, making them ideal for long-term positioning.
🔰 Institutional Interest:
Trump-backed World Liberty Financial has accumulated 3.64M NYSE:EOS for 3M USDT, with an average entry at $0.824 — aligning perfectly with the current range. This reinforces the strength of the accumulation zone and may signal smart money inflow.
🔰 Upside Resistances to Monitor: $2.87 / $5.03 / $10.57 / ATH: $14.90
NYSE:EOS is showing signs of structural reversal on the HTF. As long as the price holds above the $0.69 base, bullish continuation remains valid. A reclaim and weekly close above $1.31 could trigger the next impulsive leg toward $5+.

BTC#18: BTC plunges, destination and trading opportunities at th🔥 So BTC has corrected. However, how much it has decreased, we will analyze it right away: 🔥
1️⃣ **Fundamental analysis:**
📊 Widespread Pessimism, Cryptocurrency Market Plunges Sharply
————
⚫Bitcoin and altcoins plunge: Bitcoin drops nearly 5% to $90,000, Ethereum loses more than 10% in two days, Solana drops 15%, Dogecoin drops 13%.
⚫The market is still affected by the $1.4 billion hack last week. Bybit announces compensation but Ethereum is still under pressure.
⚫Weak market sentiment: Many meme coins collapse, limited capital flows cause altcoins to lose value sharply. Solana under selling pressure as it prepares to unlock $1.72 billion in tokens on March 1.
⚫Crypto-related stocks also plunge: Coinbase down for six consecutive sessions, MicroStrategy down 5.7%, BTC mining stocks fall sharply.
🚀 MicroStrategy continues to buy BTC: The company bought another 20,356 BTC worth $1.99 billion, bringing its total BTC holdings to 499,096 VND (~$33.1 billion).
🛫Forecast: The downtrend may continue if market sentiment does not improve and cash flow does not return to altcoins.
2️⃣ **Technical analysis:**
🔹 **Frame D**: the bullish structure has been broken and turned bearish. Pessimistic sentiment covers the entire market so it will be difficult to see an immediate recovery
🔹 **H4 frame**: the bearish price structure is more clearly shown. The nearest resistance zone is 93x
🔹 **H1 frame**: the price line is still quite far from the horizontal or diagonal resistance zone, the current price has recovered a bit but the market sentiment is still hesitant about the Fibo 23.6 area as you can see on the chart
3️⃣ **Trading plan:*
⛔The current time is not suitable to catch the bottom of BTC, not only the market sentiment is pessimistic but the basic information has not seen any positive news for BTC. We will need to patiently wait for confirmation from the price line
✅ Priority at the moment. Currently is looking for a SELL position following the main trend. The sharp price drop will have a recovery adjustment but pay attention to stick to the price structure and do not be greedy.
💪 **Good luck trading!**

BTC#11: Will BTC rise or fall?. Market structure perspective
💎 💎 💎 Did you make a profit in post #10? Please share and comment your thoughts 💎 💎 💎
🔥After the Monday morning dump, we witnessed an amazing recovery of BINANCE:BTCUSD . Market sentiment has improved significantly. We continue to plan for BINANCE:BTCUSDT as follows:🔥
1️⃣ **Fundamental analysis:**
📊Data: Stablecoin on-chain trading volume decreased by 10.5% in January and legal CEX spot trading volume decreased by 18.2%
🔴According to Bybit CEO Ben Zhou, the total value of actual crypto liquidations is higher than $2 billion, he estimates this figure at around $8-10 billion.
🚀Donald Trump signed an executive order to establish a US national investment fund.
📌 In general, market liquidity is falling sharply, the loss after the recent correction has brought a cautious mentality to the majority of investors in the cryptocurrency market.
2️⃣ **Technical analysis:**
🔹 **D Frame**: Yesterday's D candle marked the amazing recovery of BTC. Currently, the price structure of frame D is still maintained as an increasing price structure.
🔹 **H4 Frame**: Gives us a different perspective. Although BTC has recovered, the price structure of frame H4 has not been broken. We will have to wait a while before seeing a more positive signal
🔹 **H1 Frame**: As you can see, BTC is still running in the downtrend channel. The KEY 977xx zone will play an important role in predicting the next direction
3️⃣ **Trading plan:**
⛔At the present time. Although the D candle is a positive sign, in the smaller time frame we still do not have a price structure confirming the recovery of the main trend. Whether placing a BUY or SELL order in this area is very dangerous because there is no confirmed price structure. You should wait to get the best trading position
✅ Based on my personal experience, I will wait for the price reaction in this 97K area. If a supportive price structure appears, we can have a good position following the main trend in the D frame.
💪 **Wish you successful trading!**
📌 For any questions, please contact us directly. I am ready to answer you for free

BTC#6: SW is uncomfortable but coming to the breakthrough.💎 💎 💎 Plan #5 first helps you make a profit. Please leave a comment and tag your friends' names to share. 💎 💎 💎
1️⃣ ** Basic analysis: **
📊 Trump signed the executive command on cryptocurrencies: Clarifying the framework of management and discovery of national cryptocurrency reserves
Buffett of Buffett's Berkshire Hathaway is gradually grasping cryptocurrencies.
🚀 Ohio state proposes a Bitcoin reserve bill
📌 A series of information that brings optimistic psychology to the cryptocurrency market in general and BTC in particular.
2️⃣ ** Technical analysis: **
🔹 ** Frame D **: The price is still swing in the past few days
🔹 ** H4 **: Price structure is still increasing and has not changed.
🔹 ** Frame H1 **: The price is still swing in the triangle and progresses to the breakthrough
3️⃣ ** Transaction plan: **
⛔ This is the SW area that is not suitable for the command. It is difficult to predict the price line in the current area. Control greed.
✅ My personal opinion that about the structure of large and small frame prices is increasing. If there is a structure, we can confirm about a adjustment beat. The current trend should wait for Buy when the price is important.
💪 ** Wish you successful transactions! **
📌 Any questions please contact directly. I am ready to answer for free
#trading #trade #tradeindia #newtrader #newbie #Blockchain #Forex #tradingView #plants #trader #tradingforex #btcusd #bitcoin

BTC#3: Will Bitcoin continue to increase? What to do when you mi🔥 🔥🔥 Plan BTC#2 Has gone as planned. Currently, the BTC price has surpassed the Key lever 1026xx. And is approaching the old peak. I will continue to plan to help everyone have a panoramic view to make trading decisions for themselves. 🔥 🔥🔥
1️⃣ **Fundamental analysis:**
📊 Information about Donald Trump's inauguration has contributed to promoting optimism for the electronic market.
🔴 In addition, the possibility of Trump announcing a strategic Bitcoin reserve will further boost the demand for BTC in the near future when other major countries will also launch corresponding strategies.
2️⃣ **Technical analysis:**
🔹 **Frame D**: You can see that BTC is still increasing very strongly. We still don't see any signs that the price line wants to adjust, which shows the very positive sentiment of the current market.
🔹 **H4 frame**: The bearish price structure has been broken as I analyzed in the previous article #2. Currently, the price has not had any correction. However, the price is also very close to the resistance zone above
🔹 **H1 frame**: There is not much difference compared to H4, it can be seen that although there are slight corrections, the price line is still showing that the bulls are still absolutely dominant
3️⃣ **Trading plan:**
⛔ Absolutely do not hold losses at this time. The price line increasing without signs of adjustment will further torture the trading psychology of traders trading against the trend. In addition, the price increases continuously without stopping will form a FOMO mentality for those who have missed the opportunity. However, if we set up a buy position here, it will be difficult for us to achieve the desired profit when the R:R ratio is too risky
✅ The current price zone is no longer suitable for setting up a position. My advice for you is to patiently wait for the next correction when the price returns to important support zones.
🚀 At the present time, if anyone has a good position in the 955xx area, we can completely wait for even greater profits.
💪 **Wish you successful trading!**

ETH/USDT Bearish chart below $2660 so what next?$ETH/USDT Technical Analysis
CRYPTOCAP:ETH is trading around $2640, with a strong Bearish Order Block near $2660—high probability of rejection. If $2660 holds as resistance, a retracement toward $2450 is likely.
Note: A 4H candle close above $2660 will invalidate the setup, and I'll close my ETH/USDT short position.
Support: $2450 / $2300
Resistance: $2660

$ETH Flag Pattern Alert: Below $2000 or Above $3300 for Bull RunCRYPTOCAP:ETH Flag Pattern Alert: Below $2000 or Above $3300 for the Next Bull Run
Bullish Outlook: #Ethereum is forming a bullish flag pattern, but the real confirmation will come with a breakout above $3300. Until then, don't fall for potential fakeouts.
Entry Strategy: Consider buying below $2000 if prices dip. A sustained breakout above $3300 could propel #ETH toward $10,000.
Support: $2200/$1500
Resistance: $3300/$4000
Watch Out: Keep a close eye on price action before making high-leverage trades.

POPCAT/USDT Forming Bull Flag: Expecting Target $2Popcat ($POPCAT) Soars to New High: $0.576625
Popcat, the first cat-themed coin to hit a billion-dollar market cap, has reached a new all-time high of $0.576625
Thanks to its unique positioning and strong community backing, #POPCAT has seen rapid growth, and many believe it could soon hit $1.
While the market is volatile, the Popcat community is buzzing with excitement and optimism!
Chart Analysis:
According to the chart, POPCAT has formed a bullish flag and completed a breakout, suggesting a 250% potential gain from the breakout level. It could reach $1.80 soon, but remember to set your stop loss.
Stop Loss: $0.4390
Note: This is a high-risk coin, already up 500% in just 13 days. Avoid investing big money.
Let's see how Popcat performs in the coming days!

ENA/USDT Ready to Upward move toward $2.5 ( 200% )ENA/USDT Chart Analysis Update
XETR:ENA has just made a significant move, breaking through the resistance line of a bullish flag pattern. This breakout is a crucial indicator of potential upward momentum in the near future.
Breakout Point: $0.89 ✅
We're now watching closely for a retest of the breakout level to confirm the strength of this move. If the retest is successful, we anticipate further bullish activity.
Target: $2.50
This target is set based on the dimensions of the bull flag pattern, projecting substantial growth.
Stop Loss: $0.78
To manage risk effectively, a stop loss has been set just below the recent support level.

$FIL Bullish Breakout Toward $200 TSX:FIL Bullish Breakout Toward $200
1⃣ Bullish Breakout + Retest Confirmed As Per Chart
2⃣ Possible playout chart for #Filecoin
3⃣ Also Formed Inverse H&S Pattern and Broken + Retest Confirmed in HTF
4⃣ #FIL Long Term Targets: $27/$64/$117/$185
5⃣ Best Accumulation If Hard Dip = $7-$6
RT/Like if you Agree with My Trade Setup.
NFA

NXRA/USDT 300% Potential after Bullish pennant breakout#NEXERA could hit $0.6 If hold $0.113 Support Level
- Chart Forming Bullish Pennant
- 230% Potential if Weekly Candle holds $0.158 Level.

BITCOIN Inverse H&S Pattern Target achieved#Bitcoin Inverse H&S Targets Update:
CRYPTOCAP:BTC Perfectly Hit our Targets zone after successful breakout.
TP1:- $47,090 ✅
TP2:- $49,225 ✅
Recent High:- $53,000 ✅
So #BTC did 21% after Clear Breakout.
Happy Trading.

ADA/USDT 1500% Potential in Next bull MArketCRYPTOCAP:ADA Super Bullish 1500% Potential Analysis:
#CARDANO Entered in Bull Zone as per Fractals.
I'm Expecting $4-$5 Potential in Next Bull Run.
Best Accumulation zone: $0.30-$0.40
Targets: $1.2/$2.95/$5.8
Please Like/Comments if you agree

EDU/USDT Bullish Scenario Chart AnalysisEDU/USDT Chart Analysis: Long-Term Bullish Outlook! NYSE:EDU
EDU/USDT chart is looking quite promising for a long-term run!
I am currently seeing a pattern:
Accumulation ➡️ Breakout ➡️ Fly ➡️ Resistance ➡️ Re-Accumulation ➡️ Pump Hard.
This exciting scenario could unfold soon, so buckle up!
At the moment, EDU is trading at a major resistance level of $0.80.
If this resistance is broken, we can expect a massive upward rally.
However, if it retests from here, the price could enter a Re-Accumulation Range, presenting a fantastic entry point for those looking to hop on the EDU train.
In the near future, we're anticipating a $1.40 target, and we're bullish on EDU in the long term.
With the potential to soar above $5

Ethereum Symmetrical Triangle Chart Analysis #Ethereum Symmetrical Triangle Analysis CRYPTOCAP:ETH
#ETH is currently forming a symmetrical triangle, presenting a potential breakout or breakdown scenario.
A successful breakout above the $2340 level indicates a bullish trend till $3000 Target.
But
Conversely, a breakdown below the symmetrical triangle support at $2200 suggests a bearish trend And Traders should be prepared for a potential retest of the $1500 level in this scenario.
- Avoid Blind Trades:
- Trade with confirmed signals.
- Utilize technical analysis for precision.

Bitcoin Current update analysisBitcoin Current Scenario:-
#BTCUSDT is bullish above $41300 Support Level.
But
Don't forget Trend will Change into Bearish if BTC/USDT Breakdown $41300 Support level.
Never forget Risk Reward and Stop Loss in Any trade.

Bitcoin Bull Market Target And Bottom Analysis Bitcoin Weekly Chart Analysis
Current Status: Expansion Block
#BTC is currently navigating within the expansion block, and signs point to a potential rejection around the $47,000-$48,000 range.
Red Box: Correction Block
Anticipating a correction phase, with a possible retracement to $31,000 if Bitcoin faces rejection at the $48,000 level.
Retracement Scenario: Opportunity Beckons
Following this retracement, we brace ourselves for the next bull run. This dip could present excellent buying opportunities for astute investors.
Next Bull Run Projection: Green Box
Envisioning a bullish zone in the green box, with expectations reaching around $150,000 in the next significant uptrend.
Key Levels:
Support: $31,300
Resistance: $47,000-$48,000

Ethereum Price Prediction Ethereum price trades in a clear consolidative trend on the weekly time frame between $1,933 and $2,141 barriers.
The daily chart for ETH shows a sweep of Monday’s high is likely to be followed by a sweep of Monday’s low at $1,985.
If Bitcoin price undergoes a steep double-digit correction, Ether could also slide to $1,933 and $1,829 support levels.

aiRight 20x Potential in Long Term Analysis10x-20x Potential Coin #aiRight
Unleash the Power of AI Oracle for:
- Authenticity
- Copyright Protection
- Fair Royalties on-chain
Create, Trade, and Tokenize Unique Artworks in a Transparent & Trustless NFT Ecosystem!
Current Price: $0.0029
Bull Flag Breakout Confirmed!
Entry Points:
1️⃣ $0.0028-$0.0025
2️⃣ $0.0015-$0.0020
Targets:
- $0.0075
- $0.021
- $0.04
Note:- Invest an amount small enough that you can forget about it for a few years.
Follow us for more GEM Analysis.

LAI/USDT: This is 20x Potential in Bull Market but Why ?LAYERAI/USDT Technical and Fundamental Analysis:
#LAYERAI - Unlocking the Power of AI and Taking Control of Your Data
Technical and Fundamental Analysis: Strong
10x-20x Potential Gem
Breaking Resistance Levels
Best Accumulation Zone: $0.008-$0.009
Why Invest in #LAYERAI?
Layer AI is an innovative AI-based project that empowers individuals to reclaim control over their online data. Monetize and sell your data to tech giants like Google, Amazon, and Meta, unlocking the true value that belongs to you.
How to Get Started:
Accumulate Smartly: Start accumulating in the best zone of $0.008-$0.009.
Risk Management: Invest a small fund due to the critical role of risk-reward in cryptocurrency.
Follow us for More crypto quality analysis.
Thank you
