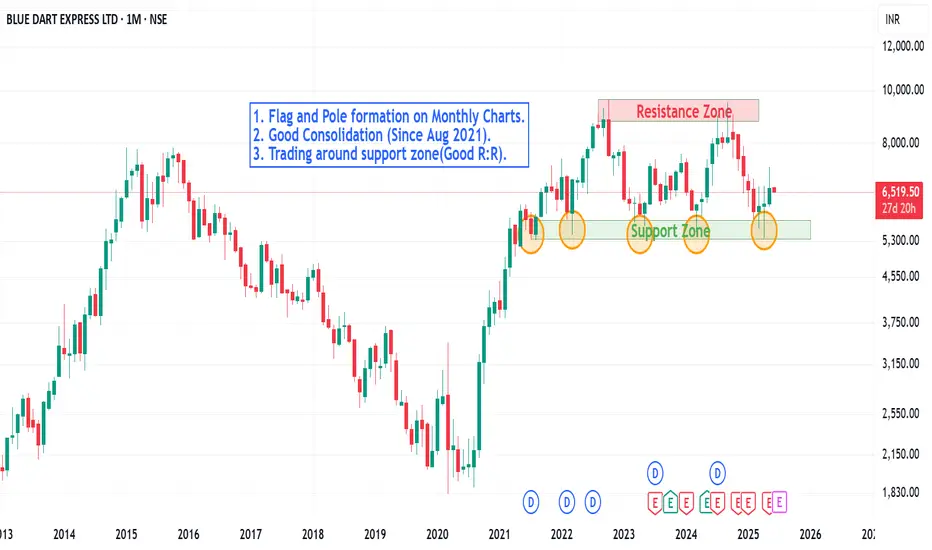
Is Bluedart Gearing Up for a Breakout? A Technical PerspectiveA good consolidation in there in the stock and on the monthly chart the stock has reconfirmed the support zone.
Major buying in happening there around 5500-5670 zone.
Weekly charts are showing consolidation phase around the very closing level as the price is trading between the various Moving averages.
A buying opportunity around 6200 levels can be initiated with a proper SL.
Technical Indicators:-
1. Stochastic : The weekly charts are trading around the oversold zone and on monthly charts its showing some lower levels coming on the charts.
2. Relative Strenght Indicator : On the monthly charts the stock has formed a bearish divergence and can be purchased once a 'W' formation is there in the RSI or price chart.
The stock has respected the support level since August 2021, a bearish trade can only be initiated once the major support level of 5500 is taken out. Avoid shorting till these levels.
Blue dart owning the logistic market can benefit from the E-commerce growth.
Long term buying opportunity can be seen in the stock with a potential returns of around 33-35% with a risk of 12-13% in coming years.
Watch the price action and enter only when the setup/pattern is formed on the charts.
Bluedartexpress
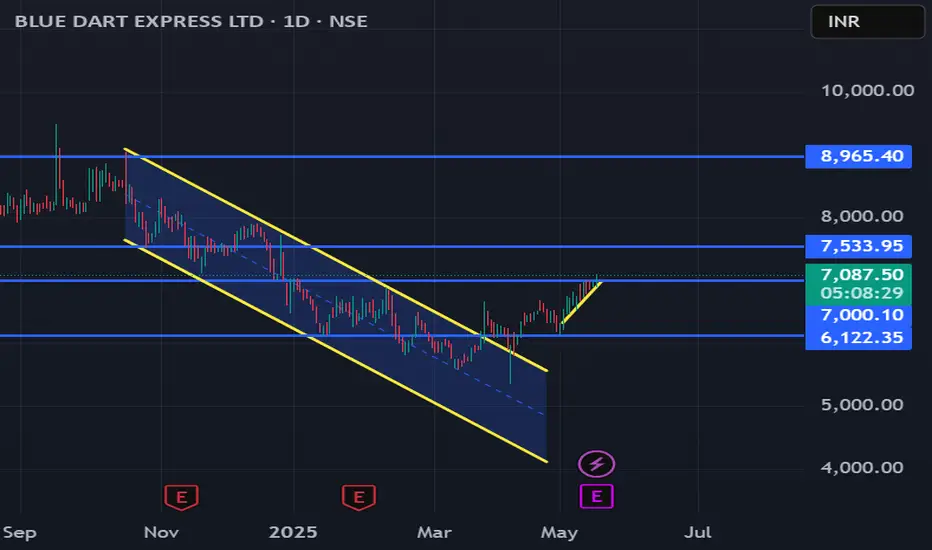
Blue Dart: Channel Breakout & Retest Above 7000Details:
Asset: Blue Dart Express Ltd (BLUEDART)
Breakout Level: 7000
Potential Targets: 7500, 8000, 8900
Stop Loss: Below 6850 or as per risk management
Timeframe: Medium to long-term
Rationale: Blue Dart has shown a confirmed breakout from a channel pattern with a successful retest above 7000. The pullback confirmation suggests renewed buying interest, targeting higher levels in the coming weeks.
Market Analysis:
Technical Setup: Breakout followed by a healthy retest strengthens the bullish setup.
Sector Strength: Increasing demand for logistics and e-commerce delivery services post-economic recovery boosts long-term fundamentals.
Risk Management:
Maintain a stop loss below 6850 to safeguard against a false breakout.
Timeframe:
Medium to long-term trend expected to continue if price sustains above breakout level.
Risk-Reward Ratio:
Highly favorable due to well-defined breakout and layered targets.
Look for increasing volume on further upmove as confirmation of trend continuation.
About to Break Parallel Channel ConsolidationNSE:BLUEDART is about to break parallel Channel Consolidation and is about to Break Key Levels. A Close above 9000 is important. Keep in Radar.
Check out my other stock ideas below until this trade gets activated, I would love your feedback.
Disclaimer: This analysis is intended solely for informational and educational purposes and should not be interpreted as financial advice. It is advisable to consult a qualified financial advisor or conduct thorough research before making investment decisions.

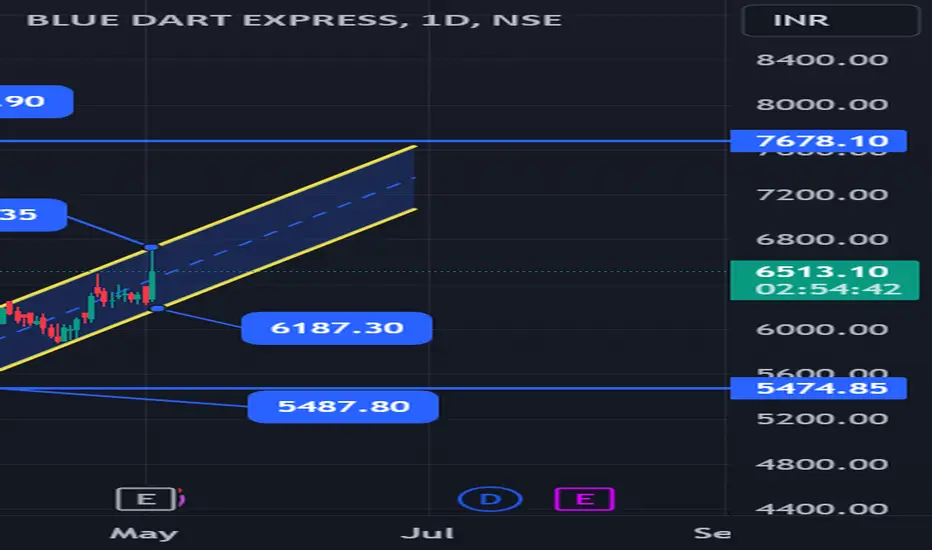
Bullish Channel Formation in Blue Dart with Strong Support LevelBullish Channel Formation in Blue Dart with Strong Support Levels
Body: The stock of Blue Dart is exhibiting a promising bullish channel pattern, suggesting an upward trajectory in the long term. The current support levels are firmly established at ₹6187 and ₹6731, providing a robust foundation for potential price appreciation.
Key Points:
Strong Support: The stock has consistently bounced off the ₹6187 support level, indicating solid buyer interest.
Resistance Break: A decisive move past the ₹6731 resistance could accelerate the uptrend.
Long-Term Target: If the bullish momentum continues, we might see the stock price reach as high as ₹7690 over an extended period.
Analysis: The technical indicators align with the bullish sentiment, as the stock is poised to continue its upward movement within the channel. Traders should monitor volume and price action closely for confirmation of the trend.
Conclusion: Blue Dart’s stock is on a path to potentially significant gains, with key support levels providing a safety net for investors. The long-term target of ₹7690 remains in sight, making it an attractive opportunity for those looking to capitalize on this momentum.
Remember to include a chart that illustrates the channel pattern and the mentioned price levels to provide a visual aid for your analysis. Good luck with your post! 📈
BLUEDART - Swing Trade Analysis - 20th April #stocksBLUEDART (1D TF) - Swing Trade Analysis given on 20th April, 2024
Pattern: CUP & HANDLE
- Volume Buildup at Resistance - Done ✓
- Resistance Breakout - In Progress
- Demand Zone Retest & Consolidation - In Progress
* Disclaimer
#bluedartexpress
