Potential Mega Breakout from Multi-Month ConsolidationTimeframe: Daily Chart | Analysis Type: Pure Price Action
🎯 Idea Summary
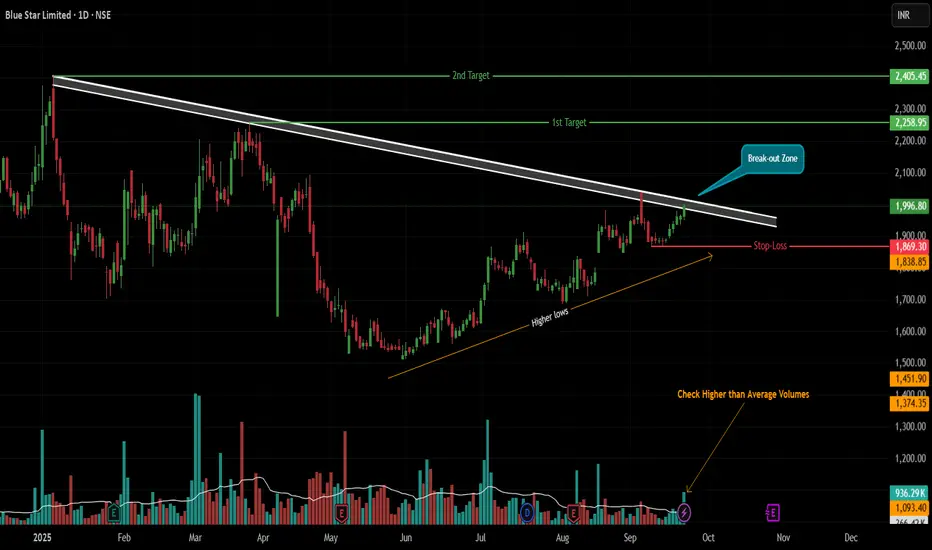
BLUESTAR is showcasing a textbook-perfect technical setup! A multi-month Descending Trendline resistance is converging with a bullish series of Higher Lows, forming a tight Volume Contraction Pattern (VCP). The stock is now squeezing at the apex, suggesting a powerful explosive move is on the horizon. A confirmed breakout could signal the start of a major bullish wave!
📊 Technical Rationale (Pure Price Action)
⚡ Major Descending Trendline (Resistance):
This key trendline originates from the swing high on 6th January 2025 📅.
It has been tested and respected as strong resistance on 25th March, 4th September, and 22nd September 2025. Each touch confirms the selling pressure. A breakout signifies a major trend reversal.
💪 Bullish Higher Lows & VCP (Strength):
Since 2nd June 2025, the stock has crafted a beautiful series of Higher Lows (HL) ↗️.
This shows buyers are aggressively defending higher levels, building a solid base for the next leg up. The contraction in price swings forms a Volume Contraction Pattern (VCP), indicating energy compression before a big expansion.
🧨 The Convergence (The Trigger):
Price is now knocking at the trendline resistance again. The coiling action is ultra-tight, suggesting a high-potential breakout is imminent!
⚖️ Trade Strategy
✅ Trigger for Entry: A BUY is triggered ONLY on a strong daily candle CLOSE ABOVE the descending trendline.
🔍 Confirmation Criteria (CRITICAL):
1) Volume: The breakout must be on VERY HIGH volume 📈. This is non-negotiable to confirm real buying interest and avoid fakeouts.
2) Candle Strength: The perfect signal is a thick, green Marubozu candle 🟢 (strong buying from open to close).
🛡️ Stop Loss (SL):
Aggressive: Low of the breakout candle.
Positional/Conservative: 1869 (The anchor of the HL structure).
🎯 Price Targets:
Target 1: 2258
Target 2: 2405
📌 Management: After T1, trail your stop loss to lock in profits on the way to T2.
⚠️ Key Considerations
⏳ Patience is a Virtue: Wait for the daily candle to CLOSE above the trendline. No premature entries!
🚫 False Breakout Risk: A weak close or low volume is a red flag. Stick to the rules.
✨ Pure Price Action: No lagging indicators. Just clean supply/demand analysis.
Disclaimer: This is an educational idea and not financial advice. Trading carries risk. Always do your own research and manage risk appropriately.
✨ Let me know if you spot the setup! Good luck and trade safe! ✨
Bluestar
BLUE STAR LTD - Technical Analysis | Triangle Pattern ________________________________________
📊 BLUE STAR LTD – Beginner-Friendly Technical & Fundamental Snapshot
Ticker: NSE:BLUESTARCO | Sector: Consumer Durables
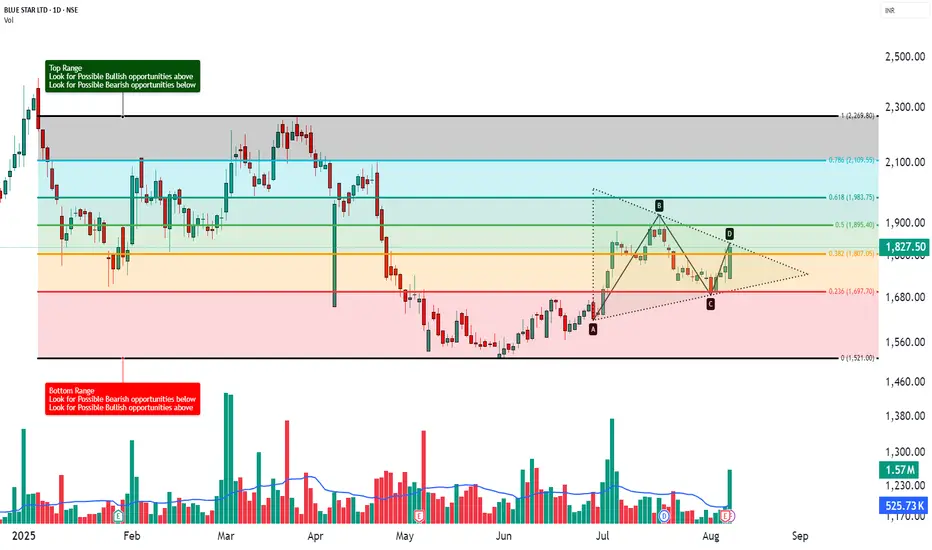
CMP: ₹1,827.50 ▲ (+3.23%) (as of August 7, 2025)
Chart Pattern: Symmetrical Triangle
Technical View: ⭐⭐⭐⭐ Neutral-to-Positive (Educational Purpose Only)
________________________________________
🔍 What’s Happening on the Chart?
BLUE STAR has formed a Symmetrical Triangle – a pattern where price moves within narrowing highs and lows 📉📈
This indicates consolidation and usually results in a strong breakout or breakdown.
📦 Triangle Range: ~₹1,616 to ₹1,922
👉 Current price is testing the upper edge — a breakout could be brewing!
________________________________________
🕯️ Candle & Indicator Analysis (Simplified)
Here’s what the chart and indicators show:
EMA 200 Crossover:
✅ Bullish signal – price is trading above its 200 EMA
RSI (~60):
🔼 Showing strength – not yet overbought
Stochastic (~92):
🚀 Near overbought – buyers in control
MACD:
⚠️ Still bearish – momentum confirmation is pending
VWAP:
✅ Aligned with bullish bias — suggests institutional support
📊 Volume Breakout:
🔺 Volume surged to 1.57 million, almost 3x the average of ~525.73k — a strong sign that big players may be stepping in as price nears breakout levels.
🧠 Trading Insight:
The chart looks bullish but still needs confirmation. Watch for a proper breakout above the triangle with volume.
________________________________________
📰 Recent News & Sentiment Update
Q1 FY26 Results (as of June 30, 2025):
📈 Total Income: ₹2,998.32 Cr (↑ 3.8% YoY)
💰 Net Profit: ₹122.23 Cr
(Source: Company Filings & Analyst Coverage)
Sentiment:
✅ Positive: Modest earnings growth, analyst support
⚠️ Caution: Target cut by some analysts — signals mixed expectations
________________________________________
🧭 Support & Resistance Levels
📌 Resistance Zones (Upside watch):
R1: ₹1,866
R2: ₹1,904
R3: ₹2,112 (measured move target)
📌 Support Zones (Downside watch):
S1: ₹1,750
S2: ₹1,680
S3: ₹1,616 (triangle base)
________________________________________
🔍 How to Trade a Symmetrical Triangle
A symmetrical triangle is a neutral pattern.
The breakout confirms direction:
– Above = potential upside 🟢
– Below = potential downside 🔴
📈 If Bullish Breakout Happens (above ₹1,860):
✅ Wait for a candle close above ₹1,860 with volume
🎯 Possible Price Zones: ₹2,000 → ₹2,165
🛑 Stop Loss: ₹1,750 (below triangle support)
📉 If Bearish Breakdown Happens (below ₹1,680):
✅ Wait for close below ₹1,680
🎯 Possible Price Zones: ₹1,500 → ₹1,375
🛑 Stop Loss: ₹1,750 (above triangle resistance)
________________________________________
🧠 STWP’s Educational Trade Idea (Not a Recommendation)
🎯 Long watch above: ₹1,839
🛑 Stop Loss: ₹1,719.50
📈 Risk-Reward Idea: Minimum 1:1; ideally aim for 1:2+
________________________________________
🔰 Trading Notes
✅ Always use stop losses
⏳ Be patient — wait for confirmation, not assumption
🚫 Don’t chase green candles or panic in red ones
📚 Trade based on structure, not emotions
💼 Risk only 1–2% of your capital per trade
🎯 Target minimum 1:1.5 Risk-to-Reward ratio
________________________________________
⚠️ Disclaimer (Read Carefully)
This post is for educational and informational purposes only.
The author is not a SEBI-registered investment advisor. No buy or sell recommendations are being made.
All views are based on chart patterns, publicly available data, and personal learning experience.
Trading involves risk. Losses can exceed your investment. Always consult a SEBI-registered advisor before making financial decisions.
By engaging with this content, you agree to these terms.
________________________________________
💬 Was this useful?
Drop your thoughts, questions, or setups in the comments below ⬇️ — let’s grow together!
🔁 Share this post with fellow traders and beginners to spread clean, structure-based learning.
✅ Follow simpletradewithpatience for beginner-friendly setups, price action insights, and disciplined trading content.
🚀 Stay Calm. Stay Clean. Trade With Patience.
Trade Smart | Learn Zones | Be Self-Reliant 📊
________________________________________
BLUE STAR LTD. – TECHNICAL ANALYSIS📈 BLUE STAR LTD. – TECHNICAL ANALYSIS
📆 Date: July 1, 2025 | ⏱ Timeframe: Daily Chart
🔍 Educational Breakdown – For Learning & Study Use Only
________________________________________________________________________________
🔹 Price Action Zones
• 🔴 Top Range (Resistance): 2417
• 🟢 Bottom Range (Support): 1521
________________________________________________________________________________
🔹 Chart Pattern: ✅
Rectangle/Box Consolidation Breakout – Price was range-bound in a tight zone and has given a strong breakout on high volume, indicating bullish intent.
________________________________________________________________________________
🔹 Reversal Candlestick Patterns
• Top Range (2417): ⛔ No recent candlestick activity visible at the top range.
• Bottom Range (1521): Todays Candle
✅ Bullish Engulfing + Strong Bullish Candle
✅ RSI Bounce + Volume Spike
✅ Confirmed by Price Action and Momentum Indicators
________________________________________________________________________________
📊 Trade Plan (Based on Reason and Logic)
🔼 Bullish Trade Setup:
• Entry: 1715 (Breakout Candle Close)
• Stop Loss: 1614.45 (Below consolidation and bullish candle)
• Target 1: 1850
• Target 2: 1980
• Reason:
o Strong breakout with above-average volume
o Multiple confirmations (RSI, Bollinger Band, Supertrend)
o Box breakout with previous supply cleared
________________________________________________________________________________
🔽 Bearish Trade Setup:
• If price fails to sustain above 1715 and closes back below 1680 zone
• Entry: Below 1665 (Fakeout confirmation)
• SL: Above 1715
• Target: 1615 / 1550
• Reason: Potential failed breakout & liquidity trap
________________________________________________________________________________
📌 Disclaimer
This analysis is shared for educational and study purposes only. It does not constitute investment advice. The author is not SEBI-registered. Please consult a SEBI-registered advisor before making trading decisions. Always use proper risk management and trade only with confirmation.
________________________________________________________________________________
💬 Comments
What’s your view on Britannia?
Drop your thoughts and chart setups
________________________________________________________________________________

Rounding Bottom Breakout – HUGE 8:1 R/R Setup!NSE: BLUESTARCO | Timeframe: Daily
🔥 Key Observation:
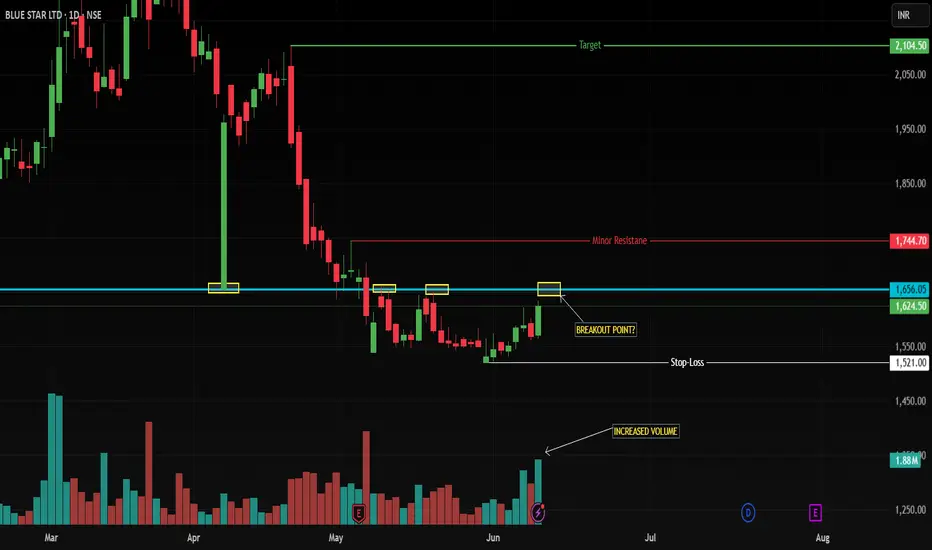
BlueStar is painting a textbook Rounding Bottom reversal pattern – a bullish signal indicating exhaustion of sellers and accumulation by smart money. Current price (1624.50) is coiling near the make-or-break resistance at 1656. A breakout here could ignite a massive rally!
🎯 Trade Plan: Precision Execution
⏱️ TRIGGER:
BUY ONLY ON CONFIRMED BREAKOUT ABOVE 1656
Must see: Strong green candle + Volume > 20% above average
NO BREAKOUT = NO TRADE. Period.
🧯 STOP LOSS (SL):
1521 (swing low below pattern – technical invalidation)
Risk: Just 8.1% from 1656 entry.
🎯 TARGETS:
TP1: 1744 (minor resistance – book 50% here)
TP2: 2100 (measured move target – 27%+ from breakout)
Reward/Risk: 8.4x (Rare asymmetry!)
📊 Why This Works:
Rounding Bottom: Classic reversal pattern after a downtrend – signals long-term trend shift.
Volume Confirmation: Breakout with rising volume = institutional participation.
SL Placement: Below the pattern’s trough (1521) invalidates the setup.
Target Rationale: 2100 aligns with the historical liquidity zone.
🚨 Critical Risk Controls
❗ NO BREAKOUT = NO TRADE.
❗ If breakout lacks volume, REJECT the trade.
❗ Partial exit at 1744: Trail SL to 1650 (breakeven) for remainder.
💡 Trader Psychology Edge
FOMO KILLS: Chasing before 1656 risks getting trapped in fakeouts.
Patience = Profit: Wait for the market’s confirmation – this is where pros separate from amateurs.
Trade Like a Sniper: One clean shot at 1656+volume, or walk away.
Disclaimer: This is not financial advice. Always do your own research. Charts are for educational purposes.
Bluestar Cup and handle pattern breakout AC theme, data centre theme, bluestar new star again in bull trend
could possibly be again rally from these levels more upside visible.
strong company strong sector growth strong management and clean chart structure
targets in chart


Breakout in Blue Star...Chart is self explanatory. Entry, Targets and Stop Loss are mentioned on the chart.
Disclaimer: This is for demonstration and educational purpose only. This is not buying or selling recommendations. I am not SEBI registered. Please consult your financial advisor before taking any trade.

BLUESTARCO: All-Time HighCMP: 1157
- The stock is showing strength against the market structure
- Trading 6% away from its All-Time High
- Above important EMAs

Breakout Idealevels are on the chart.
let's see when the target gets hit.
Learn and earn.
this chart analysis is just for the learning

Global Sentiment MattersCup and Handle Pattern formation.
The breakout did not n done.
Global sentiment is negative.
Levels are on the chart.

BLUESTAR - Swing Trade - ATH breakoutThe analysis is done on daily TF hence price may take few days to few weeks in order to reach the targets.
Trade setup is explained in image itself.
The above analysis is purely for educational purpose. Traders must do their own study & follow risk management before entering into any trade
Checkout my other ideas to understand how one can earn from stock markets with simple trade setups. Feel Free to comment below this or connect with me for any query or suggestion regarding this stock or Price Action Analysis.

#bluestarTRADE OR INVEST wisely.
WE CAN JUST PREDICT.
Disclaimer: I am not a SEBI registered advisor , so before entering on my view plz ask your SEBI Registered Advisor . Profit is your and loss is your.
PLEASE LIKE AND SHARE IF YOU AGREE WITH THE IDEA

Long BluestarBluestar
Cmp - 813
Stop - 690 on DCB
Expectation -
T1 - 1100
T2 - Open, Review at 1100
Expected Holding Period - 240 trading days or earlier for T1
View:- Swing/Positional
Disclaimer:-
Ideas being shared only for educational purpose
Please do your own research or consult your financial advisor before investing

Buy BlueStarBuy BlueStar near 825-830 area, Stoploss 800 Target above 850
Study: Structure Breakout + Retest


Bluestar - Falling wedge - Trade easy Price forming a falling wedge pattern and it is going to break up very soon.

blue starHarmonical pattern made cup with handle @ end
---------------------------------------------------------------------
according to me break out point will be 690.60
so you can buy above 690.60 .
---------------------------------------------------------------------
so 1st target - 800 (161.8%)
2nd target - 900 (261.8%)
-------------------------------------------------------------------
________________
THANKS..
________________


Bluestarco looking fallMay touch 769 and 761.
more levels on the chart.
Analysis is for my own study purpose.


BLUESTAR is near its resistanceBlustar resisted from its swing high 562. 585-562 is supply zone for Bluestar. Once broken this level, buy can be initiated.

BLUESTAR LONG OR SHORT ..?Long if sustained above 522 sl 493.9
Short if sustained below 494 sl 522.1
Target levels are as marked
**Educational Purpose only
