BNBUSDT.P – 1D | High RR Trend-Continuation SetupBNB is forming a higher-low structure after a prolonged correction and is now reacting from a key demand / flip zone aligned with the ascending trendline. Price acceptance above this level can lead to a strong upside expansion.
🔹 Market: BNBUSDT Perpetual (Bitget)
🔹 Timeframe: 1 Day
🔹 Bias: Bullish continuation
🔹 Entry Zone: Demand / Structure support
🔹 Stop Loss: Below invalidation level
🔹 Targets:
TP1: Previous supply / range high
TP2: Major resistance zone
TP3: Higher-timeframe liquidity area
📌 Confluence Factors:
Higher-low market structure
Trendline support
Previous resistance turned support
Clean risk-to-reward profile
📈 As long as price respects the marked demand zone and holds the trendline, upside continuation remains favorable.
⚠️ A daily close below support invalidates the setup.
💡 Trade with strict risk management. This chart reflects technical analysis, not financial advice.
BNBUSDT

BNB Price Forecast 2026 | Is $10K/BNB Possible? | Analysis By CPBNB has shown strong price action recently. After bouncing from the $500 support zone, price moved higher, broke the previous all-time high, and successfully cleared the $700 resistance, which is now acting as a strong support area.
Currently, BNB is consolidating around the $800 level, suggesting the market is digesting the recent move.
Technical Overview
Multi-year ascending trendline: Still intact, indicating long-term bullish structure.
Major support zone: $500–$800
This range has acted as an accumulation area during previous pullbacks.
Current structure: Sideways consolidation near $800 after a strong breakout.
Possible Scenarios
Bullish continuation:
If BNB holds above $800 and breaks higher with volume, continuation toward higher levels is possible.
Pullback scenario:
If price drops below $800, a retest of $700–$500 could occur. Historically, this zone has provided strong demand and may attract long-term buyers.
Long-Term Perspective (Cycle-Based)
Bull market target (speculative): Around $3,000
Macro cycle projections (high risk & speculative): $10,000–$20,000
These levels are not predictions, but potential zones based on historical cycles, trend strength, and broader market conditions.
Key Takeaway
The overall structure remains bullish as long as price stays above major support levels. Consolidations and pullbacks within an uptrend are normal and often help reset the market before the next move.
This is an educational analysis only. Not financial advice.
Always manage risk and do your own research (DYOR).

$BNB Technical Analysis: Why $10,000 Is On The RadarBNB Technical Analysis: Why $10,000 Is On The Radar
1️⃣ Historical Precedent
2021 Bull Run: +1,950%
2027 Projection: +1,900% (based on same chart pattern & price structure)
Repeating patterns suggest massive green candles could follow.
2️⃣ Key Support Zones
Strong long-term support: $500 & $200 ( Accumulation zone )
Support is holding, signaling a high-probability base for a breakout.
3️⃣ Price Targets
Short-term: $2,000 → $5,000
Long-term: $10,000 🎯
This aligns with historical price mechanics and measured growth potential.
4️⃣ Risk Management
Accumulate gradually; avoid FOMO buys
Always DYOR & understand support/resistance levels before entering
TA Insight:
BNB shows a pattern identical to previous bull cycles. Breaking current resistance levels could trigger an explosive upward trajectory.
CRYPTOCAP:BNB is technically primed. If you’re strategic now, you’re positioning for multi-year gains.
NFA & DYOR

$BNB: Key HTF Decision Zone AheadCRYPTOCAP:BNB : Key HTF Decision Zone Ahead
#BNB is still holding above the critical $700–$550 demand zone, the same area that defines the continuation or breakdown of the current macro trend. As long as price maintains this support, HTF structure stays bullish and the next expansion wave targets $1500 → $2000 → $2500 → $3000.
A weekly close below $550 would flip structure bearish and open a deeper correction toward $250–$170.
Key Levels
Accumulation Zone: $700–$550
Upside Targets: $1500 / $2000 / $2500 / $3000
Invalidation: Weekly close < $550
BNB is at a major decision point: Hold the zone and bullish momentum accelerates; lose it and trend resets.
NFA & DYOR

Major Cycle in Crypto Market (Attention Hedge Funds)Cycle-1: Bitcoin’s First Major Boom–Bust Structure (2013–2015)
(Screenshot-1 Breakdown)
Understanding Bitcoin’s historical behaviour is essential for forecasting macro-cycles in the crypto market. This post is the first of a 4-part series, where each screenshot highlights a repeating structural pattern in BTC’s long-term market psychology. After all four cycles are explained, I will present the combined Buy, Sell or Hold conclusion for long-term investors and institutional desks.
🟦 Cycle-1 Overview (April 2013 – January 2015)
In the first major structural cycle of Bitcoin, a very clear macro behaviour emerged — a pattern that continues to repeat across all future cycles.
🔵 Step 1 — ATH (A) Formed (April 2013)
Bitcoin printed a strong All-Time High (A) in April 2013, marking the top of its first major momentum wave.
🟢 Step 2 — Breakout Above ATH (A) → New ATH (B) (Nov 2013)
Once BTC broke above Point A, it entered an aggressive parabolic rally, setting a new ATH (B) in November 2013.
This breakout phase triggered:
FOMO-driven retail participation
Sharp acceleration in volatility
Rapid expansion in price multiples
🔴 Step 3 — Post-Breakout Collapse: -75% to -80% Drawdown
After forming ATH (B), Bitcoin failed to sustain the parabolic breakout.
A deep correction followed:
–75% to –80% decline
Capitulation phase
Panic selling and liquidity contraction
This phase marks the beginning of the macro mean-reversion cycle, a consistent signature in BTC’s long-term structure.
🟣 Step 4 — Price Returns to Previous ATH (A)
The most important element of Cycle-1:
After making a new ATH (B), Bitcoin retraced back to the previous ATH (A)
Time taken: 15–17 months
This behaviour is extremely rare in traditional markets but has repeated consistently in Bitcoin’s long-term structure.
📌 Why This Cycle Matters
Cycle-1 establishes the foundation for a powerful historical pattern:
BTC tends to fall back to its previous ATH after forming a new ATH.
This phenomenon repeats due to:
Leverage washouts
Liquidity resets
Miner capitulation
Long-term holder profit-taking
Macro monetary tightening phases
This is Cycle-1.
In the next screenshots, we will see how Cycle-2, Cycle-3, and Cycle-4 follow the same structural behaviour.
⏭️ Coming Next (Screenshot-2):
“Post-2017 Cycle — New ATH → 83% Crash → Return to Previous ATH.”
Cycle-2: 2017 Parabolic Expansion → 2018–2019 Reset (Screenshot-2 Breakdown)
This is the second chart in the ongoing 4-part series highlighting Bitcoin’s macro boom-and-bust rhythm—a structural pattern that repeats regardless of market participants, liquidity cycles, or macroeconomic conditions.
Cycle-2 again confirms that Bitcoin follows a highly predictable long-term retracement behaviour after every breakout to a new All-Time High.
🟦 Cycle-2 Overview (2017–2019)
This cycle mirrors the exact structure of Cycle-1:
Break previous ATH
Establish new ATH
Drop –75% to –80%
Return to previous cycle’s ATH
Time duration: 15–17 months
Let’s break down the chart step-by-step.
🔵 Step 1 — BTC Breaks Previous ATH on May–June 2017 (Point E)
In early 2017, Bitcoin broke the previous cycle’s ATH (from 2013–2014).
This breakout point is marked as:
Point E (May–June 2017)
Acts as the new cycle support
Represents the start of the parabolic expansion leg
This breakout confirms institutional liquidity entry and the beginning of a classic crypto macro-cycle.
🟢 Step 2 — Massive Rally to New ATH (Point F) — Dec 2017
After the breakout at E, Bitcoin entered its most aggressive historical rally:
BTC exploded into a full parabolic top
New ATH formed at Point F (Dec 2017)
Extreme retail inflow and speculative leverage
ICO mania peak
This is similar to the 2013 pattern—breakout → acceleration → parabolic top.
🔴 Step 3 — Reversal and Deep Crash: –75% to –82%
Post-ATH, Bitcoin collapsed sharply:
Total Drawdown: –75% to –82%
Duration: 455 days (≈15 months)
Angle of correction: Steep capitulation slope (as shown in your chart)
ICO bubble burst + liquidity draining
Dominance reset + long-term distribution
The depth and duration match Cycle-1 almost exactly.
🟣 Step 4 — Price Re-tests Previous ATH Zone (Point G — Mar 2019)
Just like Cycle-1, Bitcoin returned precisely to the previous breakout area:
Cycle Support (E) → Retest at G
Time Duration: ≈15–17 months
Price forms a demand zone around the previous ATH
Bottoming structure completes at G (March 2019)
This confirms again:
Bitcoin always re-tests its previous ATH after forming a new ATH — within a fixed time band of ~15–17 months.
Cycle-2 perfectly aligns with the behavioural signature of Cycle-1.
📌 Why Cycle-2 Matters to Institutions
This cycle reveals Bitcoin’s predictable macro liquidity reset pattern:
Break previous ATH → Excess speculation → Parabolic top
Systemic deleveraging → –80% correction
Return to previous cycle’s ATH support
Fresh long-term accumulation
This behaviour is structurally identical across multiple halving cycles.
Cycle-3: 2020 Breakout → 2021 Mania → 2022–2023 Reset (Screenshot-3 Analysis)
This third chart demonstrates the strongest confirmation of Bitcoin’s repeating macro-cycle structure.
Despite greater institutional involvement, derivatives expansion, and global liquidity changes, Bitcoin still respected the same 75–80% retracement and 15–17-month correction window.
Cycle-3 proves the pattern is structural, not accidental.
🟦 Cycle-3 Overview (2020–2023)
Like previous cycles:
BTC breaks previous ATH
Creates a new ATH
Drops –75% to –80%
Comes back to retest the previous ATH
Same time duration: ~15–17 months
Let’s decode the chart.
🔵 Step 1 — BTC Breaks Previous ATH in Nov–Dec 2020 (Point H)
Bitcoin broke the 2017 ATH during late 2020:
Breakout Point H (Nov 2020)
This previous ATH (Point F = Point H) becomes the new major cycle support zone
Triggered institutional FOMO: MicroStrategy, Tesla, hedge funds
This breakout ignited the strongest bull run in Bitcoin’s history.
🟢 Step 2 — Bitcoin Forms a New ATH in Nov 2021 (Point I)
Following the breakout at H:
BTC surged to a macro ATH at Point I (Nov 2021)
Fueled by:
Unlimited liquidity (pandemic QE)
Institutional buyers
ETF expectations
Retail mania & leverage
This top perfectly mirrors the parabolic peaks from 2013 and 2017.
🔴 Step 3 — Deep Macro Crash: –75% to –80%
After the November 2021 top:
BTC entered a systemic deleveraging phase
Complete 2022 crypto meltdown:
Luna collapse
Celsius, Voyager, BlockFi
FTX implosion
Price fell 77% from the ATH
Duration: 485 days (~16 months)
Exactly the same timing window as the previous two cycles.
🟣 Step 4 — Retest of Previous ATH Support (Point J — Mar 2023)
Just like Cycle-1 (2013 → 2015)
and Cycle-2 (2017 → 2019):
Bitcoin again returned exactly to its previous ATH zone:
Support Retest Point J (Mar 2023)
Perfect touch of the 2020 breakout zone
Massive demand entered the market
Cycle bottom completed right on schedule
This completes the third full repeat of BTC’s long-term structural cycle.
📌 Institutional Takeaway
Cycle-3 confirms:
Bitcoin’s macro behaviour is identical across 2013, 2017, and 2021 cycles — regardless of market maturity.
Every time Bitcoin breaks its previous ATH:
It creates a new parabolic peak
Then crashes 75–80%
Then returns to retest the previous ATH level
All within a consistent 15–17 month window
This makes Bitcoin the most predictable high-beta asset on the planet at a macro timescale.
Cycle-4: Oct-2024 Breakout → Oct-2025 ATH → Mar-2027 Retest of Legacy Support
After analyzing the previous three Bitcoin macro cycles (2013–2015, 2017–2019, 2021–2023), the new chart strongly suggests that Bitcoin is following the exact same structural behaviour for the 4th time.
This idea explains why BTC may enter a 15–17 month decline starting from the Oct-2025 macro top, and why the next major demand zone sits around 30,000 USD in Mar-2027.
🟥 1. Break of Previous ATH (I = K) — Oct 2024
Bitcoin broke above its previous ATH zone in Oct 2024, exactly like in all earlier cycles:
2013 ATH break → 2013 bull run
2017 ATH break → 2020–2021 bull run
2021 ATH break → 2024 surge
2024 ATH break → current cycle
This breakout (I = K level) becomes the new structural support for the cycle bottom later.
🟩 2. BTC Forms New Macro ATH (Point L) — Oct 2025
One year later, Bitcoin printed a new ATH around Oct 2025, marking the peak of Cycle-4.
Previous cycles also peaked approx. 11–14 months after breaking the last ATH, which strengthens this model.
🔻 3. Post-ATH Crash Begins — Same Pattern, Same Angle, Same Duration
All 3 previous cycles share:
• 75%–80% decline
• Duration: 15–17 months
• Final target: previous ATH or the ATH-1 level
Your chart highlights the same decline angle and same time window (Oct-2025 → Mar-2027).
This is exactly what Bitcoin has done before:
Cycle ATH → Bottom Duration Drop Retest Level
2013 → 2015 15 months –86% Previous ATH
2017 → 2019 17 months –84% Previous ATH
2021 → 2023 16 months –77% Previous ATH
2025 → 2027 (Prediction) 15–17 months –75% to –80% Previous ATH
Nothing in the 2024–2025 structure breaks this long-term behaviour.
🟦 4. Current Price Near “N” = Retesting Breakout Support
BTC is currently trading back near the Oct-2024 breakout level, marked as:
N = Previous ATH Support Zone
Historically, this level is not the final bottom.
It is only the first macro support touch before the full 75–80% correction completes.
Because the full 15–17 month window has not yet played out, a deeper decline remains statistically likely.
🟡 5. Final Prediction — BTC Bottom Around 30,000 USD (Mar-2027)
Following cycle symmetry:
Top: Oct-2025
Drop duration: 15–17 months
Bottom: Mar-2027 (same month as previous major bottom in Mar-2023)
Target zone: $30,000 ≈ last-to-last ATH (2020 level)
This fits perfectly with all 4 historical cycles.
This means BTC may revisit the deep demand zone before the next major bull cycle begins.
📌 Final Outlook (Important for Long-Term Investors)
If Bitcoin truly repeats its macro cycle:
The best long-term buying opportunity would occur in Mar 2027
Price reading: $28K–$32K
After that, BTC begins Cycle-5 (likely targeting $180K–$250K)
This idea is not short-term trading advice; it is a macro-cycle pattern that has consistently repeated for 12+ years.
🟡 BUY / SELL / HOLD — Clear Conclusion
SELL / REDUCE RISK
If you are a trader or short-term investor, Bitcoin is in the post-ATH declining phase, which historically produces 15–17 months of lower prices.
HOLD (Long-Term Only)
Long-term holders can remain calm but should expect deep volatility, not straight-up movement.
BUY (Smart Accumulation Window)
The next high-conviction buying zone will be:
🔥 $28K–$32K
🔥 Timeline: Mar 2027
That will be the start of the next Bitcoin mega cycle (Cycle-5).
📢 Final Message
This research is not about fear or hype—it is about Bitcoin’s consistent repeating macro behaviour.
Every single major crash and rally of the last decade followed the same timing, structure, and depth.
Bitcoin is not random.
Bitcoin is cyclical.
And the cycle says:
**The real bottom is not here yet.
The real opportunity comes in 2027.**

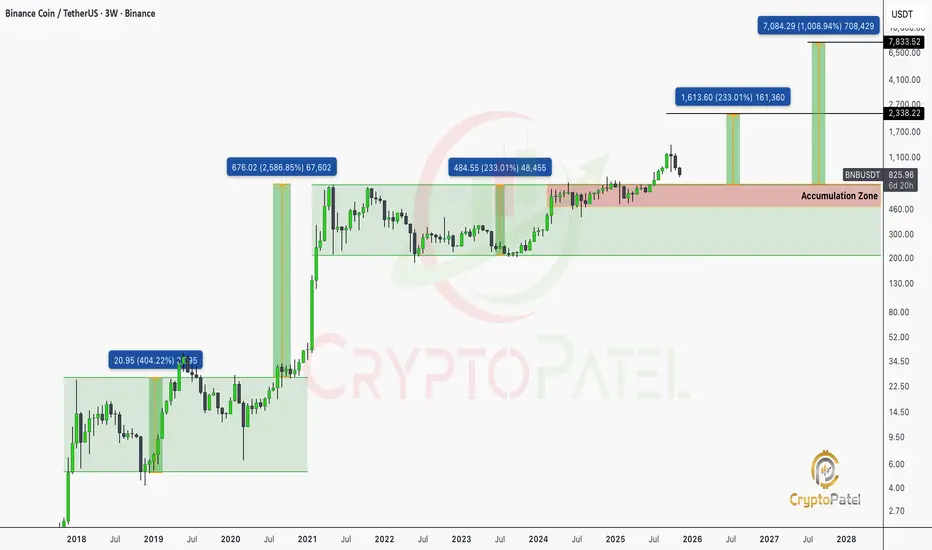
BNB/USDT 3-Week Chart Analysis: Is a Massive Breakout Coming?BNB/USDT 3-Week Chart Analysis: Is a Massive Breakout Coming?
Current Price: $827.05 (down 10.74%)
BNB is currently consolidating in a key Accumulation Zone between $700-$800, signaling institutional accumulation and balance.
Key Levels to Watch
Support Zones:
🔹 $484.55 – Critical demand from 2023 lows
🔹 $676.02 – Former ATH turned support
🔹 $700-$750 – Bottom of current accumulation
Resistance Targets:
🔹 $1,613 – First major upside
🔹 $2,338 – Next intermediate target
🔹 $7,084 – Long-term “moonshot” scenario
Volume & Structure Insights
🔹 2019 Breakout: Started the long-term uptrend
🔹 2021 Bull Run: Peak at $676, classic blow-off top
🔹 2024-2025 Accumulation: Renewed institutional interest
Bearish Risk
🔹 Failure to hold $700 → Retest $484 (-41%)
🔹 Breakdown below $484 → Bullish thesis invalid
NFA & DYOR
BNB/USDT – Bullish Reversal Idea | Demand Zone Reaction📌 Overview
BNB is currently trading at a major higher-timeframe demand zone, showing early signs of accumulation after a sharp sell-off. Price has tapped the demand area multiple times and is holding without breaking structure to the downside.
This setup is based on a potential short-term reversal or a relief bounce.
📍 Analysis
🔹 Demand Zone
Price is reacting from a clean demand zone created by previous strong bullish displacement.
Multiple wicks show buyers defending this level.
🔹 Market Structure
Prior strong downtrend
Price now consolidating at support
Lower timeframe shows slowing bearish momentum
🔹 Entry Logic
A long entry is placed at the reaction zone, anticipating a bounce toward the nearest inefficiency / supply zone above.
🎯 Trade Setup
🟩 Long Position Idea
Entry: At demand zone
Stop-Loss: Below the liquidity wick / zone low
Take-Profit: Previous structure high or the first major supply zone above
This gives a clean R:R setup (as shown in chart).
⚠️ Risk Management
Only risk what you can afford to lose
If the zone breaks cleanly, setup is invalid
Wait for candle confirmation if you want safer entry
📌 Final Thoughts
BNB is at a critical make-or-break level. If buyers hold this zone, a strong bounce is likely. If not, expect continuation lower.
Publishing this to track market reaction and trade execution.

BNB COIN: Breakout Expected1. Testing the resistance of ATH.
2. Bouncing from the EMA.
2. Dz is playing out for the price to push to the higher levels

BNB/USDT – Bullish Breakout Trade Idea✅ Entry: 871.564
🎯 Target: 890.455
⛔ Stop Loss: 862.304
🔎 Trade Rationale:
Ascending Triangle Breakout – Price has respected the rising trendline and finally broken above the neckline resistance, signaling bullish continuation.
Volume Confirmation – A notable increase in buying volume supports the breakout strength.
Resistance Flip – The previous supply zone around 870 has turned into support, adding confluence.
📊 With a strong bullish structure and favorable RRR, this setup aims to capture the next push towards 890 zone.
⚠️ Disclaimer: This is not financial advice. Always do your own research and manage risk before trading.

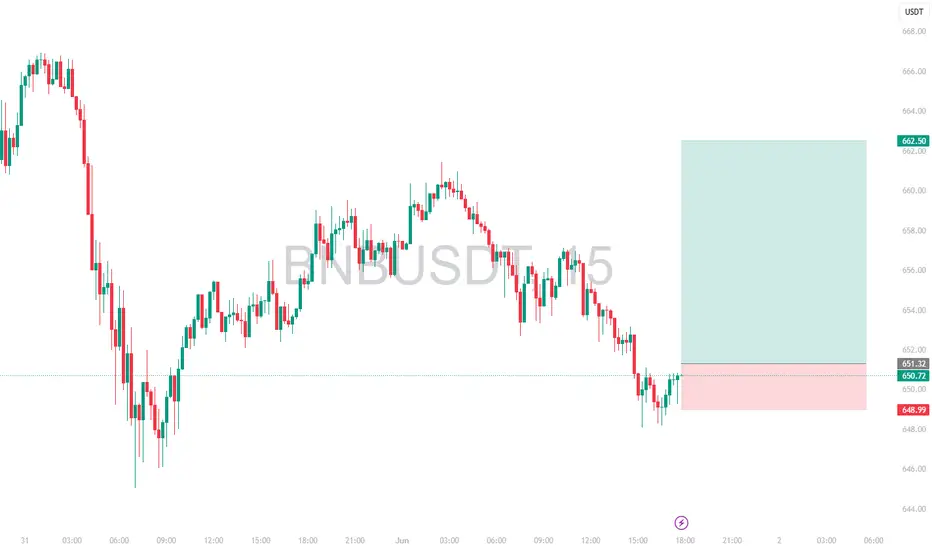
Intraday Long Setup | June 1st 2025 | Valid Until Daily ClosePrice has retraced to a strong pivot zone (marked by the red box).
Structure remains bullish with potential for continuation after pullback.
The green box represents a high-probability long opportunity with tight risk control.
Watch for price reaction within the red zone. Entry only if confirmation (e.g., bullish engulfing, strong wick rejections) appears.
The setup expires at end of the daily candle close.
Mkt Weak, Towards Shortit's looking weak at high
it has not hold properly at any higher level
Looks More Towards Bear Side

BNBUSDT: A Bullish Setup or a Trap? Key Levels to WatchYello Paradisers! Have you noticed the recent move in BNBUSDT? 📈 Could this be the breakout we’ve been waiting for, or is a retracement lurking in the shadows? Let’s break it down.
💎BNBUSDT has recently formed an inverse head and shoulders pattern, which also aligns with a bull flag formation on the higher timeframe—both strong indications of bullish potential. However, as disciplined traders, we must remain cautious and consider all scenarios.
💎If BNBUSDT breaks out and closes a candle above the resistance zone, the likelihood of a sustained bullish move significantly increases. This would confirm the breakout and signal a potential rally.
💎On the other hand, the probability of a retracement remains on the table. Should this happen, we would look for a bounce from the bullish order block (OB). To further increase the probability in our favor, waiting for a bullish internal change of character (I-CHoCH) would be prudent before entering any positions.
💎However, in the case of a breakdown with a candle close below the Bullish OB, the entire bullish idea would be invalidated. If this happens, patience will be key—waiting for stronger price action at better levels will provide higher-probability setups.
🎖This is why, Paradisers, we emphasize the importance of strategy and discipline in trading. Whether it's a breakout or breakdown, sticking to your plan is the only way to achieve long-term success. Stay vigilant, stay patient, and always trade smart. 💪
MyCryptoParadise
iFeel the success🌴

BNBUSDT
If the BNB/USDT closes near the 720 USDT zone, and based on Ichimoku analysis, a target of 1900 USDT can be expected as long as:
Tenkan-Sen is above Kijun-Sen (indicating an uptrend).
Senkou Span A is above Senkou Span B (strong support zone).
Chikou Span is above the current price (confirming the trend's strength).
In this case, further upward movement towards 1900 USDT is possible if the trend remains strong, with 720 USDT acting as support.

Btc sentimental targets I mean bull run market sentiment targets,
Target mentioned this chart
#elonTrump crypto time
Note: analysis is not new, its still old.(Already analysis from November session)
Analysis coming from smc and price action both analysis in collaboration.
Happy trade and good luck.
Take idea only for reference
Be not serious¡!!!!!!!!
Tools used : smc, price actioning, and custom Fibonacci formula with 1.618 find for supply reacting of trading method.(Reference) 😁

Slowly price cut toBINANCE:BNBUSDT
Bnb nice choice to hold in your bag. Little bit correction is coming I think this comes nearly 5880
Don't worried about BNB
I think buy on that number TGT 700 stop 550.
Good luck

BNBUSDT Poised for a Bearish Move? Critical Levels Ahead!Yello Paradisers! Are we witnessing the beginning of a bearish turn for BNBUSDT? The probability is definitely increasing, and here’s what you need to watch.
💎BNBUSDT has already taken liquidity and shown a Change of Character (CHoCH), signaling a shift toward a bearish market structure. If the price moves upward from here and displays an Internal Change of Character (I-CHoCH) from the resistance zone, it will significantly boost the chances of a further bearish trend.
💎However, if the price breaks down and closes a candle above the resistance zone, this would invalidate our bearish scenario entirely, requiring us to reconsider our strategy.
🎖 Paradisers, as always, discipline is key. Waiting for confirmation before acting ensures you stay on the right side of the trade. Stay focused, stay patient, and play it smart!
MyCryptoParadise
iFeel the success🌴

Is BNBUSDT on the Brink of a Major Bullish Breakout?Yello! Did you see how BNBUSDT has taken liquidity and formed an inverse head and shoulders pattern? This setup is raising the odds of a bullish move! But there's more to the story. Let’s dive into the details:
💎For this bullish scenario to play out, BNB must break out of the resistance zone and close a candle above it. This would indicate a potential move up to the next swing or resistance levels.
💎In the event of a pullback, we can anticipate a bounce from the Bullish Order Block (OB). However, for confirmation, we need to see an I-CHoCH (internal Change of Character) that aligns with a bullish market structure. This would further increase the probability of a favorable outcome.
💎On the flip side, if the price breaks down below the Bullish OB and closes a candle beneath it, our entire idea and pattern would be invalidated. This would suggest a different market direction, requiring us to reassess our strategy.
As always, it's crucial to stay disciplined and patient. The market can be unpredictable, and only those who stick to their strategies will thrive.
MyCryptoParadise
iFeel the success🌴

TECHNICAL ANALYSIS $BNB 12-JULThe daily trend is bearish, the bottom at CRYPTOCAP:BNB is at an unknown place (without any resistance), so it is likely to continue to decline.
The beginning of the daily downtrend is the old peak - where there is strong selling force, so it further supports the bearish factor.
H4 is in a recovery wave, we don't know where it will return, but a maximum of $580 is a strong supply zone.
BNB is in a downtrend and CRYPTOCAP:BTC is also in a downtrend so simply don't buy.
Wait for confirmation of price increase to buy later.

Massive BNB Breakout Imminent? Don’t Miss This Crucial Analysis!Yello Paradisers! Are you ready to dive into a potential game-changing move for BNB? Let’s get into the details.
💎 The recent bullish momentum has broken key levels, indicating potential for further gains.
💎 BNB is showing signs of inducement near the bullish OB, a key area to watch.
💎 If BNB breaks the resistive trendline and forms a W pattern, the probability of a bullish move increases.
💎 For confirmation, we need a breakout above the resistance zone. This could signal a strong bullish move.
💎 In case of a pullback, a bounce from the bullish OB is expected. However, we need a Change of Character (I-CHoCH) in lower timeframes for confirmation.
💎 If BNB breaks down and closes below the bullish OB, it invalidates our bullish thesis.
Trade smart, Paradisers, and stay disciplined. Your long-term success depends on strategic and well-timed moves.
MyCryptoParadise
iFeel the success🌴

Bullish Pennant Breakout: Retest Targets $1,000 MilestoneBinance Coin ( CRYPTOCAP:BNB ) has recently formed a bullish pennant pattern, suggesting a strong potential for upward movement. This technical formation, characterized by converging trend lines following a significant price increase, indicates that the market is consolidating before potentially continuing its upward trend.
The breakout from this bullish pennant has been accompanied by substantial trading volume, reinforcing the likelihood of a sustained move higher. With the retest of the breakout level successfully holding, the technical outlook is bullish, pointing to a potential target of $1,000. Achieving this target would represent a significant 68% return from the current price level, offering a promising opportunity for traders and investors.
Key factors to watch include the continuation of high trading volume and maintaining the breakout level support, which will be crucial in confirming the strength of this bullish move towards the $1,000 target.

BNBUSDT's Cup & Handle: Ready for a Bullish Surge?💎 Paradisers, #BNBUSDT has formed a cup and handle pattern, increasing the likelihood of a bullish move.
💎 If #BNB closes a candle above the resistance zone, it will validate the pattern, and we can then expect a bullish move.
💎 In the case of a pullback, we can anticipate a bounce from the demand level, but we need an Internal Change of Character (I-CHoCH) towards the bullish market structure for confirmation.
💎 However, if there is a breakdown and a candle closes below the demand level, it will invalidate our entire bullish idea. In that case, it would be better to disregard this setup and wait for more favorable price action to develop.
MyCryptoParadise
iFeel the success🌴

BNB into the 1000s#BNB / Weekly
We are currently ranging for the past 3 years and a break above the range resistance will put BNB above 1000

1 $BNB = 1000 USDT:BINANCE:BNBUSDT is expected to reach 1k USDT soon, with a lot of upcoming news.
If you spot any market dips, don't let them pass you by.
While it may take some time, But, investing in Binance is regarded as a safe bet in the crypto market.
