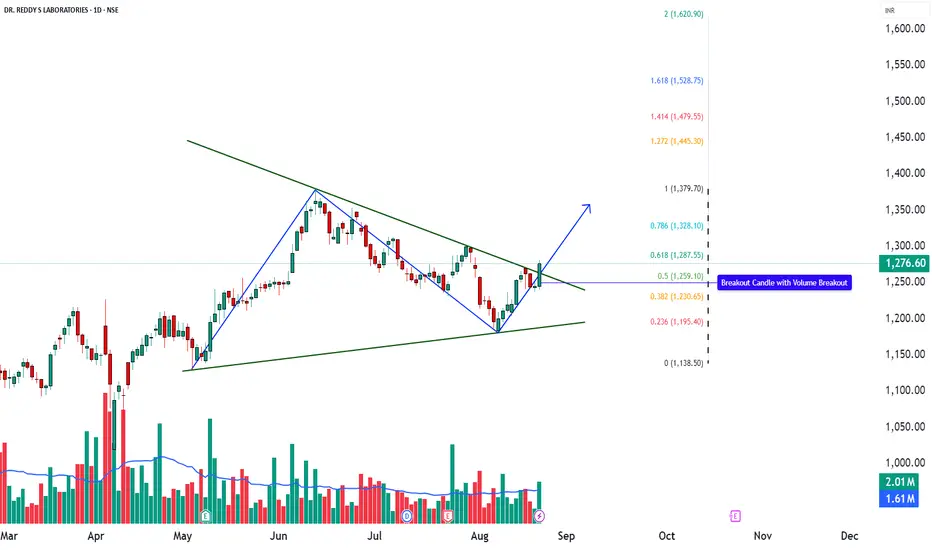
DRREDDY – Triangle Breakout in Play📊 DRREDDY – Technical & Educational Snapshot
Ticker: NSE: DRREDDY | Sector: 💊 Pharma
CMP: ₹1,276.60 ▲ (+2.51% | 22 Aug 2025)
Rating (for learning purpose): ⭐⭐⭐⭐ (Moderately Bullish)
Pattern Observed: 📈 Triangle Breakout with Volume Confirmation
📰 Sentiment Analysis
👉 Overall Sentiment: Positive ✅
• Bullish Drivers: Breakout from triangle formation, Morning Star on daily, bullish PinBar on monthly, strong Q1 results with revenue & profit growth, and renewed interest in pharma sector due to healthcare demand.
• Risks (Bearish Case): Any failure to sustain above ₹1,250 or renewed pressure from regulatory issues/patent challenges could trigger pullbacks.
• Short-term Outlook: Strong breakout with momentum, but some cooling-off likely due to Stochastic overbought levels.
• Long-term Outlook: Positive — consistent financial performance, strong pharma pipeline, and robust technical structure suggest higher upside potential.
📊 Technical Snapshot
DRREDDY has broken out from a triangle formation, supported by a Morning Star candlestick on the daily timeframe and a Bullish PinBar on the monthly chart — both strong reversal cues. A bullish Supertrend, RSI breakout, and Bollinger Band expansion signal renewed buying interest. Volume above the 20-SMA average further validates the breakout, suggesting institutional participation. While momentum is strong, Stochastic is near overbought, which means short-term pullbacks cannot be ruled out. However, as long as price sustains above key support zones, the broader trend bias remains upward.
📊 Volume Check
🔹 Current Volume: 2.01M
🔹 20 SMA Volume: 1.61M ✅
💥 Above-average participation → confirms breakout reliability with demand expansion.
💡 Interpretation: Higher-than-average volumes in breakout zones indicate broader market participation and improve the chances of trend continuation.
💡 Learnings
Breakouts from consolidation patterns like triangles tend to extend into trending moves when supported by momentum indicators (RSI + MACD). Elevated CCI levels indicate consistent buying pressure, but traders should remain alert to possible short pullbacks, especially when Stochastic enters the overbought zone. Defining a stop-loss and invalidation level is key for disciplined trade management.
📌 Key Levels
Resistance: 1292 | 1308 | 1334
Support: 1251 | 1225 | 1209
Fibonacci Levels: 1138.50 | 1195.40 | 1230.65 | 1259.10 | 1287.55 | 1328.10 | 1379.70
🎯 STWP Learning Reference
• Observed breakout zone: ~1281.8
• Key support level: ~1236
• Upside reference zones (if momentum continues): 1327 | 1372
• Pullback watch zone: 1224–1230 (where demand has earlier emerged)
• Invalidation reference: Below 1195 (trend may weaken)
⚠️ Disclaimer – Please Read Carefully
The information shared here is meant purely for learning and awareness. It is not a buy or sell recommendation and should not be taken as investment advice. I am not a SEBI-registered investment advisor, and all views expressed are based on personal study, chart patterns, and publicly available market data.
Trading — whether in stocks or options — carries risk. Markets can move unexpectedly, and losses can sometimes exceed the money you have invested. Past performance or past setups do not guarantee future results.
If you are a beginner, treat this as a guide to understand how the market works — practice on paper trades before risking real money. If you are experienced, always assess your own risk, position sizing, and strategy suitability before entering trades.
Consult a SEBI-registered financial advisor before making any real trading decision. By engaging with this content, you acknowledge full responsibility for your trades and investments.
💬 Found this useful?
🔼 Give this post a Boost to help more traders discover clean, structured learning.
✍️ Drop your thoughts, questions, or setups in the comments — let’s grow together!
🔁 Share with fellow traders and beginners to spread awareness.
✅ Follow simpletradewithpatience for beginner-friendly setups, price action insights & disciplined trading content.
🚀 Stay Calm. Stay Clean. Trade With Patience.
Trade Smart | Learn Zones | Be Self-Reliant 📊
Bollinger Bands (BB)
KWALITY PHARMA - Bollinger Band ExpansionOn Weekly chart Bolling band is expanding on upside with high Volumes. Can show good momentum in coming week. Support is 637 and Target can be 1015

PCJEWELLER: BB Squeeze Again!PCJEWELLER is again in narrow Bollinger Band squeeze which happens repeatedly with this stock (red arrows) and then it breaks out explosively up. RSI and volumes show nothing significant as of now. BB squeeze can lead to massive up or down break. Waiting if it will breakout again this time.

Triveni Engineering & Industries LTD - Multiple Indicators 📊 Script: TRIVENI (TRIVENI ENGINEERING & INDUSTRIES LIMITED)
📊 Nifty50 Stock: NO
📊 Sectoral Index: NIFTY500nif
📊 Sector: Fast Moving Consumer Goods
📊 Industry: Sugar / Agricultural Food & other Products
DAILY TIMEFRAME W PATTERN BREAKOUT
WEEKLY TIMEFRAME MACD CROSSOVER AND DOUBLE MOVING AVERAGE CROSSOVER SOON
Key highlights: 💡⚡
This stock pick is according to my study. I have use few indicator that is
BOLLINGER BAND
MACD
RSI
DOUBLE MOVING AVERAGE
VOLUME
📈 Script is trading at upper band of Bollinger Bands (BB) and giving breakout of it.
📈 Crossover in MACD .
📈 Already Crossover in Double Moving Averages.
📈 Volume is increasing along with price which is volume breakout.
📈 Current RSI is around 76.
📈 One can go for Swing Trade.
⏱️ C.M.P 📑💰- 291
🟢 Target 🎯🏆 - 339
⚠️ Stoploss ☠️🚫 - 267/260
⚠️ Important: Always maintain your Risk & Reward Ratio.
✅Like and follow to never miss a new idea!✅
Disclaimer: I am not SEBI Registered Advisor. My posts are purely for training and educational purposes.
Eat🍜 Sleep😴 TradingView📈 Repeat 🔁
Happy learning with trading. Cheers!🥂

Why am I bearish on IndusTowerHey, check out the trade setup for Industower
All 3 parameters are matched for a short trade.
Trade setup in Futures
Short : 193.10
Stoploss : 201
Target : 170 and 163
Options Trade
Bear Spread
Buy 29Sep2022 195PE
Sell 29Sep2022 190PE
Max. Profit: ₹ +7,280
Max. Loss: ₹ -6,720


Short ITC below 195 (Targets 184, 176, 157)Price has met resistance at 193-195 levels with 2 sweet Spinning Tops.
100 Day SMA @ 195.50 is a potential resistance.
Square off if it closes above 195 on Daily. A tight stop loss but playing safe; open to fresh entries.
GLHF!

gold set up trend and imp zones gold TREND up , as long as 1640 positionally is on hold ..
its a buy on dip ositional with 1640 stop close
downide levels to watch max 1600 ( if 1640 breaks) while upside levels to watch is 1710


looks good !!! would like to accumulate .. WE AILL BE ARRANGING A FREE basic TECHNICAL ANALYSIS workshop from tomorrow (saturday) in case one has to attend canplease contact on my WHATSAPP NO . 823 7 555 768 so as i can provide the link to attend it online !

Equifax (EFX} DailyIn September this year the credit monitoring company plunged nearly 10% witnessing a collossal 35% drop after it disclosed last Friday a massive data breach, which possibly impacted up to 143 million Americans. The stock's drop has wiped out about $6 billion of its market value in the process. The Equifax breach was not the largest ever, but it was notable for the kind of information that was put at risk.Post that the prices had reached oversold region and then the rebound happened over the past few days have started struggling near the 38.2% Fibonacci retracement of the sharp decline. After rebounding a minimum 1/3 the selling pressure has started emerging and the Bollinger Band has narrowed forming a squeeze leading to a possible decline in the coming days. Hence a short below 107 is a good trade to initiate.Once it emerges updates shall follow.

HDFC triangle breakout pullbackThe stock has broken out of an upward sloping triangle with good volumes.
The shooting star at trendline and bollinger band resistance is followed by a red candle will lead to a pullback to the breakout resistance (now support) giving us an opportunity to buy.
The RSI's overbought signal indicates the same.
A very great stock, also considering the pressure on PSU banks, private banks like HDFC would do well.
Medium and long term trend is up. (50,100,200 MA's)
Target, let your profits run until you get a clear reversal signal.

NIFTY gartley/ harmonic pattern Lets see if a reversal signal is generated.
Nifty has filled the last two recent gaps, so I am expecting it to fill this one too if the pattern becomes valid.
BB has tightened up, a breakdown could add to confirmation. (Median 20 MA acting as support for now at 9602-9604.

Zee Entertainment: Volatility Drops, Price Ready for a SpikeThe stock has been consolidating in a tight range recently. Notice the convergence in the Bollinger Bands, suggesting a potential "squeeze". The price has also bounced off the lower line of the trend channel, which is another positive sign. This stock is in my watchlist.

5 Days EMA crossing 50 Days EMA with Bullish bollinger Band ExpaHDIL stock is making a bullish move from range of 75-80 to the upper range of 90-95 in weekly charts...
5 days EMA is crossing 50 Days EMA from below with an expansion of bollinger band which is supposed to be very bullish move.. and RSI is around 60....
80 to 81 is a good buying range with a Stop Loss of 77-78 and further targets would be 90-95...
In monthly charts there is a 50 days EMA in the range of 90-95 which could act as a strong resistance so booking profit below the EMA would be good .....
Please Like, Follow and comment your views too.. :)

IDBI : set-up for a big moveTarget 107 | Stop-loss 61
* Multi-week sideways consolidation (read accumulation)
* Bollinger Band contraction
* Momentum oscillators inching towards buy crossover
