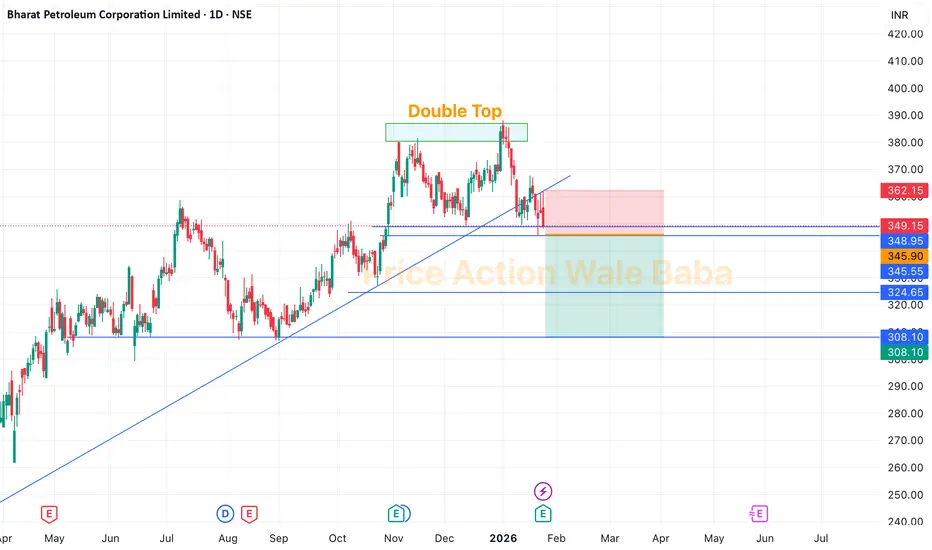
BPCL - Double TopBPCL is forming a Double Top which is has neckline of 345.
Delivery Based Selling Strategy:
Sell below 345,
Keep SL on high of 23rd Jan candle, which is 361.
Targets are 320-300.
Option Buying Strategy
So, for the option trading in this stock, you can choose any PUT option on BPCL, mark high of 21st Jan candle in option, once it breaks it just buy and keep SL below same day's low.
BPCL
NIFTYBEES : Position to systematically de-risk BPCL tradeToday’s sharp correction in BPCL and the broader Oil & Gas space reflects a classic “geopolitical discount.” With the U.S. threatening a steep 500% tariff, uncertainty around OMC earnings has surged, triggering risk-off positioning across the sector.
In response, I’m de-risking the portfolio by initiating an allocation into Nifty BeES. The Nifty 50 is currently consolidating around its 20-day and 50-day EMAs, a zone that historically acts as a strong demand area. The probability of price finding support at these levels and staging a rebound remains high.
While BPCL faces near-term headwinds from potential inventory losses and pressure from discounted Russian crude dynamics, the Nifty 50 is structurally supported by its Banking and IT heavyweights, which continue to benefit from improving earnings visibility and relative global stability.
This trade is therefore not a directional bet alone, but a strategic hedge—aimed at balancing portfolio risk, reducing volatility, and maintaining market participation amid heightened geopolitical uncertainty.
📢📢📢
If my perspective changes or if I gather additional fundamental data that influences my views, I will provide updates accordingly.
Thank you for following along with this journey, and I remain committed to sharing insights and updates as my trading strategy evolves. As always, please feel free to reach out with any questions or comments.
Other posts related to this particular position and scrip, if any, will be attached underneath. Do check those out too.
Disclaimer : The analysis shared here is for informational purposes only and should not be considered as financial advice. Trading in all markets carries inherent risks, and past performance is not indicative of future results. It’s essential to conduct your own research and assess your risk tolerance before making any investment decisions. The views expressed in this analysis are solely mine. It’s important to note that I am not a SEBI registered analyst, so the analysis provided does not constitute formal investment advice under SEBI regulations.

BPCL Breaks Structure, Big Targets Ahead: Long-Term Chart TurnsBPCL is currently positioned at a highly important zone on the higher-timeframe chart where price is attempting to shift from a prolonged consolidation into a potential expansion phase. The stock has respected a long-term structure and is now trading near a critical breakout region, making it an interesting candidate for positional and long-term traders. However, the setup is still in the developing stage and requires confirmation before any aggressive long exposure.
From a structure perspective, BPCL has formed a broad base after a long corrective phase. Price action is compressing near the upper boundary of this range, suggesting that volatility expansion could occur in the coming sessions. A sustained move above the key resistance zone, accompanied by strong volume and follow-through candles, would indicate strength and increase the probability of an upside continuation toward higher targets.
In the bullish scenario, a confirmed breakout and successful retest could open the path for a gradual move toward the next resistance cluster. If momentum sustains, the stock may attempt a trend continuation move in phases rather than a straight rally. Positional traders should focus on price holding above the breakout level on closing basis, as this will be the primary sign of trend acceptance by the market.
On the other hand, if BPCL fails to break and hold above the resistance zone, the stock may slip back into its previous consolidation range. In such a case, sideways or corrective movement cannot be ruled out, and premature long positions may face drawdowns. A deeper rejection from resistance would indicate that buyers are not yet in control.
Risk management remains crucial in this setup. Since the breakout is not yet confirmed, any long exposure should be planned only after clear confirmation, with a strict stop loss below the invalidation zone. This approach helps protect capital while allowing participation in the upside if the breakout sustains.
Overall, BPCL is at a decisive technical juncture. The chart structure favors a bullish bias in the medium to long term, but confirmation is key. Traders and investors should remain patient, track price behavior around the breakout zone, and act only when the market clearly validates the move.

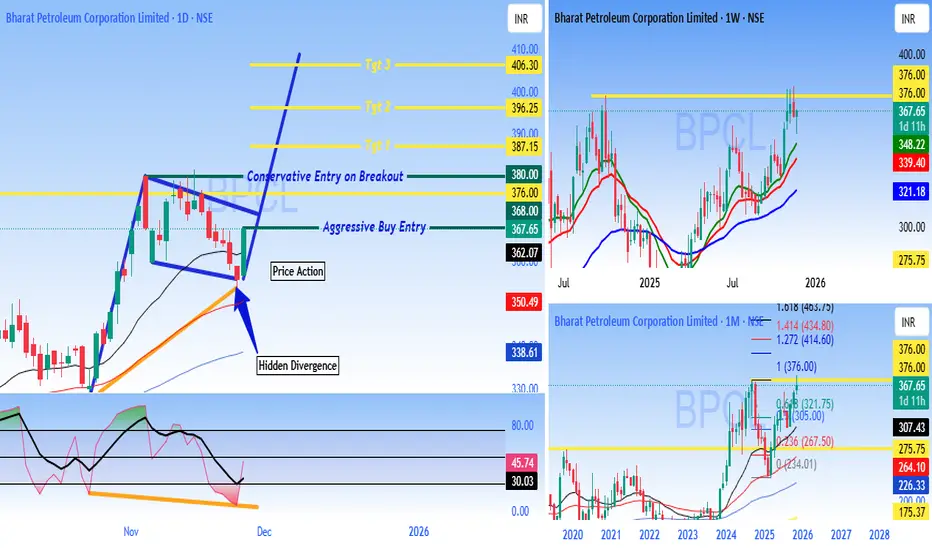
BPCL - Buy - ATH breakout - Technical Analysis#Bharat Petroleum Corporation Limited (BPCL) - #Technical Analysis Report
Current Price: 356.80 (Daily)
Multi-Timeframe Technical Analysis:
BPCL is displaying strong bullish momentum across multiple timeframes with a compelling technical setup featuring **Hidden Divergence** and a clear breakout structure on the daily chart.
Daily Chart Analysis - Key Technical Patterns:
1. Hidden Divergence Confirmed
- Classic Trend continuation signal indicating the uptrend is likely to resume with strength
2. Breakout Structure
- Stock has broken out from a consolidation zone around ₹362
- Currently trading above key resistance turned support
3. Trade Entry:
Aggressive Buy Entry:
As #Priceaction has formed already for traders who want immediate entry Buy will be active above 367.65
Conservative Entry on Breakout:
Initiate trades on candle close above 380
Price Targets
Target 1: 387.15
Target 2: 396.25
Target 3: 406.30
These targets are based on Fibonacci extensions and resistance zones from the pattern structure.
Weekly & Monthly Chart Context
Weekly Chart Shows:
- Strong uptrend since 2024 lows
- Stock trading near multi-year highs around 367-370 zone
- Higher highs and higher lows pattern intact
- Moving averages well-aligned in bullish configuration
Monthly Chart Indicates:
- Long-term recovery from 2020-2023 correction phase
- Breaking out from multi-year resistance zone
- Potential for extended rally toward ₹376-400 zone
Momentum Indicators
- Hidden divergence on daily timeframe = Bullish continuation
- Price action showing strength above key moving averages
- Volume expansion on breakout candles (positive sign)
- RSI/Momentum indicators supporting the upward move
The combination of bullish patterns and momentum indicators suggests potential for continuation toward higher targets. Traders should maintain strict risk management and adjust positions based on price action at key levels.
DISCLAIMER
This analysis is for educational and informational purposes only and should NOT be considered as investment advice or a recommendation to buy, sell, or hold any securities - I am NOT a SEBI registered analyst or investment advisor - This is purely a technical analysis based on chart patterns, indicators, and price action - Past performance and technical patterns do not guarantee future results - Trading and investing in stocks involves substantial risk of loss and may not be suitable for all investors - Always conduct your own research, due diligence, and analysis before making any investment decisions - Consult with a qualified financial advisor before taking any investment positions - The author/analyst holds no responsibility for any profits or losses incurred based on this analysis - Risk management is crucial - never invest more than you can afford to lose - Stop losses are mandatory for capital protection - Markets can remain irrational longer than you can remain solvent
Trade/Invest at your own risk. DYOR (Do Your Own Research).
#BPCL #TechnicalAnalysis #StockMarket #NSE #IndianStocks #Trading #HiddenDivergence #Breakout #OilAndGas #PSU #ChartAnalysis #TradingView #SwingTrading #DayTrading #PriceAction #StockTrading #MarketAnalysis #OMC #EnergyStocks #BullishSetup
Resistance Breakout in BPCLBPCL has exhibited a notable resistance breakout on the daily chart, closing above ₹348 and marking a positive uptrend. This move is accompanied by a significant surge in the 350 November call option, up over 50%, confirming bullish sentiment. The breakout is supported by strong candle structure and aligns both spot and option price action, suggesting momentum continuation. Traders may consider BPCL for momentum-based strategies, monitoring for a move towards the next resistance. As always, disciplined risk management is advised when entering trades after key breakouts. This setup strengthens the bullish outlook for BPCL short-term.

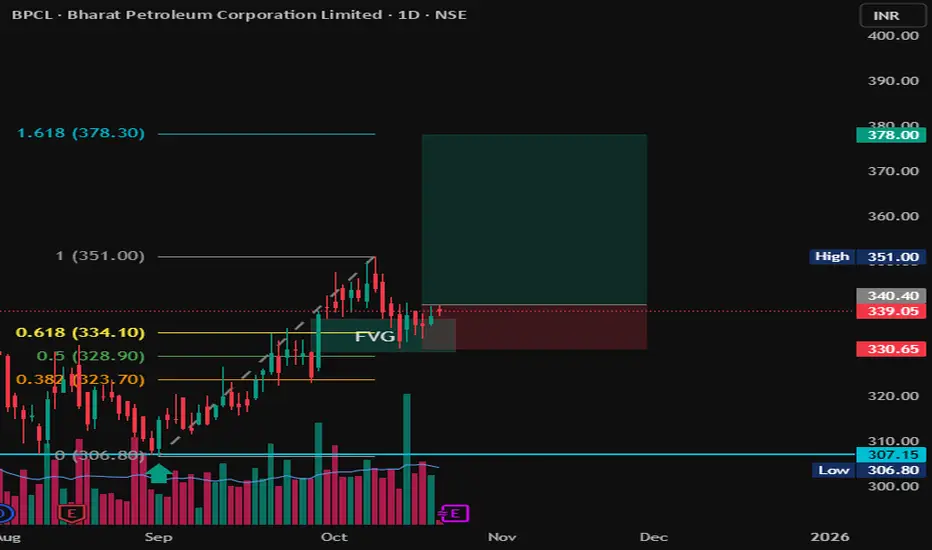
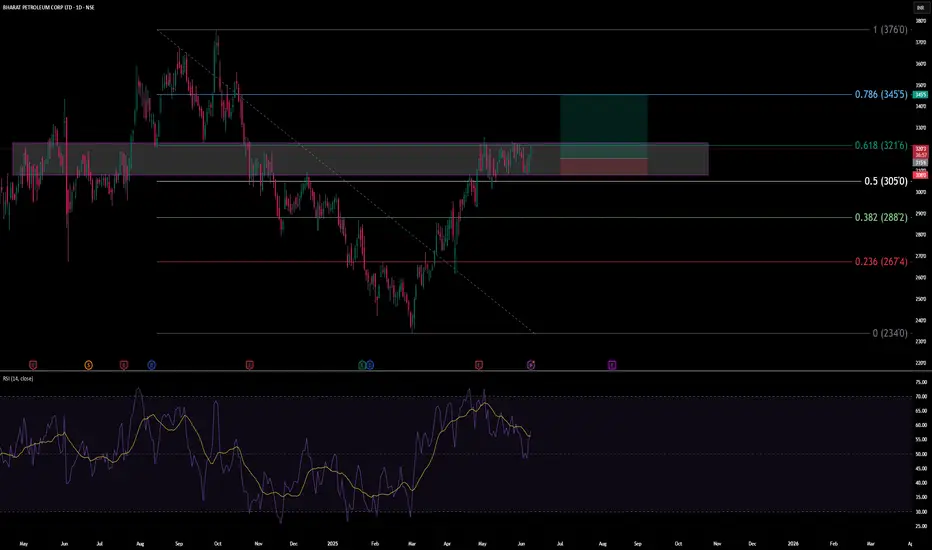
BPCL | FVG + Fibonacci COnfluence | Long Setup toward 378 💬 Description:
Chart Type: 1D (Daily)
Stock: BPCL – Bharat Petroleum Corporation Ltd.
🧩 Setup Overview
BPCL has completed a clean retracement into a Fair Value Gap (FVG) aligning with the 0.5–0.618 Fibonacci retracement zone from the previous upswing (306 → 351).
The zone around ₹334–₹340 acted as strong demand support, hinting at a possible continuation leg to the upside.
📊 Trade Plan
Entry Zone: ₹338–₹340
Stop Loss: ₹330
Target 1: ₹351
Target 2: ₹378 (1.618 Fib Extension)
Risk–Reward Ratio: ~1:3
📈 Technical Confluence
✅ FVG + 0.618 Fib alignment
✅ Retest & bounce confirmation
✅ Volume showing accumulation
✅ Clear higher-low structure maintained
🚨 Invalidation
Setup invalid if price closes below ₹330, which would break FVG and shift structure to bearish.
🧠 Bias: Bullish continuation
Time Horizon: Swing (2–4 weeks)
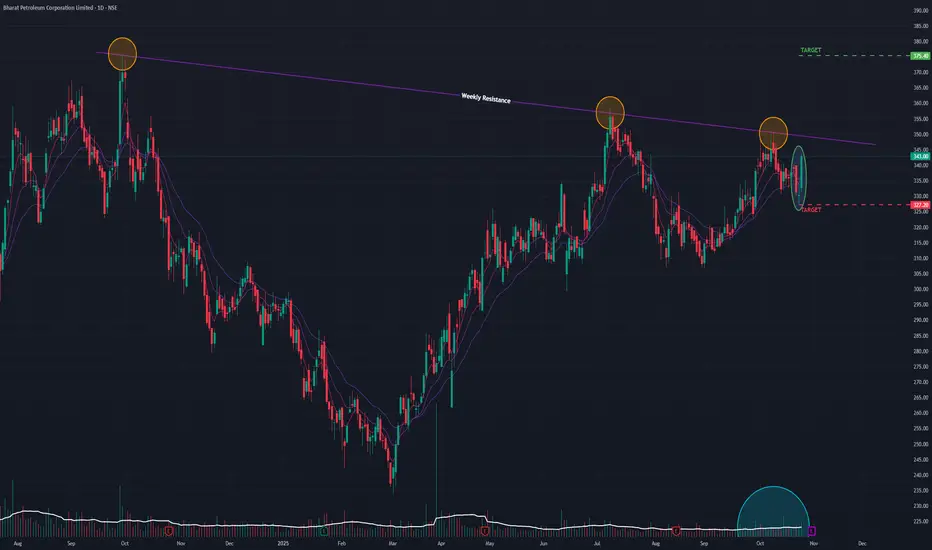
BPCL (D): Forms Bullish MorningStar, Challenges Major ResistanceAfter reversing from a short-term downtrend, BPCL (Bharat Petroleum Corporation Ltd) has flashed a powerful bullish signal. However, this newfound momentum is now running directly into a major, long-term resistance trendline that has capped its progress, setting the stage for a critical battle.
The Bullish Setup: A Morning Star at Support
Today's price action (Monday, October 27, 2025) was highly constructive for the bulls:
- Price & Volume Surge: The stock rallied +3.80% on a strong volume of 11.77 million shares .
- Classic Reversal Pattern: This move completed a "Morning Star" candlestick pattern . This is a classic three-candle bullish reversal pattern that often signals the bottom of a downtrend and a new shift in momentum.
Broad-Based Technical Strength
This bullish pattern is strongly supported by a powerful alignment of indicators across all major timeframes (Monthly, Weekly, and Daily):
- Short-Term EMAs: All three timeframes are in a bullish Positive Crossover (PCO) state.
- RSI (Relative Strength Index): The RSI is also in a rising trend on all three timeframes.
This multi-timeframe alignment indicates that the underlying momentum is broad, synchronized, and strengthening.
The Immediate Hurdle: Long-Term Resistance
Despite these bullish signals, the stock is now positioned less than 2% below a major long-term resistance trendline formed since its All-Time High. This line represents a significant historical barrier for the stock.
Outlook and Key Levels to Watch
The stock is at a clear "prove it" moment. The outcome of the battle at this resistance will likely determine the next major move.
- Bullish Breakout Scenario: A decisive close above the long-term resistance on high volume would confirm the breakout and validate the Morning Star pattern. This would signal a continuation of the new uptrend, with a potential next target of ₹375 .
- Bearish Rejection Scenario: If the stock fails to breach this resistance and momentum fades, it could be rejected. The first key support level would be the bottom of the Morning Star pattern, around ₹325 .
In conclusion, the price action in the coming days is critical. All eyes should be on this key resistance level for either a confirmed breakout or a rejection.
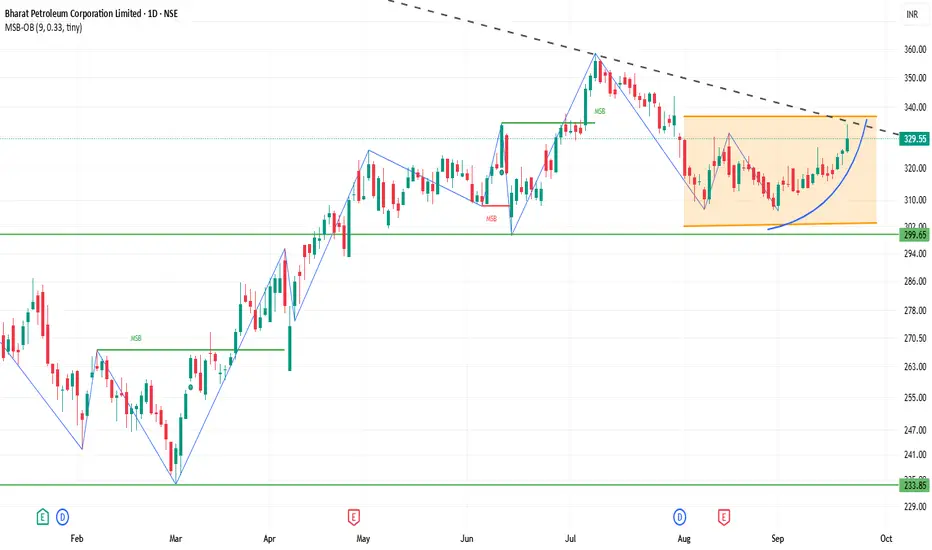
BPCL 1D Time frame📊 Current Snapshot
Closing Price: ₹329.55
Day's Range: ₹324.80 – ₹334.00
52-Week Range: ₹234.01 – ₹376.00
Market Capitalization: ₹1,42,975 Crores
Volume: Approximately 10 million shares traded
P/E Ratio: 8.14
Dividend Yield: 2.99%
⚙️ Technical Indicators
Relative Strength Index (RSI): 60.31 – Neutral to slightly bullish
Moving Average Convergence Divergence (MACD): 0.29 – Neutral
Moving Averages: Short-term averages (5, 10, 20, 50, 100, 200-day) are above the current price, indicating potential resistance.
Pivot Points: Central pivot around ₹322.30, suggesting a balanced market sentiment.
🎯 Possible Scenarios
Bullish Scenario: A breakout above ₹328.25 with strong volume could target ₹331.80 and higher levels.
Bearish Scenario: Failure to hold above ₹325.85 may lead to a decline toward ₹322.30.
⚠️ Key Considerations
Market Sentiment: BPCL has shown strong performance recently, but broader market conditions can impact its movement.
Volume Analysis: Watch for volume spikes to confirm breakout or breakdown signals.
Technical Indicators: While the RSI indicates a neutral to slightly bullish stance, the MACD and moving averages suggest caution.
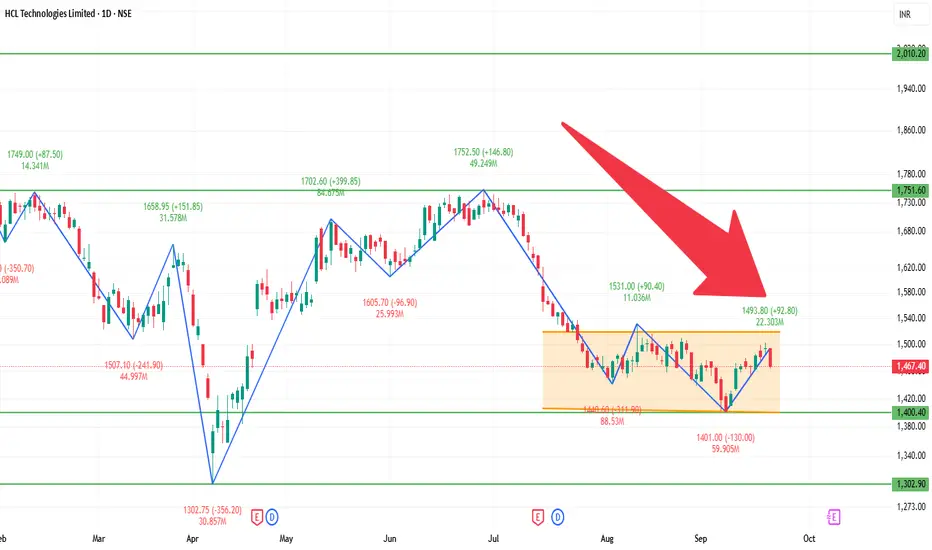
HCLTECH 1D Time frame📊 Current Overview
Price is trading near ₹1,460 – ₹1,470 range.
Trend on the daily chart is showing weakness.
Stock is trading below most key moving averages (50-day, 100-day, 200-day).
🔍 Support & Resistance
Immediate Support: ₹1,450
Next Support: ₹1,430 – ₹1,420
Immediate Resistance: ₹1,470 – ₹1,475
Higher Resistance: ₹1,490 – ₹1,500
📈 Indicators
RSI (14): Neutral to slightly bearish, around mid-40s.
MACD: Weak, showing bearish crossover or flat momentum.
Trend: More sideways to bearish unless resistance levels break.
🎯 Possible Scenarios
Bullish: If HCLTECH breaks and sustains above ₹1,475, it could target ₹1,490 – ₹1,500.
Bearish: If it fails and slips below ₹1,450, it may fall towards ₹1,430 – ₹1,420.
NIFTY 1D Time frame📍 Current Level
25,114.00 (closing value)
Short-Term Outlook
Bullish Scenario: A sustained move above ₹25,200 could lead to a test of the 52-week high around ₹26,277.35.
Bearish Scenario: A drop below ₹25,000 may signal a potential pullback toward ₹24,800.

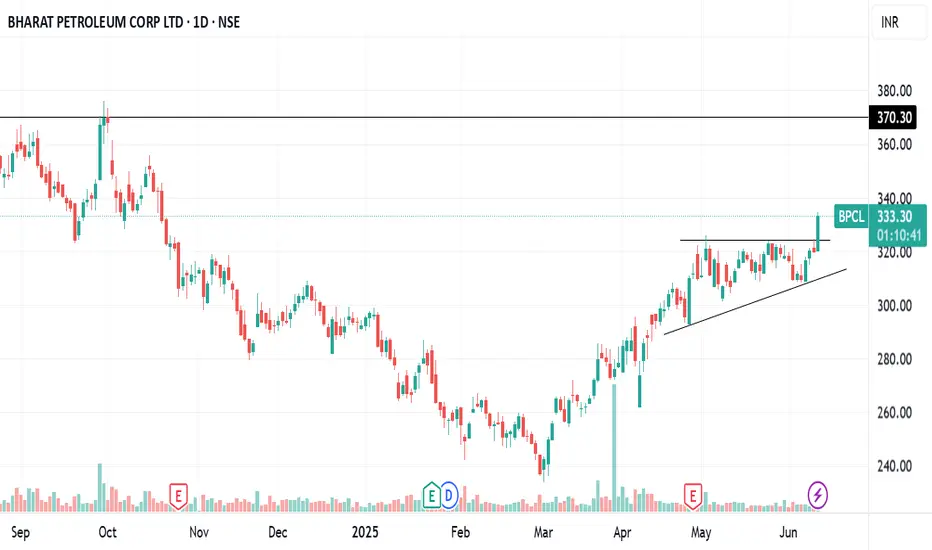
BPCL – Trendline Support Holding StrongOn the daily chart, BPCL has once again respected its trendline support around the ₹309–310 zone, showing buying interest at lower levels. The stock has bounced back and is currently trading near ₹323.
Price Action Insight: A decisive bounce from support indicates that bulls are actively defending this level.
Upside Potential: Immediate target lies near ₹330+ if momentum sustains.
Options Data: The BPCL 325 CE (28th Aug 2025) witnessed strong buying interest with a gain of +17% today, confirming traders’ confidence in a short-term upward move.
🔑 Key Levels to Watch:
Support: ₹309
Resistance: ₹330 / ₹335
A sustained move above ₹330 may open the path for further upside, while a break below ₹309 could shift sentiment.

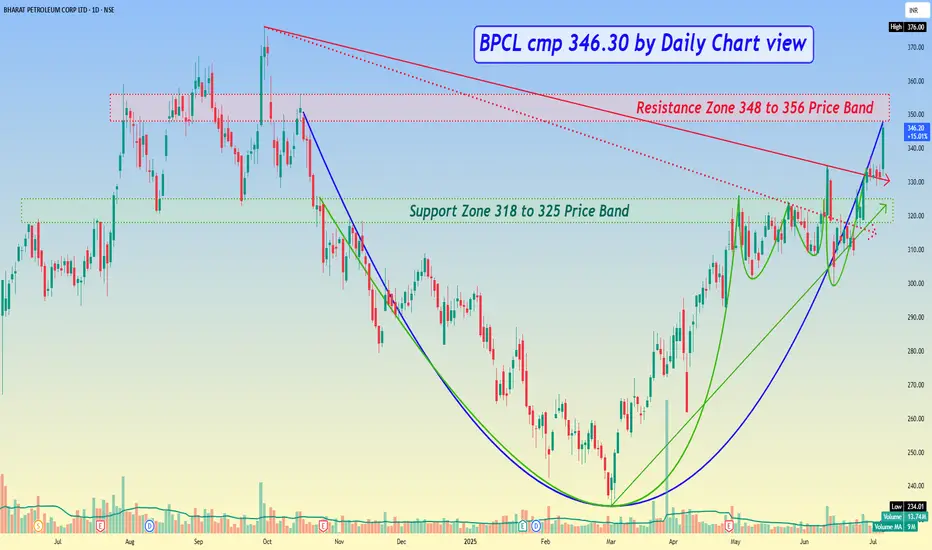
BPCL cmp 346.30 by Daily Chart viewBPCL cmp 346.30 by Daily Chart view
- Support Zone 318 to 325 Price Band
- Resistance Zone 348 to 356 Price Band
- Strong Bullish Technical Chart Setup indicative of good upside once price crossover and sustains closure above Resistance Zone
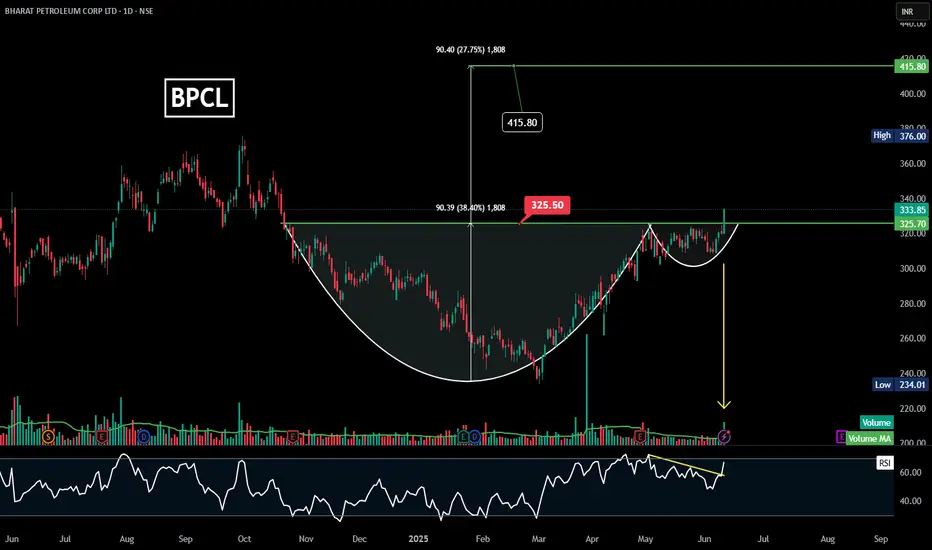
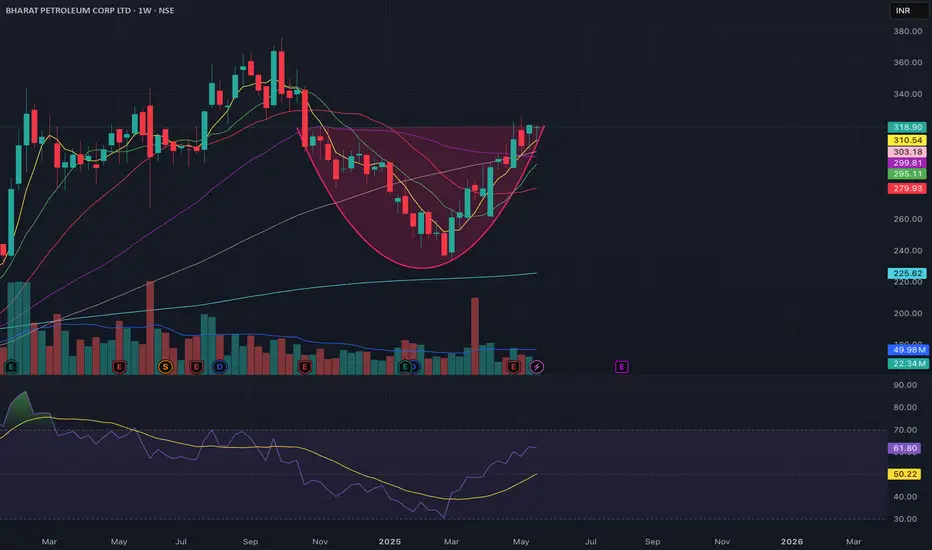
BPCL | Cup and Handle | Breakout |Daily
### 🏺 **Pattern Overview:**
✅ **Cup and Handle Formation:**
* **Cup period:** November 2024 – June 2025.
* **Handle period:** Short, forming in May 2025 – breakout seen recently.
✅ **Breakout Confirmation:**
* **Breakout point:** ₹325.50 (previous resistance).
* **Current breakout price:** ₹333.85 with strong momentum.
---
### 🎯 **Target Levels:**
* **Measured move target:** ₹415.80 (as marked).
* **Near-term resistance:** ₹376 (prior swing high).
* **Support:** ₹325– (previous breakout level).
---
### 📊 **Volume & RSI Insights:**
* **Volume:** Surge on breakout day – confirms buyer interest.
* **RSI:** Clear bullish breakout above a downward-sloping trendline (marked in yellow arrow).
---
### 💡 **Takeaway:**
BPCL has **confirmed a cup and handle breakout** above ₹325. If it sustains above this level, a move towards ₹376–₹415+ is probable in the coming weeks.
BPCL ASCENDING TRIANGLE BREAKOUTBPCL breaking ascending triangle pattern
bullish RSI ,huge volume
macd crossover done
#target 370
NO BUY/SELL RECOMENDATION
BPCl is working on a rise after a short consolidation.This is a Paper Trade Idea on BPCL.
After the recent correction it has managed to go above 0/5 fib retraction and taking the next levels.
here is a quick trading idea with given stoploss and targets.
let me know your thoughts.
BPCL ready to breakout with target of 400CUP formation in W.
MA supports maintained.
Some consolidation is anticipated.
RSI above 50.
wait for breakout above 326 for targets of 400
#TORNTPOWER 1668 TGT 15% 1940+ NSE:TORNTPOWER
Target 1940 15% upside
NSE:TORNTPOWER CPM 1668
TGT 1940+ (15%)
SL 1550
TF < 6M
If you like my work KINDLY LIKE SHARE & FOLLOW this page for free Stock Recommendations. With 💚 from Rachit Sethia

BPCL 1D TFNSE:BPCL is 2/2 stock that I missed to post on Oct - 21.This stock has been trading near the trend line and has broken it and went downwards. As Nifty was also moving on the downside, this short position is traded and is still running towards take profit
Disclaimer:- This analysis is only for educational purpose. Please always do your own analysis or consult with your financial advisor before taking any kind of trades

MRPL for 100% gainsDate: 17 Oct’24
Symbol: MRPL
Timeframe: Daily
Mangalore Refineries & Petrochemicals seems to be in final stages of Wave 4. If it goes down further from present level, 160 should hold well. Both rising volumes and divergence in RSI suggest accumulation in progress in the stock. Wave 5 can mount to around 330-340 (2X from current price of 169). I can review the target once it heads above 230 levels.
This is not a trade recommendation. Please do your own analysis.
HINGLISH VERSION
Aisa lagta hai ki Mangalore Refinery and Petrochemicals Wave 4 ke antim charan mein hain. Yadi yah vartamaan star se aur neeche jaata hai, to 160 level ko hold karna chahiye. Badhti volume aur RSI mein vichalan donon hi stock mein accumulation ka sanket dete hain. Wave 5 lagabhag 330-340 (vartamaan keemat 169 se 2 guna) tak badh sakta hai. Ek baar 230 ke star se oopar pahunch jae to main iske target ki dubara sameeksha kar sakta hoon.
Yah koi trade lene ki salah nahin hai. Kripya apna vishleshan svayan karen.

BPCLAll important points are marked.
𝐃𝐢𝐬𝐜𝐥𝐚𝐢𝐦𝐞𝐫: 𝐈𝐧𝐯𝐞𝐬𝐭𝐦𝐞𝐧𝐭 𝐢𝐧 𝐬𝐞𝐜𝐮𝐫𝐢𝐭𝐢𝐞𝐬 𝐦𝐚𝐫𝐤𝐞𝐭 𝐚𝐫𝐞 𝐬𝐮𝐛𝐣𝐞𝐜𝐭 𝐭𝐨 𝐦𝐚𝐫𝐤𝐞𝐭 𝐫𝐢𝐬𝐤𝐬, 𝐫𝐞𝐚𝐝 𝐚𝐥𝐥 𝐭𝐡𝐞 𝐫𝐞𝐥𝐚𝐭𝐞𝐝 𝐝𝐨𝐜𝐮𝐦𝐞𝐧𝐭𝐬 𝐜𝐚𝐫𝐞𝐟𝐮𝐥𝐥𝐲 𝐛𝐞𝐟𝐨𝐫𝐞 𝐢𝐧𝐯𝐞𝐬𝐭𝐢𝐧𝐠. 𝐒𝐭𝐨𝐜𝐤𝐬 𝐬𝐮𝐠𝐠𝐞𝐬𝐭𝐞𝐝 𝐢𝐧 𝐭𝐡𝐢𝐬 𝐠𝐫𝐨𝐮𝐩 𝐚𝐫𝐞 𝐟𝐨𝐫 𝐞𝐝𝐮𝐜𝐚𝐭𝐢𝐨𝐧 𝐩𝐮𝐫𝐩𝐨𝐬𝐞. 𝐖𝐞 𝐝𝐨𝐧𝐭 𝐦𝐚𝐤𝐞 𝐚𝐧𝐲 𝐩𝐫𝐨𝐟𝐢𝐭𝐬 𝐟𝐫𝐨𝐦 𝐭𝐡𝐢𝐬 𝐫𝐞𝐜𝐨𝐦𝐦𝐞𝐧𝐝𝐚𝐭𝐢𝐨𝐧𝐬 𝐞𝐯𝐞𝐫𝐲𝐭𝐡𝐢𝐧𝐠 𝐬𝐡𝐚𝐫𝐞𝐝 𝐡𝐞𝐫𝐞 𝐚𝐫𝐞 𝐜𝐨𝐦𝐩𝐥𝐞𝐭𝐞𝐥𝐲 𝐨𝐟 𝐟𝐫𝐞𝐞 𝐨𝐟 𝐜𝐨𝐬𝐭.

Bullish Harami candlestick Pattern Seen near support zoneHello Everyone, i hope you all will be doing good in your trading and your life as well. I have brought a stock which has taken support near to important support zone and has formed bullish Harami (Pregnant Lady) candlestick pattern. Nifty is highly bullish so all the stocks giving participation in the rally, BPCL just have started. Behalf of this Harami candlestick pattern stock can react and take support in this zone and price can move upward from here. All the Targets, entry levels and the Stop loss has already mention on chart above. Please go through to know that.
First let's discuss about this Bulish Harami Candlestick Pattern.
Bullish Harami candlestick pattern is a price chart pattern that signals trend reversals in an ongoing bear market. Bullish Harami candlestick pattern is a two candlestick pattern in which there is a long bearish candlestick and small bullish candlestick pattern.
About
Bharat Petroleum Corporation is a public sector company which is engaged in the business of refining of crude oil and marketing of petroleum products.
Presence Across Value Chain
Retail (Petroleum) - The company owns 82 retail depots and operates ~20,000 retail outlets across India. Presently, it has a market share of ~26% in the domestic petroleum market.
LPG - The company owns and operates 54 LPG bottling plants and serves over 6,200 distributors of LPG in India. It has a base of ~9 crore customers with a market share of 27%.
Industrial/ Commercial - The company serves 8,000+ customers and provides them with a reliable supply of industrial and commercial petroleum products.
Aviation - The company has 56 aviation service stations across airports in India and has a 21% market share in ATF (Aviation Turbine Fuel) in the domestic market.
Lubricants - The company sells more than 400 grades of lubricant products through its own brand MAK Lubricants. It has a market share of ~25% through a base of over 18,000 customers.
Gas - The company has a customer base of 55+ major LNG customers. The company undertakes this business through its wholly owned subsidiary Bharat Gas Resources Ltd which has business interest in 50 GAs (geographical areas).
Market Cap
₹ 1,46,685 Cr.
Current Price
₹ 338
High / Low
₹ 367 / 166
Stock P/E
7.53
Book Value
₹ 174
Dividend Yield
6.21 %
ROCE
32.1 %
ROE
41.9 %
Face Value
₹ 10.0
Industry PE
10.4
Debt
₹ 54,599 Cr.
EPS
₹ 43.9
Promoter holding
53.0 %
Intrinsic Value
₹ 352
Pledged percentage
0.00 %
EVEBITDA
5.25
Change in Prom Hold
0.00 %
Profit Var 5Yrs
28.2 %
Sales growth 5Years
8.48 %
Return over 5years
7.77 %
Debt to equity
0.72
Net profit
₹ 19,056 Cr.
ROE 5Yr
23.0 %
Profit growth
-2.86 %
Earnings yield
15.5 %
PEG Ratio
0.27
Disclaimer:- Please always do your own analysis or consult with your financial advisor before taking any kind of trades.
Dear traders, If you like my work then do not forget to hit like and follow me, and guy's let me know what do you think about this idea in comment box, i would be love to reply all of you guy's.
Thankyou.

BPCL - BHARAT PETROLEUM CORP LTD🔊 BPCL - BHARAT PETROLEUM CORP LTD
⌛Trade Type - Swing Trade (1 week to 2 week)
📊📈 Trade Logic - VCP Pattern
CMP - 356.45
Time Frame - Daily
🎯Target 1 : 375
🎯Target 2 : 390
🎯Target 3 : 400
🎯Target 4 : 420
🛑 Stop : 340
🏆 Risk/Reward Ratio (1: 4)
Disclaimer: The stock information shared above is not a recommendation to buy, sell, or hold. It reflects my own analysis and is intended solely for educational purposes. Any actions you take based on this information are your responsibility, and the admin of this channel is not liable for any financial gains or losses. Please consult a financial advisor before making any investment decisions. I am not a SEBI-registered advisor.

BPCL Trade Analysis for Buy using Wyckoff method.Wyckoff Story
Prior to trading range we were in uptrend and then we have Stoping action and CHoCH (Change of character). Let’s assume our bias is accumulation based on CHoCH as we don’t see lot of supply in the CHoCH.
Down wave Analysis
We can see that the volatility of the down wave is decreasing from Phase A to Phase D, confirming the accumulation Bias.
Volume Analysis
In Phase B we see increase in supply but the price is not able to go below the trading range, lot of effort to push the price down but fails, indicating effort vs result is not synced. Confirming the accumulation bias.
We have supply decrease from Phase A to Phase C indicating supply is being absorbed.
Sign of Strength
we have Major sign of strength in phase D with good demand volume indicating institutions are present in buying.
Final View
Bullish on stock with entry marked on the chart
