BPCL

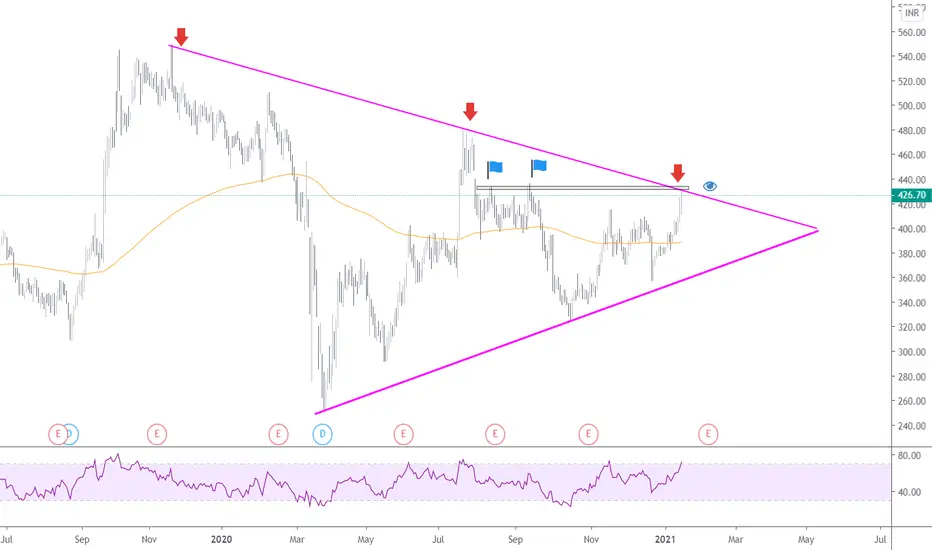
BPCL Wedge PatternFor study..
Trading inside Wedge pattern, put it in your watchlist
better to enter when it breaks the pattern,
Like, Comment & Follow.. For more chart analysis.

BPCL LongPiercing Pattern found in BPCL.
Target whatever level you are comfortable with.
Stoploss - lowest low of the two candles

Long on BPCLBPCL took support at the long-term trendline. I am going long for a swing trade with an initial target of 420.

BPCL - Inverted Bullish hammerNote: This is for educational purpose only.
There seems to be an inverted bullish hammer at support of ascending triangle. RSI seems to bouncing from support line.


BPCL LONG....Above 410
Target 439-470
Weak below 355
above all important moving average
Volume contraction from past few days

BPCL INTRADAY CYPHERIf BPCL opens near 406, intraday 411, 414 levels possible.
This is just my observation & not a trade recommendation. Pl do your own research before entering.

Short BPCL below 411I shared the buy idea on breakout a few days back which did well and now stock showing some weakness in the daily time frame. Sell only if sustains below 411 for the targets of 406, 402, and 396 until 416 is saved on the upside.
To motivate me, Please like the idea If you agree with the analysis.
Happy Trading!
InvestPro India Team


BPCL trend reversalBPCL was in a very clear uptrend from 22nd December... after that yesterday it formed a green candle with small wicks, today it opened gap up but could not retain the price and closed deep into yesterday's body.
The encircled pattern is called Dark Cloud Cover.
As the name suggests, a downtrend is expected after the appearance of this pattern.
You can keep a target of the 200-day exponential moving average.
The stop loss will be the highest high among both the candles forming the pattern.
In this case, the highest high is the high of the first day (green) candle.

BPCL
Breakout possible ? Do not forget there is a gap 446-439 range.
Might act as resistance. So keep a close watch.
BPCL in a symmetrical triangleBPCL is trading inside a symmetrical triangle and waiting for a move in either direction. Have tested the upper resistance line quite a few times, till now there is neither a breakout nor a breakdown, lets see how it pans out.

BPCL chart - Techincal Breakout on Weekly ChartsBPCL weekly chart updated for Educational Purpose by ssveducation. Strong Breakout on Weekly Charts. Expected Levels 560-570 in short to medium term.

BPCL ready for the Breakout!!!Go ling when it breaks 424 and sustain above it
Volumes are good
Targets are mentioned on the cart
Maintain the SL of 400

BPCLReady for breakout or breakdown atlast. If breakout thenone can go for long term target for 450-500-550. also when breakout or breakout a very good intraday script is there.

BPCL Long BreakoutBPCL is breaking out of it's resistance level for long positional trading with visible resistance at market price of 500.

BPCL weekly charts looks interesting bpcl have good and strong support and resistance and forming triangle pattern as well keep watching

BPCL - Strong BUY for 15% potential profit BPCL has shown a trendline breakout today with high volume .
The indicators like MACD and EMA are showing bullish trend.
The RR ratio is also around 4 for 15% potential profit in a short term.

massive brake out in #BPCLmassive brake out in #BPCL
JUST wait and see where it go .... comment below how far this rally continues 😊
