BPCL

Swing Trading Analysis: BPCL (Bharat Petroleum Corporation Ltd)Note Higher high higher low formation,
breakout with good volume, retracement
after the breakout, Now Pull back process
started from here. (Stock: BPCL)


BPCL BHARAT PETRO CORPBPCL LONG POSITION TAGET 445
STOP LOSS= 392
RISK % = 70 % USE RISK REWARD RATIO

BPCL Trade!I think it is the right to buy this stock. SL will be 395. Target is around 440 and 480-485.


BPCL- long, Target- 447/464, SL-397Disclaimer- The chart is for educational purpose only. Invest/trade at your own risk.

BPCL- long, Target- 447/464, SL- 398Disclaimer: The chart is for educational purpose only. Invest/trade at your own risk.

bpclwave 2 has a retracement of 78.6%. the 3 wave is not extensive but normal which has a retracement level of 161.8%. the retracement of wave 4 is 38.2% still the price spends more time on wave 4.
if you want to grab the profit, you need to ride on the wave 5 which has a retracement level of 61.8%.
there are high chances of wave 5 to be extended.
target 525


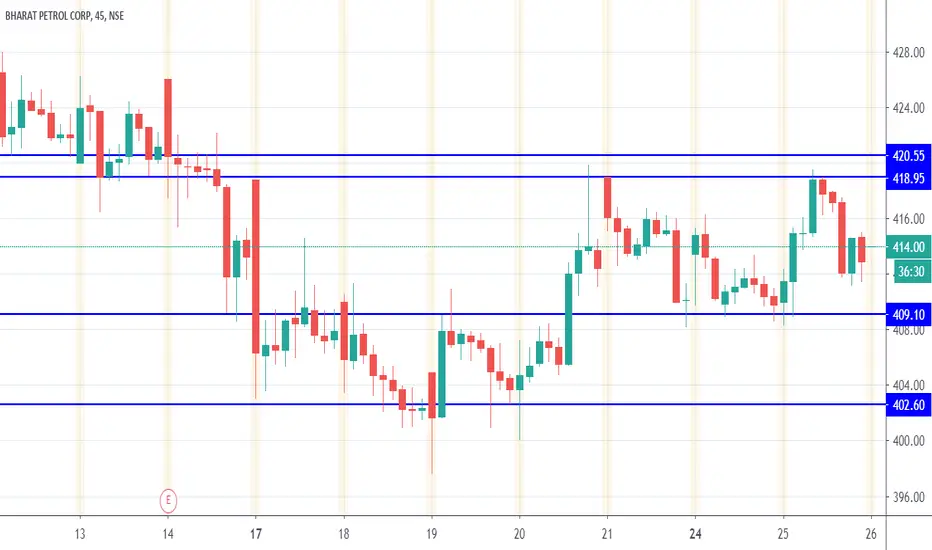
Biocon Short Term Analysis_Avoid for Tradinga. Zone: Neutral
b. Resistance 1: 418.95(Double Top Bearish Pattern)
c. Resistance 2: 420.55
d. Support 1: 409.10
e. Support 2: 402.60(Double Bottom Bullish Pattern)
NSE:BPCL
BPCL 24.08.2020 RESISTANCE AND SUPPORT POINTS RESISTANCE: 420-430
SUPPORT: 408
BUY/SELL ON FORMATION


BPCL - Intraday Trading Setup Smart money accumulated before starting uptrend.
They will try to defend the position by buying when price comes into buy zone.
Regards MuneshV

"PRICE ACTION ANALYSIS FOR BPCL"Hello Traders as per PRICE ACTION THEORY
I have drwan the directional arrows which price can follow for upcoming sessions!
If you want to trade enter in PullBacks for conservative entry and for agressive traders enter in the Breakout keep the stoploss above(Short) or below(Long) the last swing..
IF YOU WANT ANY OTHER ANALYSIS LET ME KNOW IN THE COMMENT SECTION OR DM ME!
Also checkout my other analysis and if you like them dont forget to like them and follow me!
-Rv The Trader :)

BPCL is getting ready to ride on the wave 5Hello! Friends,
I have come up with a new research an idea but, before starting to talk about technical things, Let's share your LOVE by you giving me LIKES and COMMENTS. Thanks in advance.
--------------------------------------------------------------------------
"" DAILY CHART ""
--------------------------------------------------------------------------
Here we can see daily chart of BPCL.
right now, in BPCL daily timeframe we can see the bullish trend. By applying EW Theory we get to know that wave 2 has a retracement of 78.6%. the 3 wave is not extensive but normal which has a retracement level of 161.8%. the retracement of wave 4 is 38.2% still the price spends more time on wave 4.
now, if you want to grab the profit, you need to ride on the wave 5 which has a retracement level of 61.8%.
there are high chances of wave 5 to be extended.
longterm take profit can be 520.
Thank you.
we will meet in the next analysis


